Exam 10: Quantitative Data Analysis
Exam 1: Science, Society, and Social Research46 Questions
Exam 2: The Process and Problems of Social Research50 Questions
Exam 3: Research Ethics35 Questions
Exam 4: Conceptualization and Measurement32 Questions
Exam 5: Generalizability and Sampling29 Questions
Exam 6: Causation and Experimental Design26 Questions
Exam 7: Survey Research28 Questions
Exam 8: Qualitative Methods34 Questions
Exam 9: Unobtrusive Methods38 Questions
Exam 10: Quantitative Data Analysis51 Questions
Exam 11: Qualitative Data Analysis38 Questions
Exam 12: Summarizing and Reporting Research44 Questions
Select questions type
Honesty and ______ are the key ethical principles that should guide data summaries.
Free
(Multiple Choice)
5.0/5  (34)
(34)
Correct Answer: Verified
D
Describe the different types of graphs utilized by quantitative researchers. When graphs are appropriate for the display of data. How can graphs potentially distort the display of information? Why must researchers work to avoid these issues?
Free
(Essay)
4.9/5 (20)
Correct Answer:Verified
Answers may vary. Students should explain the basics types of graphs including bar charts, histograms, and frequency polygons. Students should highlight the features of graphs and illustrate when researcher use graphs. They should discuss how graphs can be misused including an explanation how differences in bar shapes, sizes, spacing, etc. can impact the visualization of the data and ultimately distort the impression of the distribution. They may also discuss the issue of "chart junk" and how this clutter can distort the representation of data or interpretation of findings. Students should summarize the ethical requirements related to quantitative research and reiterate the importance of openness and honesty in the presentation of data.
The ______ accounts for the amount each case differs from the mean.
(Multiple Choice)
4.8/5 (29)
Which of the following is a graph that has adjacent bars to display the distribution of quantitative variables along a continuum?
(Multiple Choice)
4.9/5 (31)
Frequency distributions and ______ are the most common approaches for displaying the distribution of single variables.
(Multiple Choice)
4.8/5 (39)
To calculate range, a data analyst must take the highest value and ______ 1.
(Multiple Choice)
5.0/5 (34)
Which of the following should have the most influence on the choice to use the median or mean for summarizing the central tendency of quantitative variables?
(Multiple Choice)
4.9/5 (30)
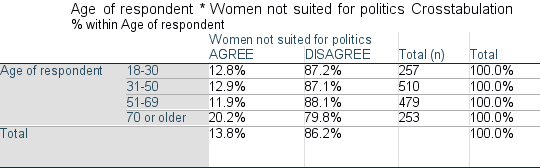
Describe how you should read the following table. In your discretion be careful to name the parts of the chart and establish what each tells us about the data.
Source: General Social Survey (National Opinion Research Center 2018).
Age of respondent * Women not suited for politics Crosstabulation
(Essay)
4.9/5 (29)
The extent to which cases are spread out through the distribution or clustered in one location is known as ______.
(Multiple Choice)
4.9/5 (33)
In a ______, a continuous line connects the points representing the number or percentage of cases with each value.
(Multiple Choice)
4.9/5 (40)
Summary statistics are not useful in representing key features of the distribution of a variable.
(True/False)
4.9/5 (41)
To illustrate the relation between two variables, such as attitude about employment discrimination against men and year, the analyst should use which of the following?
(Multiple Choice)
4.8/5 (43)
It is appropriate for an analysist to choose statistics that accentuate a particular feature of a distribution.
(True/False)
4.8/5 (35)
Which type of statistics are useful for representing key features of the distribution of a variable?
(Multiple Choice)
4.9/5 (31)
Margaret is analyzing data and sees that the majority of the cases in her study are clustered at one or the other end of the distribution. Margaret has discovered ______.
(Multiple Choice)
4.7/5 (31)
What factors must a researcher consider when analyzing data ethically? In other words, explain how data should be ethically collected and presented. Discuss the ramifications of the unethical collection or presentation of statistical data.
(Essay)
4.9/5 (25)
Filters
- Essay(0)
- Multiple Choice(0)
- Short Answer(0)
- True False(0)
- Matching(0)