Deck 2: Describing Quantitative Distributions With Numbers
Full screen (f)
Question
Question
Question
Question
Question
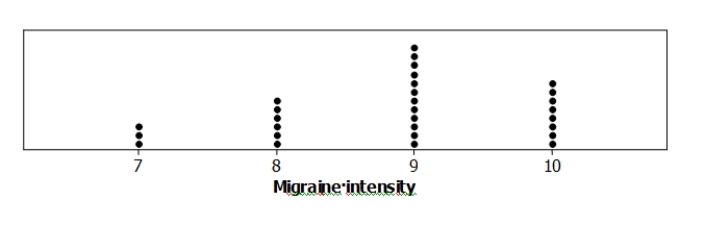
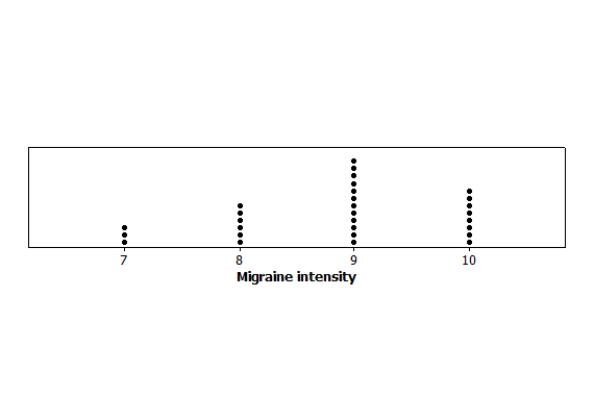
The following dotplot shows the migraine intensity (on a scale of 1 to 10) for 29 adults suffering from recurring migraines.
What is the median migraine intensity in this sample?
A)8
B)8.5
C)9
D)Impossible to determine
What is the median migraine intensity in this sample?
A)8
B)8.5
C)9
D)Impossible to determine
Question
The following dotplot shows the migraine intensity (on a scale of 1 to 10) for 29 adults suffering from recurring migraines.
What is the first quartile for this data set?
A)7.25
B)7.5
C)7.75
D)8
What is the first quartile for this data set?
A)7.25
B)7.5
C)7.75
D)8
Question
The following dotplot shows the migraine intensity (on a scale of 1 to 10) for 29 adults suffering from recurring migraines.
What is the third quartile for this data set?

A)9
B)9.25
C)9.5
D)10
What is the third quartile for this data set?
A)9
B)9.25
C)9.5
D)10
Question
The following dotplot shows the migraine intensity (on a scale of 1 to 10) for 29 adults suffering from recurring migraines.
 What is the five-number summary for this data set?
A)7, 8, 9, 10, 10
B)7, 8, 8.5, 9, 10
C)7, 7.5, 8.5, 9.5, 10
D)7, 7.5, 8.5, 9, 10
What is the five-number summary for this data set?A)7, 8, 9, 10, 10
B)7, 8, 8.5, 9, 10
C)7, 7.5, 8.5, 9.5, 10
D)7, 7.5, 8.5, 9, 10
Question
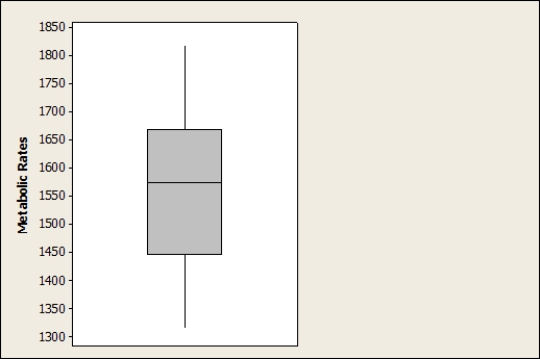
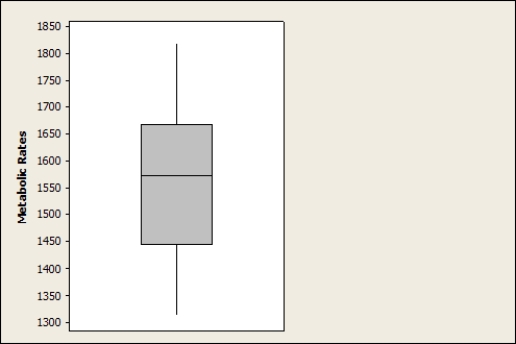
A sample was taken of the metabolic rates of men participating in a study regarding diets. The following boxplot depicts these rates (measured in kilocalories per 24 hours).
Based on this boxplot, to which value is the interquartile range closest?

A)75
B)175
C)200
D)500
Based on this boxplot, to which value is the interquartile range closest?
A)75
B)175
C)200
D)500
Question
A sample was taken of the metabolic rates of men participating in a study regarding diets. The following boxplot depicts these rates (measured in kilocalories per 24 hours).
Based on this boxplot, which of the following statements is TRUE?

A)The distribution of metabolic rates is fairly symmetric.
B)Approximately half the rates were greater than 1550.
C)None of the men had a rate less than 1200.
D)All of these choices are correct.
Based on this boxplot, which of the following statements is TRUE?
A)The distribution of metabolic rates is fairly symmetric.
B)Approximately half the rates were greater than 1550.
C)None of the men had a rate less than 1200.
D)All of these choices are correct.
Question
A sample was taken of the metabolic rates of men participating in a study regarding diets. The following boxplot depicts these rates (measured in kilocalories per 24 hours).
Which of the following statements would be true if each person in this data set increased his rate by 120 kilocalories per 24 hours?
A)The median would increase by 120.
B)The first quartile would decrease by 60.
C)The third quartile would increase by 60.
D)The interquartile range would increase by 120.
Question
A sample was taken of the metabolic rates of men participating in a study regarding diets. The following boxplot depicts these rates (measured in kilocalories per 24 hours).
Which metabolic rate do approximately 75% of the men exceed?
A)1325
B)1450
C)1575
D)1650
Which metabolic rate do approximately 75% of the men exceed?
A)1325
B)1450
C)1575
D)1650
Question
A sample was taken of the metabolic rates of men participating in a study regarding diets. The following boxplot depicts these rates (measured in kilocalories per 24 hours).
If 25 points were added to each rate, how would the standard deviation of the new distribution of rates change?

A)The standard deviation would increase by 5.
B)The standard deviation would increase by 25.
C)The standard deviation would increase by 625.
D)The standard deviation would remain unchanged.
If 25 points were added to each rate, how would the standard deviation of the new distribution of rates change?
A)The standard deviation would increase by 5.
B)The standard deviation would increase by 25.
C)The standard deviation would increase by 625.
D)The standard deviation would remain unchanged.
Question
Question
Question
Question
Question
Stream ecologists are interested in the number of distinct organisms found in streams, and whether differences exist based on geography. Separate random samples are obtained from sites in northeastern and southeastern streams, and the number of distinct organisms is recorded for each site. The data are given as separate boxplots for northeastern and southeastern streams.
 What is the approximate value of the median number of distinct organisms found in the sample of northeastern stream?
A)The median is approximately the same as for southeastern streams.
B)The median is approximately 14.
C)The median is approximately 33.
D)The median is approximately 37.
What is the approximate value of the median number of distinct organisms found in the sample of northeastern stream?A)The median is approximately the same as for southeastern streams.
B)The median is approximately 14.
C)The median is approximately 33.
D)The median is approximately 37.
Question
Question
Stream ecologists are interested in the number of distinct organisms found in streams, and whether differences exist based on geography. Separate random samples are obtained from sites in northeastern and southeastern streams, and the number of distinct organisms is recorded for each site. The data are given as separate boxplots for northeastern and southeastern streams.
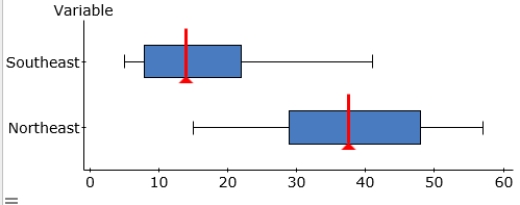 Which of the following statements about these data is correct?
A)The southeastern plot is skewed to the right.
B)The northeastern plot is nearly symmetric.
C)The median number of organisms found in northeastern streams is larger than the median for southeastern streams.
D)All of these answers are correct.
Which of the following statements about these data is correct?A)The southeastern plot is skewed to the right.
B)The northeastern plot is nearly symmetric.
C)The median number of organisms found in northeastern streams is larger than the median for southeastern streams.
D)All of these answers are correct.
Question
Question
A study of freely forming groups in bars throughout Europe examined the number of individuals found in groups that were laughing together. A summary of the 501 groups examined is shown here:
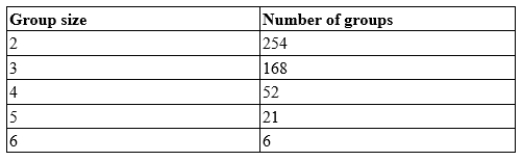 What is the median group size?
What is the median group size? Question
Question
Researchers measured the length of the central retrix (R1), a flight-involved tail feather, in 21 female long-tailed finches. A boxplot of the length, in millimeters (mm), is given here:
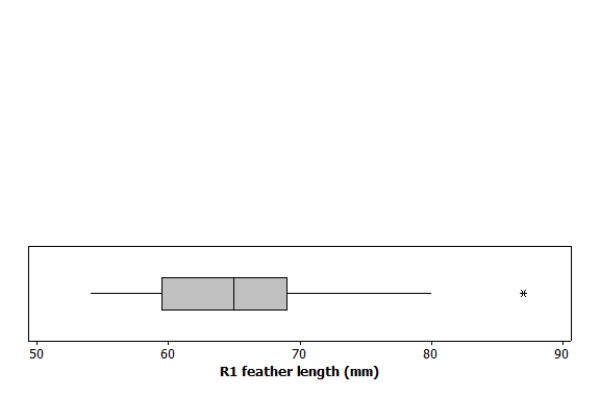 Based on this boxplot, to which value is the interquartile range closest?
A)10 mm
B)25 mm
C)60 mm
D)70 mm
Based on this boxplot, to which value is the interquartile range closest?A)10 mm
B)25 mm
C)60 mm
D)70 mm
Question
Researchers measured the length of the central retrix (R1), a flight-involved tail feather, in 21 female long-tailed finches. A boxplot of the length, in millimeters (mm), is given here:
 Based on this boxplot, which of the following statements is TRUE?
A)The distribution of R1 lengths is bimodal.
B)The distribution of R1 lengths has a high outlier.
C)In this study, 75% of the birds had an R1 length above 70 mm.
D)The mean R1 length is approximately 66.
Based on this boxplot, which of the following statements is TRUE?A)The distribution of R1 lengths is bimodal.
B)The distribution of R1 lengths has a high outlier.
C)In this study, 75% of the birds had an R1 length above 70 mm.
D)The mean R1 length is approximately 66.
Question
Question
Question
Question
Question
Question
Question
Question
Question
Question
Question
The following histogram shows the yearly number of unprovoked attacks by alligators on people in Florida over a 33-year period.
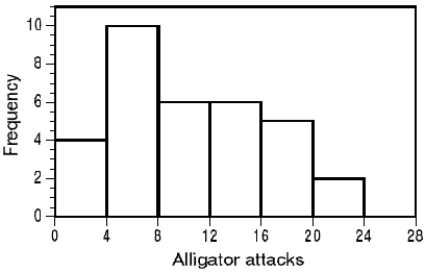 What must be the median yearly counts of alligator attacks?
A)A value in class 4 to 8
B)A value in class 8 to 12
C)Exactly 12
D)A value in class 12 to 16
What must be the median yearly counts of alligator attacks?A)A value in class 4 to 8
B)A value in class 8 to 12
C)Exactly 12
D)A value in class 12 to 16
Question
The following histogram shows the yearly number of unprovoked attacks by alligators on people in Florida over a 33-year period.
 What must be the third quartile of yearly counts of alligator attacks?
A)A value in class 12 to 16
B)A value in class 16 to 20
C)Exactly 18
D)A value greater than 14
What must be the third quartile of yearly counts of alligator attacks?A)A value in class 12 to 16
B)A value in class 16 to 20
C)Exactly 18
D)A value greater than 14
Question
Question
Question
Question
Question

Unlock Deck
Sign up to unlock the cards in this deck!
Unlock Deck
Unlock Deck
1/42
Play
Full screen (f)
Deck 2: Describing Quantitative Distributions With Numbers
1
A sample of 20 endangered species was obtained and the length of time (in months) since being placed on the list was recorded for each species. The ordered data follow:
52, 54, 58, 59, 59, 60, 60, 63, 65, 66, 67, 68, 69, 73, 74, 77, 78, 79, 79, 98
What is the median length of time (in months) since being placed on the list for these 20 species?
A)66.0
B)66.5
C)67.0
D)67.5
52, 54, 58, 59, 59, 60, 60, 63, 65, 66, 67, 68, 69, 73, 74, 77, 78, 79, 79, 98
What is the median length of time (in months) since being placed on the list for these 20 species?
A)66.0
B)66.5
C)67.0
D)67.5
B
2
A sample of 20 endangered species was obtained and the length of time (in months) since being placed on the list was recorded for each species. The ordered data follow:
52, 54, 58, 59, 59, 60, 60, 63, 65, 66, 67, 68, 69, 73, 74, 77, 78, 79, 79, 98
What is the mean length of time (in months) since being placed on the list for these 20 species?
A)66.32
B)66.50
C)67.90
D)68.25
52, 54, 58, 59, 59, 60, 60, 63, 65, 66, 67, 68, 69, 73, 74, 77, 78, 79, 79, 98
What is the mean length of time (in months) since being placed on the list for these 20 species?
A)66.32
B)66.50
C)67.90
D)68.25
C
3
A sample of 20 endangered species was obtained and the length of time (in months) since being placed on the list was recorded for each species. The ordered data follow:
52, 54, 58, 59, 59, 60, 60, 63, 65, 66, 67, 68, 69, 73, 74, 77, 78, 79, 79, 98
What is the first quartile of the length of time (in months) since being placed on the list for these 20 species?
A)5
B)59.5
C)74
D)75.5
52, 54, 58, 59, 59, 60, 60, 63, 65, 66, 67, 68, 69, 73, 74, 77, 78, 79, 79, 98
What is the first quartile of the length of time (in months) since being placed on the list for these 20 species?
A)5
B)59.5
C)74
D)75.5
B
4
A sample of 20 endangered species was obtained and the length of time (in months) since being placed on the list was recorded for each species. The ordered data follow:
52, 54, 58, 59, 59, 60, 60, 63, 65, 66, 67, 68, 69, 73, 74, 77, 78, 79, 79, 98
Which value would need to be exceeded for a data point to be considered an outlier when using the 1.5 × IQR rule?
A)75.5
B)83.5
C)91.5
D)99.5
52, 54, 58, 59, 59, 60, 60, 63, 65, 66, 67, 68, 69, 73, 74, 77, 78, 79, 79, 98
Which value would need to be exceeded for a data point to be considered an outlier when using the 1.5 × IQR rule?
A)75.5
B)83.5
C)91.5
D)99.5
Unlock Deck
Unlock for access to all 42 flashcards in this deck.
Unlock Deck
k this deck
5
The following dotplot shows the migraine intensity (on a scale of 1 to 10) for 29 adults suffering from recurring migraines.
What is the median migraine intensity in this sample?
A)8
B)8.5
C)9
D)Impossible to determine
What is the median migraine intensity in this sample?
A)8
B)8.5
C)9
D)Impossible to determine
Unlock Deck
Unlock for access to all 42 flashcards in this deck.
Unlock Deck
k this deck
6
The following dotplot shows the migraine intensity (on a scale of 1 to 10) for 29 adults suffering from recurring migraines.
What is the first quartile for this data set?
A)7.25
B)7.5
C)7.75
D)8
What is the first quartile for this data set?
A)7.25
B)7.5
C)7.75
D)8
Unlock Deck
Unlock for access to all 42 flashcards in this deck.
Unlock Deck
k this deck
7
The following dotplot shows the migraine intensity (on a scale of 1 to 10) for 29 adults suffering from recurring migraines.
What is the third quartile for this data set?
A)9
B)9.25
C)9.5
D)10
What is the third quartile for this data set?
A)9
B)9.25
C)9.5
D)10
Unlock Deck
Unlock for access to all 42 flashcards in this deck.
Unlock Deck
k this deck
8
The following dotplot shows the migraine intensity (on a scale of 1 to 10) for 29 adults suffering from recurring migraines.
What is the five-number summary for this data set?
A)7, 8, 9, 10, 10
B)7, 8, 8.5, 9, 10
C)7, 7.5, 8.5, 9.5, 10
D)7, 7.5, 8.5, 9, 10
What is the five-number summary for this data set?A)7, 8, 9, 10, 10
B)7, 8, 8.5, 9, 10
C)7, 7.5, 8.5, 9.5, 10
D)7, 7.5, 8.5, 9, 10
Unlock Deck
Unlock for access to all 42 flashcards in this deck.
Unlock Deck
k this deck
9
A sample was taken of the metabolic rates of men participating in a study regarding diets. The following boxplot depicts these rates (measured in kilocalories per 24 hours).
Based on this boxplot, to which value is the interquartile range closest?
A)75
B)175
C)200
D)500
Based on this boxplot, to which value is the interquartile range closest?
A)75
B)175
C)200
D)500
Unlock Deck
Unlock for access to all 42 flashcards in this deck.
Unlock Deck
k this deck
10
A sample was taken of the metabolic rates of men participating in a study regarding diets. The following boxplot depicts these rates (measured in kilocalories per 24 hours).
Based on this boxplot, which of the following statements is TRUE?
A)The distribution of metabolic rates is fairly symmetric.
B)Approximately half the rates were greater than 1550.
C)None of the men had a rate less than 1200.
D)All of these choices are correct.
Based on this boxplot, which of the following statements is TRUE?
A)The distribution of metabolic rates is fairly symmetric.
B)Approximately half the rates were greater than 1550.
C)None of the men had a rate less than 1200.
D)All of these choices are correct.
Unlock Deck
Unlock for access to all 42 flashcards in this deck.
Unlock Deck
k this deck
11
A sample was taken of the metabolic rates of men participating in a study regarding diets. The following boxplot depicts these rates (measured in kilocalories per 24 hours).
Which of the following statements would be true if each person in this data set increased his rate by 120 kilocalories per 24 hours?
A)The median would increase by 120.
B)The first quartile would decrease by 60.
C)The third quartile would increase by 60.
D)The interquartile range would increase by 120.
Unlock Deck
Unlock for access to all 42 flashcards in this deck.
Unlock Deck
k this deck
12
A sample was taken of the metabolic rates of men participating in a study regarding diets. The following boxplot depicts these rates (measured in kilocalories per 24 hours).
Which metabolic rate do approximately 75% of the men exceed?
A)1325
B)1450
C)1575
D)1650
Which metabolic rate do approximately 75% of the men exceed?
A)1325
B)1450
C)1575
D)1650
Unlock Deck
Unlock for access to all 42 flashcards in this deck.
Unlock Deck
k this deck
13
A sample was taken of the metabolic rates of men participating in a study regarding diets. The following boxplot depicts these rates (measured in kilocalories per 24 hours).
If 25 points were added to each rate, how would the standard deviation of the new distribution of rates change?
A)The standard deviation would increase by 5.
B)The standard deviation would increase by 25.
C)The standard deviation would increase by 625.
D)The standard deviation would remain unchanged.
Unlock Deck
Unlock for access to all 42 flashcards in this deck.
Unlock Deck
k this deck
14
Here is the ordered data of body temperatures (in degrees Fahrenheit) for 65 healthy adult women:
96.4, 96.7, 96.8, 97.2, 97.2, 97.4, 97.6, 97.7, 97.7, 97.8, 97.8, 97.8, 97.9, 97.9, 97.9,
98.0, 98.0, 98.0, 98.0, 98.0, 98.1, 98.2, 98.2, 98.2, 98.2, 98.2, 98.2, 98.3, 98.3, 98.3,
98.4, 98.4, 98.4, 98.4, 98.4, 98.5, 98.6, 98.6, 98.6, 98.6, 98.7, 98.7, 98.7, 98.7, 98.7,
98.7, 98.8, 98.8, 98.8, 98.8, 98.8, 98.8, 98.8, 98.9, 99.0, 99.0, 99.1, 99.1, 99.2, 99.2,
99.3, 99.4, 99.9, 100.0, 100.8
What is the median body temperature according to these data?
A)98.0
B)98.35
C)98.4
D)98.5
Unlock Deck
Unlock for access to all 42 flashcards in this deck.
Unlock Deck
k this deck
15
Here is the ordered data of body temperatures (in degrees Fahrenheit) for 65 healthy adult women:
96.4, 96.7, 96.8, 97.2, 97.2, 97.4, 97.6, 97.7, 97.7, 97.8, 97.8, 97.8, 97.9, 97.9, 97.9,
98.0, 98.0, 98.0, 98.0, 98.0, 98.1, 98.2, 98.2, 98.2, 98.2, 98.2, 98.2, 98.3, 98.3, 98.3,
98.4, 98.4, 98.4, 98.4, 98.4, 98.5, 98.6, 98.6, 98.6, 98.6, 98.7, 98.7, 98.7, 98.7, 98.7,
98.7, 98.8, 98.8, 98.8, 98.8, 98.8, 98.8, 98.8, 98.9, 99.0, 99.0, 99.1, 99.1, 99.2, 99.2,
99.3, 99.4, 99.9, 100.0, 100.8
What is the first quartile of body temperatures for this data set?
A)97.5
B)97.6
C)97.9
D)98.0
Unlock Deck
Unlock for access to all 42 flashcards in this deck.
Unlock Deck
k this deck
16
Here is the ordered data of body temperatures (in degrees Fahrenheit) for 65 healthy adult women:
96.4, 96.7, 96.8, 97.2, 97.2, 97.4, 97.6, 97.7, 97.7, 97.8, 97.8, 97.8, 97.9, 97.9, 97.9,
98.0, 98.0, 98.0, 98.0, 98.0, 98.1, 98.2, 98.2, 98.2, 98.2, 98.2, 98.2, 98.3, 98.3, 98.3,
98.4, 98.4, 98.4, 98.4, 98.4, 98.5, 98.6, 98.6, 98.6, 98.6, 98.7, 98.7, 98.7, 98.7, 98.7,
98.7, 98.8, 98.8, 98.8, 98.8, 98.8, 98.8, 98.8, 98.9, 99.0, 99.0, 99.1, 99.1, 99.2, 99.2,
99.3, 99.4, 99.9, 100.0, 100.8
What is the third quartile of body temperatures for this data set?
A)98.8
B)99.0
C)99.5
D)99.9
Unlock Deck
Unlock for access to all 42 flashcards in this deck.
Unlock Deck
k this deck
17
Here is the ordered data of body temperatures (in degrees Fahrenheit) for 65 healthy adult women:
96.4, 96.7, 96.8, 97.2, 97.2, 97.4, 97.6, 97.7, 97.7, 97.8, 97.8, 97.8, 97.9, 97.9, 97.9,
98.0, 98.0, 98.0, 98.0, 98.0, 98.1, 98.2, 98.2, 98.2, 98.2, 98.2, 98.2, 98.3, 98.3, 98.3,
98.4, 98.4, 98.4, 98.4, 98.4, 98.5, 98.6, 98.6, 98.6, 98.6, 98.7, 98.7, 98.7, 98.7, 98.7,
98.7, 98.8, 98.8, 98.8, 98.8, 98.8, 98.8, 98.8, 98.9, 99.0, 99.0, 99.1, 99.1, 99.2, 99.2,
99.3, 99.4, 99.9, 100.0, 100.8
Which value would need to be exceeded for a data point to be considered an outlier when using the 1.5 × IQR rule?
A)99.6
B)99.8
C)100.0
D)100.8
Unlock Deck
Unlock for access to all 42 flashcards in this deck.
Unlock Deck
k this deck
18
Stream ecologists are interested in the number of distinct organisms found in streams, and whether differences exist based on geography. Separate random samples are obtained from sites in northeastern and southeastern streams, and the number of distinct organisms is recorded for each site. The data are given as separate boxplots for northeastern and southeastern streams.
What is the approximate value of the median number of distinct organisms found in the sample of northeastern stream?
A)The median is approximately the same as for southeastern streams.
B)The median is approximately 14.
C)The median is approximately 33.
D)The median is approximately 37.
What is the approximate value of the median number of distinct organisms found in the sample of northeastern stream?A)The median is approximately the same as for southeastern streams.
B)The median is approximately 14.
C)The median is approximately 33.
D)The median is approximately 37.
Unlock Deck
Unlock for access to all 42 flashcards in this deck.
Unlock Deck
k this deck
19
Stream ecologists are interested in the number of distinct organisms found in streams, and whether differences exist based on geography. Separate random samples are obtained from sites in northeastern and southeastern streams, and the number of distinct organisms is recorded for each site. The data are given as separate stemplots for northeastern and southeastern streams.
What is the mean number of distinct organisms recorded for northeastern streams?
A)16.93
B)36.93
C)37.50
D)Cannot be determined from the information given
What is the mean number of distinct organisms recorded for northeastern streams?
A)16.93
B)36.93
C)37.50
D)Cannot be determined from the information given
Unlock Deck
Unlock for access to all 42 flashcards in this deck.
Unlock Deck
k this deck
20
Stream ecologists are interested in the number of distinct organisms found in streams, and whether differences exist based on geography. Separate random samples are obtained from sites in northeastern and southeastern streams, and the number of distinct organisms is recorded for each site. The data are given as separate boxplots for northeastern and southeastern streams.
Which of the following statements about these data is correct?
A)The southeastern plot is skewed to the right.
B)The northeastern plot is nearly symmetric.
C)The median number of organisms found in northeastern streams is larger than the median for southeastern streams.
D)All of these answers are correct.
Which of the following statements about these data is correct?A)The southeastern plot is skewed to the right.
B)The northeastern plot is nearly symmetric.
C)The median number of organisms found in northeastern streams is larger than the median for southeastern streams.
D)All of these answers are correct.
Unlock Deck
Unlock for access to all 42 flashcards in this deck.
Unlock Deck
k this deck
21
Which of the following statements correctly describes the five-number summary of a set of data?
A)It includes the mean, standard deviation, first quartile, median, and third quartile.
B)It includes the mean, median, interquartile range, variance, and standard deviation.
C)It can be computed from the information in a stemplot.
D)It includes the minimum, interquartile range, mean, median, and maximum.
Unlock Deck
Unlock for access to all 42 flashcards in this deck.
Unlock Deck
k this deck
22
A study of freely forming groups in bars throughout Europe examined the number of individuals found in groups that were laughing together. A summary of the 501 groups examined is shown here:
What is the median group size?
What is the median group size? Unlock Deck
Unlock for access to all 42 flashcards in this deck.
Unlock Deck
k this deck
23
A maze experiment uses 24 lab rats of various ages, as summarized here:
What is the median rat age (in months) for this maze experiment?
A)3.5
B)4
C)4.5
D)5
What is the median rat age (in months) for this maze experiment?
A)3.5
B)4
C)4.5
D)5
Unlock Deck
Unlock for access to all 42 flashcards in this deck.
Unlock Deck
k this deck
24
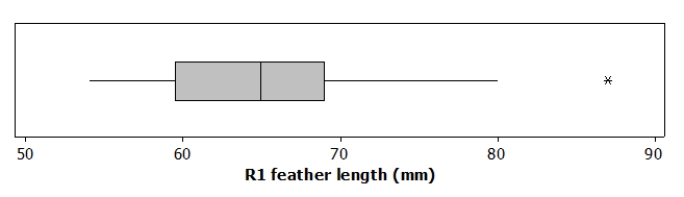
Researchers measured the length of the central retrix (R1), a flight-involved tail feather, in 21 female long-tailed finches. A boxplot of the length, in millimeters (mm), is given here:
Based on this boxplot, to which value is the interquartile range closest?
A)10 mm
B)25 mm
C)60 mm
D)70 mm
Based on this boxplot, to which value is the interquartile range closest?A)10 mm
B)25 mm
C)60 mm
D)70 mm
Unlock Deck
Unlock for access to all 42 flashcards in this deck.
Unlock Deck
k this deck
25
Researchers measured the length of the central retrix (R1), a flight-involved tail feather, in 21 female long-tailed finches. A boxplot of the length, in millimeters (mm), is given here:
Based on this boxplot, which of the following statements is TRUE?
A)The distribution of R1 lengths is bimodal.
B)The distribution of R1 lengths has a high outlier.
C)In this study, 75% of the birds had an R1 length above 70 mm.
D)The mean R1 length is approximately 66.
Based on this boxplot, which of the following statements is TRUE?A)The distribution of R1 lengths is bimodal.
B)The distribution of R1 lengths has a high outlier.
C)In this study, 75% of the birds had an R1 length above 70 mm.
D)The mean R1 length is approximately 66.
Unlock Deck
Unlock for access to all 42 flashcards in this deck.
Unlock Deck
k this deck
26
If the graph of a distribution of data is skewed, which measure of central tendency is most appropriate?
A)Midrange
B)Median
C)Mode
D)Mean
A)Midrange
B)Median
C)Mode
D)Mean
Unlock Deck
Unlock for access to all 42 flashcards in this deck.
Unlock Deck
k this deck
27
Geckos are lizards with specialized toe pads that enable them to easily climb all sorts of surfaces. A research team examined the adhesive properties of 7 Tokay geckos. Following are the toe-pad areas (in square centimeters, cm2) for this sample:
5.6 4.9 6.0 5.1 5.5 5.1 7.5
Rounded to two decimal places, what is the mean toe-pad area in this sample of geckos?
5.6 4.9 6.0 5.1 5.5 5.1 7.5
Rounded to two decimal places, what is the mean toe-pad area in this sample of geckos?
Unlock Deck
Unlock for access to all 42 flashcards in this deck.
Unlock Deck
k this deck
28
Geckos are lizards with specialized toe pads that enable them to easily climb all sorts of surfaces. A research team examined the adhesive properties of 7 Tokay geckos. Following are the toe-pad areas (in square centimeters, cm2) for this sample:
5.6 4.9 6.0 5.1 5.5 5.1 7.5
Using the correct units, what is the value of the sample variance of toe-pad areas?
A)0.89 cm2
B)0.89 cm4
C)0.79 cm2
D)0.79 cm4
5.6 4.9 6.0 5.1 5.5 5.1 7.5
Using the correct units, what is the value of the sample variance of toe-pad areas?
A)0.89 cm2
B)0.89 cm4
C)0.79 cm2
D)0.79 cm4
Unlock Deck
Unlock for access to all 42 flashcards in this deck.
Unlock Deck
k this deck
29
Geckos are lizards with specialized toe pads that enable them to easily climb all sorts of surfaces. A research team examined the adhesive properties of 7 Tokay geckos. Following are the toe-pad areas (in square centimeters, cm2) of this sample:
5.6 4.9 6.0 5.1 5.5 5.1 7.5
What is the first quartile for these data?
5.6 4.9 6.0 5.1 5.5 5.1 7.5
What is the first quartile for these data?
Unlock Deck
Unlock for access to all 42 flashcards in this deck.
Unlock Deck
k this deck
30
Geckos are lizards with specialized toe pads that enable them to easily climb all sorts of surfaces. A research team examined the adhesive properties of 7 Tokay geckos. Following are the toe-pad areas (in square centimeters, cm2) for this sample:
5.6 4.9 6.0 5.1 5.5 5.1 7.5
What is the value of the interquartile range for these data?
5.6 4.9 6.0 5.1 5.5 5.1 7.5
What is the value of the interquartile range for these data?
Unlock Deck
Unlock for access to all 42 flashcards in this deck.
Unlock Deck
k this deck
31
Geckos are lizards with specialized toe pads that enable them to easily climb all sorts of surfaces. A research team examined the adhesive properties of 7 Tokay geckos. Following are the toe-pad areas (in square centimeters, cm2) for this sample:
5.6 4.9 6.0 5.1 5.5 5.1 7.5
Which of the following ranges must a value fall outside of to be considered an outlier according to the 1.5 × IQR rule?
A)5.10 to 6.00
B)4.90 to 7.50
C)4.20 to 6.90
D)3.75 to 7.35
5.6 4.9 6.0 5.1 5.5 5.1 7.5
Which of the following ranges must a value fall outside of to be considered an outlier according to the 1.5 × IQR rule?
A)5.10 to 6.00
B)4.90 to 7.50
C)4.20 to 6.90
D)3.75 to 7.35
Unlock Deck
Unlock for access to all 42 flashcards in this deck.
Unlock Deck
k this deck
32
The distribution of ages of people in a class (to the nearest year) is as follows:
What is TRUE about the median age (to the nearest year) of this distribution?
A)It must be 20.
B)It could be any number between 19 and 21.
C)It must be 21.
D)It could be any number between 20 and 21.
What is TRUE about the median age (to the nearest year) of this distribution?
A)It must be 20.
B)It could be any number between 19 and 21.
C)It must be 21.
D)It could be any number between 20 and 21.
Unlock Deck
Unlock for access to all 42 flashcards in this deck.
Unlock Deck
k this deck
33
Which of the following data are likely to have a mean that is smaller than the median?
A)Right-skewed data
B)Left-skewed data
C)Bimodal data
D)Cyclical data
A)Right-skewed data
B)Left-skewed data
C)Bimodal data
D)Cyclical data
Unlock Deck
Unlock for access to all 42 flashcards in this deck.
Unlock Deck
k this deck
34
By inspection, which of the following sets of numbers has the smallest standard deviation?
A)7, 8, 9, 10
B)5, 5, 5, 5
C)0, 0, 10, 10
D)0, 1, 2, 3
A)7, 8, 9, 10
B)5, 5, 5, 5
C)0, 0, 10, 10
D)0, 1, 2, 3
Unlock Deck
Unlock for access to all 42 flashcards in this deck.
Unlock Deck
k this deck
35
Brown tree snakes are an invasive species causing huge environmental and financial damage in Guam. In June 2000, researchers captured 504 brown tree snakes on Guam's Andersen Air Force Base. On average, the snakes weighed 121 g, and their weights ranged from 23 to 663 g at capture. From this information, what can we conclude about the shape of the distribution of brown tree snake masses?
A)It must be roughly symmetric.
B)It must be left-skewed, have a low outlier, or both.
C)It must be right-skewed, have a high outlier, or both.
D)It must be multimodal (multiple-peaked).
A)It must be roughly symmetric.
B)It must be left-skewed, have a low outlier, or both.
C)It must be right-skewed, have a high outlier, or both.
D)It must be multimodal (multiple-peaked).
Unlock Deck
Unlock for access to all 42 flashcards in this deck.
Unlock Deck
k this deck
36
The following histogram shows the yearly number of unprovoked attacks by alligators on people in Florida over a 33-year period.
What must be the median yearly counts of alligator attacks?
A)A value in class 4 to 8
B)A value in class 8 to 12
C)Exactly 12
D)A value in class 12 to 16
What must be the median yearly counts of alligator attacks?A)A value in class 4 to 8
B)A value in class 8 to 12
C)Exactly 12
D)A value in class 12 to 16
Unlock Deck
Unlock for access to all 42 flashcards in this deck.
Unlock Deck
k this deck
37
The following histogram shows the yearly number of unprovoked attacks by alligators on people in Florida over a 33-year period.
What must be the third quartile of yearly counts of alligator attacks?
A)A value in class 12 to 16
B)A value in class 16 to 20
C)Exactly 18
D)A value greater than 14
What must be the third quartile of yearly counts of alligator attacks?A)A value in class 12 to 16
B)A value in class 16 to 20
C)Exactly 18
D)A value greater than 14
Unlock Deck
Unlock for access to all 42 flashcards in this deck.
Unlock Deck
k this deck
38
In a study of the function of pectoral fins in fish, a graduate student examined 7 fish with the following lengths (in centimeters, cm):
30 28 29 27 31 25 29
What is the mean length of these 7 fish?
A)28.4 cm
B)28.6 cm
C)29.0 cm
D)29.4 cm
30 28 29 27 31 25 29
What is the mean length of these 7 fish?
A)28.4 cm
B)28.6 cm
C)29.0 cm
D)29.4 cm
Unlock Deck
Unlock for access to all 42 flashcards in this deck.
Unlock Deck
k this deck
39
In a study of the function of pectoral fins in fish, a graduate student examined 7 fish with the following lengths (in centimeters, cm):
30 28 29 27 31 25 29
What is the variance of these 7 fish lengths?
A)1.41 cm
B)1.99 cm2
C)3.39 cm2
D)3.95 cm2
30 28 29 27 31 25 29
What is the variance of these 7 fish lengths?
A)1.41 cm
B)1.99 cm2
C)3.39 cm2
D)3.95 cm2
Unlock Deck
Unlock for access to all 42 flashcards in this deck.
Unlock Deck
k this deck
40
In a study of the function of pectoral fins in fish, a graduate student examined 7 fish with the following lengths (in centimeters, cm):
30 28 29 27 31 25 29
What is the first quartile for these data?
A)27 cm
B)27.5 cm
C)28 cm
D)28.5 cm
30 28 29 27 31 25 29
What is the first quartile for these data?
A)27 cm
B)27.5 cm
C)28 cm
D)28.5 cm
Unlock Deck
Unlock for access to all 42 flashcards in this deck.
Unlock Deck
k this deck
41
In a study of the function of pectoral fins in fish, a graduate student examined 7 fish with the following lengths (in centimeters, cm):
30 28 29 27 31 25 29
What is median fish length?
A)27 cm
B)28 cm
C)28.5 cm
D)29 cm
30 28 29 27 31 25 29
What is median fish length?
A)27 cm
B)28 cm
C)28.5 cm
D)29 cm
Unlock Deck
Unlock for access to all 42 flashcards in this deck.
Unlock Deck
k this deck
42
Which of the following numerical summaries is least affected by the addition of an extreme outlier?
A)Mean
B)Median
C)Standard deviation
D)Interquartile range
A)Mean
B)Median
C)Standard deviation
D)Interquartile range
Unlock Deck
Unlock for access to all 42 flashcards in this deck.
Unlock Deck
k this deck
Unlock Deck
Unlock for access to all 42 flashcards in this deck.


