Exam 2: Describing Quantitative Distributions With Numbers
Exam 1: Picturing Distributions With Graphs38 Questions
Exam 2: Describing Quantitative Distributions With Numbers42 Questions
Exam 3: Scatterplots and Correlation42 Questions
Exam 4: Regression41 Questions
Exam 5: Two-Way Tables35 Questions
Exam 6: Samples and Observational Studies34 Questions
Exam 7: Designing Experiments40 Questions
Exam 8: Essential Probability Rules58 Questions
Exam 9: Independence and Conditional Probabilities38 Questions
Exam 10: The Normal Distributions43 Questions
Exam 11: Discrete Probability Distributions43 Questions
Exam 12: Sampling Distributions48 Questions
Exam 13: Introduction to Inference48 Questions
Exam 14: Exercises44 Questions
Exam 15: Inference About a Population Mean44 Questions
Exam 16: Comparing Two Means40 Questions
Exam 17: Inference About a Population Proportion39 Questions
Exam 18: Comparing Two Proportions47 Questions
Exam 19: The Chi-Square Test for Goodness of Fit40 Questions
Exam 20: The Chi-Square Test for Two-Way Tables42 Questions
Exam 21: Inference for Regression45 Questions
Exam 22: One-Way Analysis of Variance: Comparing Several Means40 Questions
Exam 23: More About Analysis of Variance: Follow-Up Tests and Two-Way Anova39 Questions
Exam 24: Nonparametric Tests41 Questions
Exam 25: Multiple and Logistic Regression28 Questions
Select questions type
Which of the following statements correctly describes the five-number summary of a set of data?
Free
(Multiple Choice)
4.8/5  (34)
(34)
Correct Answer: Verified
C
In a study of the function of pectoral fins in fish, a graduate student examined 7 fish with the following lengths (in centimeters, cm):
30 28 29 27 31 25 29
What is the mean length of these 7 fish?
Free
(Multiple Choice)
4.9/5 (42)
Correct Answer:Verified
A
A sample of 20 endangered species was obtained and the length of time (in months) since being placed on the list was recorded for each species. The ordered data follow:
52, 54, 58, 59, 59, 60, 60, 63, 65, 66, 67, 68, 69, 73, 74, 77, 78, 79, 79, 98
What is the median length of time (in months) since being placed on the list for these 20 species?
Free
(Multiple Choice)
4.8/5 (34)
Correct Answer:Verified
B
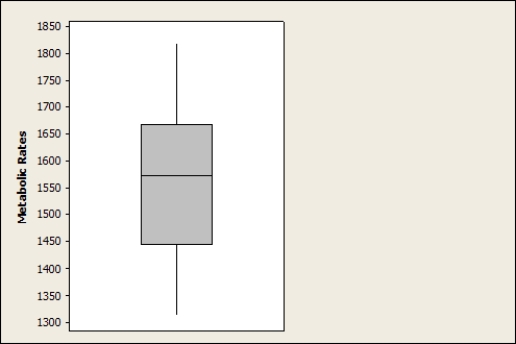
A sample was taken of the metabolic rates of men participating in a study regarding diets. The following boxplot depicts these rates (measured in kilocalories per 24 hours).
Which metabolic rate do approximately 75% of the men exceed?
(Multiple Choice)
4.8/5 (42)
By inspection, which of the following sets of numbers has the smallest standard deviation?
(Multiple Choice)
4.8/5 (30)
If the graph of a distribution of data is skewed, which measure of central tendency is most appropriate?
(Multiple Choice)
4.9/5 (30)
A sample of 20 endangered species was obtained and the length of time (in months) since being placed on the list was recorded for each species. The ordered data follow:
52, 54, 58, 59, 59, 60, 60, 63, 65, 66, 67, 68, 69, 73, 74, 77, 78, 79, 79, 98
What is the mean length of time (in months) since being placed on the list for these 20 species?
(Multiple Choice)
4.9/5 (28)
Geckos are lizards with specialized toe pads that enable them to easily climb all sorts of surfaces. A research team examined the adhesive properties of 7 Tokay geckos. Following are the toe-pad areas (in square centimeters, cm2) of this sample:
5.6 4.9 6.0 5.1 5.5 5.1 7.5
What is the first quartile for these data?
(Short Answer)
4.7/5 (32)
Stream ecologists are interested in the number of distinct organisms found in streams, and whether differences exist based on geography. Separate random samples are obtained from sites in northeastern and southeastern streams, and the number of distinct organisms is recorded for each site. The data are given as separate boxplots for northeastern and southeastern streams.
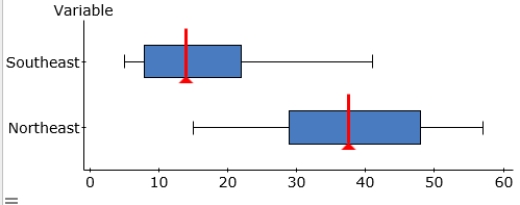 Which of the following statements about these data is correct?
(Multiple Choice)
4.7/5 (29)
The following histogram shows the yearly number of unprovoked attacks by alligators on people in Florida over a 33-year period.
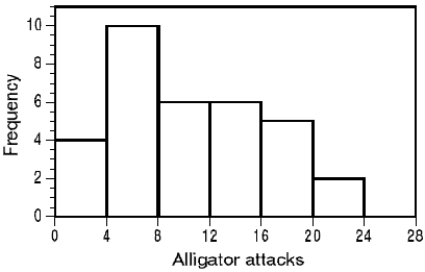 What must be the third quartile of yearly counts of alligator attacks?
(Multiple Choice)
4.9/5 (47)
Researchers measured the length of the central retrix (R1), a flight-involved tail feather, in 21 female long-tailed finches. A boxplot of the length, in millimeters (mm), is given here:
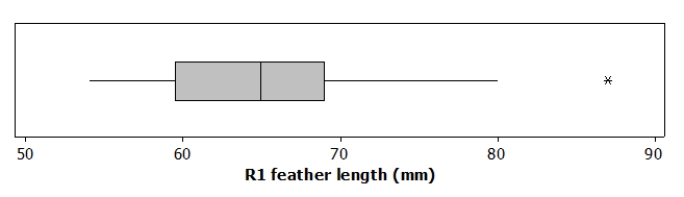 Based on this boxplot, which of the following statements is TRUE?
(Multiple Choice)
4.9/5 (38)
Stream ecologists are interested in the number of distinct organisms found in streams, and whether differences exist based on geography. Separate random samples are obtained from sites in northeastern and southeastern streams, and the number of distinct organisms is recorded for each site. The data are given as separate boxplots for northeastern and southeastern streams.
 What is the approximate value of the median number of distinct organisms found in the sample of northeastern stream?
(Multiple Choice)
4.9/5 (38)
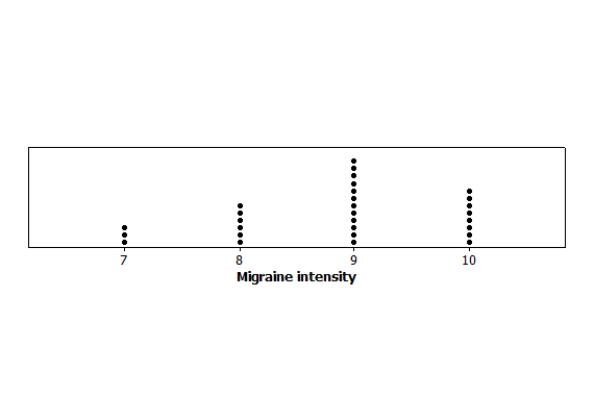
The following dotplot shows the migraine intensity (on a scale of 1 to 10) for 29 adults suffering from recurring migraines.
What is the first quartile for this data set?
(Multiple Choice)
4.9/5 (35)
Here is the ordered data of body temperatures (in degrees Fahrenheit) for 65 healthy adult women:
96.4, 96.7, 96.8, 97.2, 97.2, 97.4, 97.6, 97.7, 97.7, 97.8, 97.8, 97.8, 97.9, 97.9, 97.9,
98.0, 98.0, 98.0, 98.0, 98.0, 98.1, 98.2, 98.2, 98.2, 98.2, 98.2, 98.2, 98.3, 98.3, 98.3,
98.4, 98.4, 98.4, 98.4, 98.4, 98.5, 98.6, 98.6, 98.6, 98.6, 98.7, 98.7, 98.7, 98.7, 98.7,
98.7, 98.8, 98.8, 98.8, 98.8, 98.8, 98.8, 98.8, 98.9, 99.0, 99.0, 99.1, 99.1, 99.2, 99.2,
99.3, 99.4, 99.9, 100.0, 100.8
What is the median body temperature according to these data?
(Multiple Choice)
4.9/5 (38)
A sample was taken of the metabolic rates of men participating in a study regarding diets. The following boxplot depicts these rates (measured in kilocalories per 24 hours).
If 25 points were added to each rate, how would the standard deviation of the new distribution of rates change?

(Multiple Choice)
4.8/5 (30)
The following dotplot shows the migraine intensity (on a scale of 1 to 10) for 29 adults suffering from recurring migraines.
What is the third quartile for this data set?

(Multiple Choice)
4.8/5 (34)
A sample was taken of the metabolic rates of men participating in a study regarding diets. The following boxplot depicts these rates (measured in kilocalories per 24 hours).
Based on this boxplot, which of the following statements is TRUE?

(Multiple Choice)
4.8/5 (28)
Which of the following data are likely to have a mean that is smaller than the median?
(Multiple Choice)
4.8/5 (40)
Geckos are lizards with specialized toe pads that enable them to easily climb all sorts of surfaces. A research team examined the adhesive properties of 7 Tokay geckos. Following are the toe-pad areas (in square centimeters, cm2) for this sample:
5.6 4.9 6.0 5.1 5.5 5.1 7.5
Using the correct units, what is the value of the sample variance of toe-pad areas?
(Multiple Choice)
4.9/5 (39)
Stream ecologists are interested in the number of distinct organisms found in streams, and whether differences exist based on geography. Separate random samples are obtained from sites in northeastern and southeastern streams, and the number of distinct organisms is recorded for each site. The data are given as separate stemplots for northeastern and southeastern streams.
Northeastern Southeastern 005578 151123599 2039227 31478833 448841 5575 What is the mean number of distinct organisms recorded for northeastern streams?
(Multiple Choice)
4.8/5 (30)
Filters
- Essay(0)
- Multiple Choice(0)
- Short Answer(0)
- True False(0)
- Matching(0)