Deck 12: Sampling Distributions
Full screen (f)
Question
Question
Question
Question
Question
Question
Question
Question
Question
Question
Question
Question
Question
Question
Question
Question
Question
Question
Question
Question
Question
Question
Question
Question
Question
Question
Question
Question
Question
Question
Question
Question
Question
Question
Question
Question
Question
Question
Question
Question
Question
Question
Question
Question
Here is a histogram of T-cell velocities in vitro (in microns per minute):
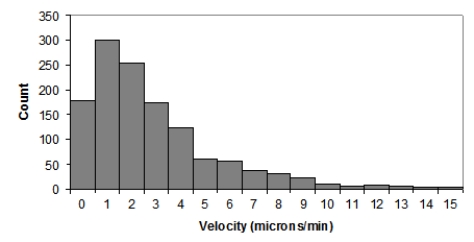
Which of the following statements is NOT true?
A)The population distribution of T-cell velocities is most likely skewed to the right.
B)The distribution of T-cell velocities would be more Normal if the researchers had collected more data.
C)When n is large, the sampling distribution of average T-cell velocities is approximately Normal.
D)The sampling distribution of average T-cell velocities for samples of size n = 10 is very likely right-skewed.
Question
Question
Question
Question

Unlock Deck
Sign up to unlock the cards in this deck!
Unlock Deck
Unlock Deck
1/48
Play
Full screen (f)
Deck 12: Sampling Distributions
1
The sale of eggs that are contaminated with Salmonella can cause food poisoning among consumers. A large egg producer takes an SRS of 200 eggs from all the eggs shipped in one day. The laboratory reports that 11 of these eggs had Salmonella contamination. Unbeknownst to the producer, 0.2% of all eggs shipped had Salmonella. What is the best description of the values, 11 and 0.2%, in this situation?
A)0.2% is a parameter and 11 is a statistic.
B)11 is a parameter and 0.2% is a statistic.
C)Both 0.2% and 11 are statistics.
D)Both 0.2% and 11 are parameters.
A)0.2% is a parameter and 11 is a statistic.
B)11 is a parameter and 0.2% is a statistic.
C)Both 0.2% and 11 are statistics.
D)Both 0.2% and 11 are parameters.
A
2
The World Health Organization recorded a total of 148 cases of parasitic Guinea worm infection worldwide in 2013, down from millions of cases just two decades ago. The sharp decline in infections is attributed primarily to water filtration using a simple cloth. A research paper found that, in 10 replications, a polyester cloth filtered 100% of the organisms carrying the Guinea worm larvae. Which of the following is correct about the numerical summaries 148 and 100%?
A)100% is a parameter and 148 is a statistic.
B)148 is a parameter and 100% is a statistic.
C)Both 148 and 100% are statistics.
D)Both 148 and 100% are parameters.
A)100% is a parameter and 148 is a statistic.
B)148 is a parameter and 100% is a statistic.
C)Both 148 and 100% are statistics.
D)Both 148 and 100% are parameters.
B
3
Here is a quote from an NPR news article: "On average, working-age adults were eating about 78 fewer calories per day in 2010, compared with five years earlier, according to a released report on Thursday." The new report is based on data from the National Health and Nutrition Examination Survey, which collects details on eating habits and other health-related information from a nationally representative sample of about 10,000 people in the U.S." Which of the following statements is TRUE about the numerical value, 78?
A)It is an anecdote.
B)It is a parameter.
C)It is a simulation.
D)It is a statistic.
A)It is an anecdote.
B)It is a parameter.
C)It is a simulation.
D)It is a statistic.
D
4
A national survey by Gallup interviewed 1014 adults and found that they had consumed, on average, 4.2 alcoholic beverages in the past seven days. If the survey had interviewed 5000 adults, which of the following statements would be TRUE?
A)By the law of large numbers, the average weekly number of drinks would again be 4.2.
B)By the law of large numbers, the average weekly number of drinks in the sample of 5000 adults would have to be closer to the true mean weekly number of drinks consumed by all American adults than the average found in this sample of 1014 adults.
C)The average weekly number of drinks computed from the sample of 5000 people would be less accurate because larger samples tend to be more variable than smaller samples.
D)None of the above
Unlock Deck
Unlock for access to all 48 flashcards in this deck.
Unlock Deck
k this deck
5
A national survey by Gallup interviewed 1014 adults and found that they had consumed, on average, 4.2 alcoholic beverages in the past seven days. Considering a sample of 1014 adults to be a large sample, which of the following statements is TRUE?
A)By the central limit theorem, the 1014 weekly number of drinks obtained in the sample is approximately Normally distributed.
B)By the central limit theorem, the average weekly number of drinks from repeated samples of size 1014 is approximately Normally distributed.
C)By the law of large numbers, the results of this study are 1014 times less variable than if only one U.S. adult had been asked.
D)By the law of large numbers, the average weekly number of drinks from repeated samples of size 1014 is approximately Normally distributed.
Unlock Deck
Unlock for access to all 48 flashcards in this deck.
Unlock Deck
k this deck
6
What does the law of large numbers state about the mean,x̄ , of observed values, when the number of observations drawn at random from a population-with finite mean μ and variance σ-increases?
A) The mean,x̄ , tends to get larger.
B. The mean,x̄ , tends to get smaller.
C. The mean, x̄, tends to get closer to the population mean, μ.
D)All of the above
A) The mean,x̄ , tends to get larger.
B. The mean,x̄ , tends to get smaller.
C. The mean, x̄, tends to get closer to the population mean, μ.
D)All of the above
Unlock Deck
Unlock for access to all 48 flashcards in this deck.
Unlock Deck
k this deck
7
Which characteristic describes the fact that the sample mean does not tend to over- or under-estimate the population mean?
A)The sample mean is consistent.
B)The sample mean is unbiased.
C)The sample mean is efficient.
D)The sample mean is a statistic.
A)The sample mean is consistent.
B)The sample mean is unbiased.
C)The sample mean is efficient.
D)The sample mean is a statistic.
Unlock Deck
Unlock for access to all 48 flashcards in this deck.
Unlock Deck
k this deck
8
The mean of the sampling distribution p̂ is p. What does this imply about p̂?
A)It is consistent.
B)It is unbiased.
C)It is efficient.
D)It is a statistic.
A)It is consistent.
B)It is unbiased.
C)It is efficient.
D)It is a statistic.
Unlock Deck
Unlock for access to all 48 flashcards in this deck.
Unlock Deck
k this deck
9
You plan to randomly select 10 students from your campus and ask them how many minutes they exercised in the past seven days. What is the distribution for all students of the times spent exercising in a week?
A)Sampling distribution of the average exercising times
B)Sampling distribution of the proportion of students who exercised last week
C)Normal distribution of exercising time
D)Population distribution of exercising times
A)Sampling distribution of the average exercising times
B)Sampling distribution of the proportion of students who exercised last week
C)Normal distribution of exercising time
D)Population distribution of exercising times
Unlock Deck
Unlock for access to all 48 flashcards in this deck.
Unlock Deck
k this deck
10
You plan to randomly select 10 students from your campus and ask them how many minutes they exercised in the past seven days. What is the distribution of values taken by the average exercising time in all possible samples of size 10?
A)Probability distribution of exercising times
B)Sampling distribution of average exercising times
C)Variance of the exercising time values
D)Population parameter
A)Probability distribution of exercising times
B)Sampling distribution of average exercising times
C)Variance of the exercising time values
D)Population parameter
Unlock Deck
Unlock for access to all 48 flashcards in this deck.
Unlock Deck
k this deck
11
What is the sampling distribution of a statistic?
A)The probability that we obtain the statistic in repeated random samples
B)The mechanism that determines whether randomization was effective
C)The distribution of values taken by a statistic in all possible samples of the same size from the same population
D)The extent to which the sample results differ systematically from the truth
Unlock Deck
Unlock for access to all 48 flashcards in this deck.
Unlock Deck
k this deck
12
Under which conditions is a statistic said to be unbiased?
A)The survey used to obtain the statistic had a low nonresponse rate.
B)The mean of its sampling distribution is equal to the true value of the parameter being estimated.
C)The study had a double-blind design.
D)The sample from which it is computed is a probability sample.
A)The survey used to obtain the statistic had a low nonresponse rate.
B)The mean of its sampling distribution is equal to the true value of the parameter being estimated.
C)The study had a double-blind design.
D)The sample from which it is computed is a probability sample.
Unlock Deck
Unlock for access to all 48 flashcards in this deck.
Unlock Deck
k this deck
13
Cats live for 14 years, on average, with a standard deviation of 2 years. A simple random sample of 78 recently deceased cats is selected, and the sample mean age at death x̄ of these cats is computed. We know the random variable x̄ has an approximately Normal distribution, but why?
A)The law of large numbers
B)The fact that probability is the long-run proportion of times an event occurs
C)The 68-95-99.7 rule
D)The central limit theorem
A)The law of large numbers
B)The fact that probability is the long-run proportion of times an event occurs
C)The 68-95-99.7 rule
D)The central limit theorem
Unlock Deck
Unlock for access to all 48 flashcards in this deck.
Unlock Deck
k this deck
14
What is the variability of a statistic described by?
A)The spread of its sampling distribution
B)The amount of bias present
C)The vagueness in the wording of the question used to collect the sample data
D)The stability of the population it describes
A)The spread of its sampling distribution
B)The amount of bias present
C)The vagueness in the wording of the question used to collect the sample data
D)The stability of the population it describes
Unlock Deck
Unlock for access to all 48 flashcards in this deck.
Unlock Deck
k this deck
15
The pH measurements of water specimens from various locations along a given river basin are Normally distributed, with mean 8 and standard deviation 0.3. You take water specimens from four randomly selected locations on this river basin. What is the probability that the mean pH measurement of these four specimens is greater than 8.2?
A)0.2516
B)0.1262
C)0.0918
D)0.0038
A)0.2516
B)0.1262
C)0.0918
D)0.0038
Unlock Deck
Unlock for access to all 48 flashcards in this deck.
Unlock Deck
k this deck
16
The pH measurements of water specimens from various locations along a given river basin are Normally distributed, with mean 8 and standard deviation 0.3. You take water specimens from four randomly selected locations on this river basin. Use the 68-95-99.7 rule to answer this question: What is the range of average pH measurements x̄ that make up roughly the middle 95% of the sampling distribution for random samples of four specimens?
A)7.4 to 8.6
B)7.7 to 8.3
C)7.85 to 8.15
D)7.925 to 8.075
A)7.4 to 8.6
B)7.7 to 8.3
C)7.85 to 8.15
D)7.925 to 8.075
Unlock Deck
Unlock for access to all 48 flashcards in this deck.
Unlock Deck
k this deck
17
The level of nitrogen oxides (NOx) in the exhaust of cars of a particular model varies Normally, with mean 0.25 gram per mile (g/mi) and standard deviation 0.05 g/mi. Government regulations call for NOx emissions no greater than 0.3 g/mi. What is the probability that the NOx emissions from a single car of this model fails to meet the NOx government regulations?
A)0.3173
B)0.2525
C)0.1587
D)0.0228
A)0.3173
B)0.2525
C)0.1587
D)0.0228
Unlock Deck
Unlock for access to all 48 flashcards in this deck.
Unlock Deck
k this deck
18
The level of nitrogen oxides (NOx) in the exhaust of cars of a particular model varies Normally, with mean 0.25 gram per mile (g/mi) and standard deviation 0.05 g/mi. Government regulations call for NOx emissions no higher than 0.3 g/mi. A company has four cars of this model in its fleet. What is the probability that the average NOx level of these cars is above the 0.3 g/mi limit?
A)0.2525
B)0.1586
C)0.0793
D)0.0228
A)0.2525
B)0.1586
C)0.0793
D)0.0228
Unlock Deck
Unlock for access to all 48 flashcards in this deck.
Unlock Deck
k this deck
19
The average age of trees in a large local park is 60 years, with a standard deviation of 2.2 years. A simple random sample of 400 trees is selected, and the sample mean age x̄ of these trees is computed. We know the random variable x̄ has an approximately Normal distribution, but why?
A)The law of large numbers
B)The central limit theorem
C)The 68-95-99.7 rule
D)The fact that probability is the long-run proportion of times an event occurs
A)The law of large numbers
B)The central limit theorem
C)The 68-95-99.7 rule
D)The fact that probability is the long-run proportion of times an event occurs
Unlock Deck
Unlock for access to all 48 flashcards in this deck.
Unlock Deck
k this deck
20
The average age of trees in a large local park is 60 years, with a standard deviation of 2.2 years. A simple random sample of 400 trees is selected, and the sample mean age x̄ of these trees is computed. What is the probability that the average age x̄ of the 400 trees is more than 60.1 years?
A)0.0001
B)0.1814
C)0.4801
D)0.8186
A)0.0001
B)0.1814
C)0.4801
D)0.8186
Unlock Deck
Unlock for access to all 48 flashcards in this deck.
Unlock Deck
k this deck
21
The average age of trees in a large local park is 60 years, with a standard deviation of 2.2 years. A simple random sample of 400 trees is selected, and the sample mean age x̄ of these trees is computed. Which of the following statements about this scenario is true?
A)The average age of 60 years is a parameter.
B)The standard deviation of 2.2 years is a parameter.
C)Neither the average age of 60 years nor the standard deviation of 2.2 years is a parameter.
D)Both the average age of 60 years and the standard deviation of 2.2 years are parameters.
A)The average age of 60 years is a parameter.
B)The standard deviation of 2.2 years is a parameter.
C)Neither the average age of 60 years nor the standard deviation of 2.2 years is a parameter.
D)Both the average age of 60 years and the standard deviation of 2.2 years are parameters.
Unlock Deck
Unlock for access to all 48 flashcards in this deck.
Unlock Deck
k this deck
22
The average age of trees in a large local park is 60 years, with a standard deviation of 2.2 years. A simple random sample of 400 trees is selected, and the sample mean age x̄ of these trees is computed. What is a statistic in this scenario?
A)The average age of 60 years
B)The standard deviation of 2.2 years
C. The mean x̄ calculated from the 400 trees
D)None of the above
A)The average age of 60 years
B)The standard deviation of 2.2 years
C. The mean x̄ calculated from the 400 trees
D)None of the above
Unlock Deck
Unlock for access to all 48 flashcards in this deck.
Unlock Deck
k this deck
23
Suppose a single random sample of size n is drawn from any population with mean μ and standard deviation σ. What does the central limit theorem say when n is sufficiently large?
A)The standard deviation of the sample mean is σ2 / n.
B)The distribution of the population is exactly Normal.
C)The distribution of the sample mean is approximately Normal.
D)The distribution of the sample mean is exactly Normal.
A)The standard deviation of the sample mean is σ2 / n.
B)The distribution of the population is exactly Normal.
C)The distribution of the sample mean is approximately Normal.
D)The distribution of the sample mean is exactly Normal.
Unlock Deck
Unlock for access to all 48 flashcards in this deck.
Unlock Deck
k this deck
24
Suppose a large population has mean μ and standard deviation σ, and a simple random sample of size n is taken. What are the mean and variance, respectively, of the sampling distribution of the sample mean x̄?
A) μ / n and σ2 / n
B)μ and σ / n
C)μ / n and σ2 / n2
D)μ and σ2 / n
A) μ / n and σ2 / n
B)μ and σ / n
C)μ / n and σ2 / n2
D)μ and σ2 / n
Unlock Deck
Unlock for access to all 48 flashcards in this deck.
Unlock Deck
k this deck
25
A large school district in southern California asked all of its eighth-graders to measure the length of their right foot at the beginning of the school year, as part of a science project. The data show that foot length is approximately Normally distributed, with a mean of 23.4 cm and a standard deviation of 1.7 cm. Suppose that 25 eighth-graders from this population are randomly selected. The distribution of the mean foot length in samples of 25 students is approximately Normal; what are the mean and standard deviation?
A)Mean = 23.4 cm and standard deviation = 1.7 cm
B)Mean = 23.4 cm and standard deviation = 0.34 cm
C)Mean = 23.4 cm and standard deviation = 0.068 cm
D)Mean and standard deviation are unknown.
A)Mean = 23.4 cm and standard deviation = 1.7 cm
B)Mean = 23.4 cm and standard deviation = 0.34 cm
C)Mean = 23.4 cm and standard deviation = 0.068 cm
D)Mean and standard deviation are unknown.
Unlock Deck
Unlock for access to all 48 flashcards in this deck.
Unlock Deck
k this deck
26
A large school district in southern California asked all of its eighth-graders to measure the length of their right foot at the beginning of the school year, as part of a science project. The data show that foot length is approximately Normally distributed, with a mean of 23.4 cm and a standard deviation of 1.7 cm. Suppose that 25 eighth-graders from this population are randomly selected. Approximately what is probability that the sample mean foot length is less than 23 cm?
A)0.593
B)0.407
C)0.120
D)0.000
A)0.593
B)0.407
C)0.120
D)0.000
Unlock Deck
Unlock for access to all 48 flashcards in this deck.
Unlock Deck
k this deck
27
Which of the following statements is NOT true?
A) The mean of the sampling distribution of p̂ is the true value of the population proportion p.
B)The standard deviation of p̂ gets larger as the sample size n gets larger.
C)As the sample size increases, the sampling distribution of p̂ becomes approximately Normal.
D)p̂ is an unbiased estimator of p.
Unlock Deck
Unlock for access to all 48 flashcards in this deck.
Unlock Deck
k this deck
28
The sample proportion p̂ is a common statistic used when dealing with categorical data.
Unlock Deck
Unlock for access to all 48 flashcards in this deck.
Unlock Deck
k this deck
29
You should not use the Normal approximation to the distribution of p̂ when the sample size N is small.
Unlock Deck
Unlock for access to all 48 flashcards in this deck.
Unlock Deck
k this deck
30
As many as 20% of all Americans contract influenza each year. A sample of 400 randomly selected Americans is chosen and the number with influenza is recorded. Let X represent the number with influenza in the sample. If X = 75 individuals are found to have influenza, what is the sample proportion?
A)0.0075
B)0.1875
C)0.2000
D)0.8125
A)0.0075
B)0.1875
C)0.2000
D)0.8125
Unlock Deck
Unlock for access to all 48 flashcards in this deck.
Unlock Deck
k this deck
31
As many as 20% of all Americans contract influenza each year. A sample of 400 randomly selected Americans is chosen and the number with influenza is recorded. Let X represent the number with influenza in the sample. If X = 75 individuals are found to have influenza, what is the standard deviation of the sampling distribution?
A)0.0045
B)0.0195
C)0.0200
D)0.8125
A)0.0045
B)0.0195
C)0.0200
D)0.8125
Unlock Deck
Unlock for access to all 48 flashcards in this deck.
Unlock Deck
k this deck
32
As many as 20% of all Americans contract influenza each year. A sample of 400 randomly selected Americans is chosen and the number with influenza is recorded. Let X represent the number with influenza in the sample. If X = 75 individuals are found to have influenza, then the sample proportion has approximately an
A)N(0.1875, 0.0195) distribution.
B)N(0.1875, 0.0200) distribution.
C)N(0.2000, 0.0195) distribution.
D)N(0.2000, 0.0200) distribution.
A)N(0.1875, 0.0195) distribution.
B)N(0.1875, 0.0200) distribution.
C)N(0.2000, 0.0195) distribution.
D)N(0.2000, 0.0200) distribution.
Unlock Deck
Unlock for access to all 48 flashcards in this deck.
Unlock Deck
k this deck
33
As many as 20% of all Americans contract influenza each year. A sample of 400 randomly selected Americans is chosen and the number with influenza is recorded. Let X represent the number with influenza in the sample. What is the probability that, at most, 25% of the sample is observed to have influenza?
A)0.0052
B)0.0062
C)0.9938
D)0.9948
A)0.0052
B)0.0062
C)0.9938
D)0.9948
Unlock Deck
Unlock for access to all 48 flashcards in this deck.
Unlock Deck
k this deck
34
As many as 20% of all Americans contract influenza each year. A sample of 400 randomly selected Americans is chosen and the number with influenza is recorded. Let X represent the number with influenza in the sample. What is the probability that at least 25% of the sample is observed to have influenza?
A)0.0052
B)0.0062
C)0.9938
D)0.9948
A)0.0052
B)0.0062
C)0.9938
D)0.9948
Unlock Deck
Unlock for access to all 48 flashcards in this deck.
Unlock Deck
k this deck
35
As many as 20% of all Americans contract influenza each year. A sample of 400 randomly selected Americans is chosen and the number with influenza is recorded. Let X represent the number with influenza in the sample. What is the probability that between 15% and 25% of the sample is observed to have influenza?
A)0.0052
B)0.0062
C)0.9876
D)0.9948
A)0.0052
B)0.0062
C)0.9876
D)0.9948
Unlock Deck
Unlock for access to all 48 flashcards in this deck.
Unlock Deck
k this deck
36
As the sample size increases, the distribution of the sample proportion becomes more Normal. This fact is due to
A)the central limit theorem.
B)the unbiasedness of the sample proportion.
C)the fact that n is in the denominator of the sample proportion.
D)the law of large numbers.
A)the central limit theorem.
B)the unbiasedness of the sample proportion.
C)the fact that n is in the denominator of the sample proportion.
D)the law of large numbers.
Unlock Deck
Unlock for access to all 48 flashcards in this deck.
Unlock Deck
k this deck
37
The distribution of total body protein in adult men with liver cirrhosis is approximately Normal, with mean 9.8 kg and standard deviation 0.1 kg. If you take a random sample of 16 adult men with liver cirrhosis, which of the following statements best describes the sampling distribution of the average total body protein?
A)It is approximately Normal, even though the population is skewed, because of the central limit theorem.
B)It is approximately Normal because the population distribution is approximately Normal.
C)It might not be Normal because the sample size is small.
D)It is definitely not Normal because the sample size is small.
Unlock Deck
Unlock for access to all 48 flashcards in this deck.
Unlock Deck
k this deck
38
The distribution of total body protein in adult men with liver cirrhosis is approximately Normal, with mean 9.8 kg and standard deviation 0.1 kg. If you take a random sample of 25 adult men with liver cirrhosis, what is the probability that their average total body protein is between 9.75 and 9.85 kg?
A)0.9876
B)0.3829
C)0.0796
D)0.0062
A)0.9876
B)0.3829
C)0.0796
D)0.0062
Unlock Deck
Unlock for access to all 48 flashcards in this deck.
Unlock Deck
k this deck
39
The distribution of total body protein in healthy adult men is approximately Normal, with mean 12.3 kg and standard deviation 0.1 kg. If you take a random sample of 25 healthy adult men, what is the probability that their average total body protein is between 12.25 and 12.35 kg?
A)0.9876
B)0.3829
C)0.0796
D)0.0062
A)0.9876
B)0.3829
C)0.0796
D)0.0062
Unlock Deck
Unlock for access to all 48 flashcards in this deck.
Unlock Deck
k this deck
40
The distribution of total body protein in healthy adult men is approximately Normal, with mean 12.3 kg and standard deviation 0.1 kg. If you take a random sample of 16 healthy adult men, what is the probability that their average total body protein is between 12.25 and 12.35 kg?
A)0.9876
B)0.9544
C)0.0455
D)0.0227
A)0.9876
B)0.9544
C)0.0455
D)0.0227
Unlock Deck
Unlock for access to all 48 flashcards in this deck.
Unlock Deck
k this deck
41
The distribution of vitamin C amount in the vitamin drops produced by a given factory is approximately Normal, with a mean of 60.0 mg and a standard deviation of 0.5 mg. What is, approximately, the probability of drawing at random a vitamin drop with vitamin content between 60.25 and 60.75 mg?
A)0.16
B)0.24
C)0.38
D)0.62
A)0.16
B)0.24
C)0.38
D)0.62
Unlock Deck
Unlock for access to all 48 flashcards in this deck.
Unlock Deck
k this deck
42
The distribution of vitamin C amount in the vitamin drops produced by a given factory is approximately Normal, with a mean of 60.0 mg and a standard deviation of 0.5 mg. If you take a random sample of 25 vitamin drops, what is, approximately, the probability that the average vitamin content x̄ is between 60.25 and 60.75 mg?
A)0.01
B)0.16
C)0.24
D)0.38
A)0.01
B)0.16
C)0.24
D)0.38
Unlock Deck
Unlock for access to all 48 flashcards in this deck.
Unlock Deck
k this deck
43
The distribution of vitamin C amount in the vitamin drops produced by a given factory is approximately Normal, with a mean of 60.0 mg and a standard deviation of 0.5 mg. If you take a random sample of 25 vitamin drops, what is, approximately, the probability that the average vitamin content x̄ is less than 59.9 mg?
A)0.16
B)0.32
C)0.42
D)0.68
A)0.16
B)0.32
C)0.42
D)0.68
Unlock Deck
Unlock for access to all 48 flashcards in this deck.
Unlock Deck
k this deck
44
Here is a histogram of T-cell velocities in vitro (in microns per minute):
Which of the following statements is NOT true?
A)The population distribution of T-cell velocities is most likely skewed to the right.
B)The distribution of T-cell velocities would be more Normal if the researchers had collected more data.
C)When n is large, the sampling distribution of average T-cell velocities is approximately Normal.
D)The sampling distribution of average T-cell velocities for samples of size n = 10 is very likely right-skewed.
Unlock Deck
Unlock for access to all 48 flashcards in this deck.
Unlock Deck
k this deck
45
The World Health Organization estimates that 5% of all adults in sub-Saharan Africa are living with HIV/AIDS. A survey takes a random sample of 1600 adults from all over sub-Saharan Africa and finds that 84 have HIV/AIDS. What is the approximate sampling distribution of the proportion who live with HIV/AIDS?
A)N(0.0500, 0.0054)
B)N(0.0500, 0.0056)
C)N(0.0525, 0.0056)
D)N(0.0525, 0.0054)
A)N(0.0500, 0.0054)
B)N(0.0500, 0.0056)
C)N(0.0525, 0.0056)
D)N(0.0525, 0.0054)
Unlock Deck
Unlock for access to all 48 flashcards in this deck.
Unlock Deck
k this deck
46
The World Health Organization estimates that 5% of all adults in sub-Saharan Africa are living with HIV/AIDS. A survey takes a random sample of 1600 adults from all over sub-Saharan Africa and finds that 84 have HIV/AIDS. What is the probability that a random sample of 1600 adults in sub-Saharan Africa would have less than 4.5% living with HIV/AIDS?
A)About 0
B)About 0.05
C)About 0.09
D)About 0.18
A)About 0
B)About 0.05
C)About 0.09
D)About 0.18
Unlock Deck
Unlock for access to all 48 flashcards in this deck.
Unlock Deck
k this deck
47
The state of California reported a total of 1904 cases of pertussis (whooping cough) for all of the year 2013, 12% of which involved infants younger than 6 months. Infants this young cannot be vaccinated yet and must rely on herd immunity for protection from the virus. What is the numerical value, 12%?
A)An anecdote
B)A parameter
C)A sample
D)A statistic
A)An anecdote
B)A parameter
C)A sample
D)A statistic
Unlock Deck
Unlock for access to all 48 flashcards in this deck.
Unlock Deck
k this deck
48
The state of California reported a total of 1904 cases of pertussis (whooping cough) for all of the year 2013, 12% of which involved infants younger than 6 months. Infants this young cannot be vaccinated yet and must rely on herd immunity for protection from the virus. If we took many random samples of 100 California residents diagnosed with pertussis in 2013 and computed the proportion in each sample who are infants, what would the distribution of these values be
A)the sampling distribution of the proportion who are infants.
B)the sampling distribution of infants diagnosed with pertussis.
C)a Normal distribution because of the law of large numbers.
D)the population distribution of infants diagnosed with pertussis.
A)the sampling distribution of the proportion who are infants.
B)the sampling distribution of infants diagnosed with pertussis.
C)a Normal distribution because of the law of large numbers.
D)the population distribution of infants diagnosed with pertussis.
Unlock Deck
Unlock for access to all 48 flashcards in this deck.
Unlock Deck
k this deck
Unlock Deck
Unlock for access to all 48 flashcards in this deck.


