Exam 12: Sampling Distributions
Exam 1: Picturing Distributions With Graphs38 Questions
Exam 2: Describing Quantitative Distributions With Numbers42 Questions
Exam 3: Scatterplots and Correlation42 Questions
Exam 4: Regression41 Questions
Exam 5: Two-Way Tables35 Questions
Exam 6: Samples and Observational Studies34 Questions
Exam 7: Designing Experiments40 Questions
Exam 8: Essential Probability Rules58 Questions
Exam 9: Independence and Conditional Probabilities38 Questions
Exam 10: The Normal Distributions43 Questions
Exam 11: Discrete Probability Distributions43 Questions
Exam 12: Sampling Distributions48 Questions
Exam 13: Introduction to Inference48 Questions
Exam 14: Exercises44 Questions
Exam 15: Inference About a Population Mean44 Questions
Exam 16: Comparing Two Means40 Questions
Exam 17: Inference About a Population Proportion39 Questions
Exam 18: Comparing Two Proportions47 Questions
Exam 19: The Chi-Square Test for Goodness of Fit40 Questions
Exam 20: The Chi-Square Test for Two-Way Tables42 Questions
Exam 21: Inference for Regression45 Questions
Exam 22: One-Way Analysis of Variance: Comparing Several Means40 Questions
Exam 23: More About Analysis of Variance: Follow-Up Tests and Two-Way Anova39 Questions
Exam 24: Nonparametric Tests41 Questions
Exam 25: Multiple and Logistic Regression28 Questions
Select questions type
As many as 20% of all Americans contract influenza each year. A sample of 400 randomly selected Americans is chosen and the number with influenza is recorded. Let X represent the number with influenza in the sample. What is the probability that at least 25% of the sample is observed to have influenza?
Free
(Multiple Choice)
4.7/5  (34)
(34)
Correct Answer: Verified
B
The distribution of vitamin C amount in the vitamin drops produced by a given factory is approximately Normal, with a mean of 60.0 mg and a standard deviation of 0.5 mg. What is, approximately, the probability of drawing at random a vitamin drop with vitamin content between 60.25 and 60.75 mg?
Free
(Multiple Choice)
4.9/5 (38)
Correct Answer:Verified
B
The average age of trees in a large local park is 60 years, with a standard deviation of 2.2 years. A simple random sample of 400 trees is selected, and the sample mean age x̄ of these trees is computed. We know the random variable x̄ has an approximately Normal distribution, but why?
Free
(Multiple Choice)
4.8/5 (27)
Correct Answer:Verified
B
Which characteristic describes the fact that the sample mean does not tend to over- or under-estimate the population mean?
(Multiple Choice)
4.8/5 (25)
A national survey by Gallup interviewed 1014 adults and found that they had consumed, on average, 4.2 alcoholic beverages in the past seven days. Considering a sample of 1014 adults to be a large sample, which of the following statements is TRUE?
(Multiple Choice)
4.9/5 (31)
Here is a quote from an NPR news article: "On average, working-age adults were eating about 78 fewer calories per day in 2010, compared with five years earlier, according to a released report on Thursday." The new report is based on data from the National Health and Nutrition Examination Survey, which collects details on eating habits and other health-related information from a nationally representative sample of about 10,000 people in the U.S." Which of the following statements is TRUE about the numerical value, 78?
(Multiple Choice)
4.8/5 (35)
The average age of trees in a large local park is 60 years, with a standard deviation of 2.2 years. A simple random sample of 400 trees is selected, and the sample mean age x̄ of these trees is computed. What is a statistic in this scenario?
(Multiple Choice)
4.7/5 (27)
The sale of eggs that are contaminated with Salmonella can cause food poisoning among consumers. A large egg producer takes an SRS of 200 eggs from all the eggs shipped in one day. The laboratory reports that 11 of these eggs had Salmonella contamination. Unbeknownst to the producer, 0.2% of all eggs shipped had Salmonella. What is the best description of the values, 11 and 0.2%, in this situation?
(Multiple Choice)
4.9/5 (26)
As the sample size increases, the distribution of the sample proportion becomes more Normal. This fact is due to
(Multiple Choice)
4.9/5 (29)
The level of nitrogen oxides (NOx) in the exhaust of cars of a particular model varies Normally, with mean 0.25 gram per mile (g/mi) and standard deviation 0.05 g/mi. Government regulations call for NOx emissions no greater than 0.3 g/mi. What is the probability that the NOx emissions from a single car of this model fails to meet the NOx government regulations?
(Multiple Choice)
4.8/5 (32)
A national survey by Gallup interviewed 1014 adults and found that they had consumed, on average, 4.2 alcoholic beverages in the past seven days. If the survey had interviewed 5000 adults, which of the following statements would be TRUE?
(Multiple Choice)
4.9/5 (39)
The mean of the sampling distribution p̂ is p. What does this imply about p̂?
(Multiple Choice)
4.8/5 (29)
The pH measurements of water specimens from various locations along a given river basin are Normally distributed, with mean 8 and standard deviation 0.3. You take water specimens from four randomly selected locations on this river basin. Use the 68-95-99.7 rule to answer this question: What is the range of average pH measurements x̄ that make up roughly the middle 95% of the sampling distribution for random samples of four specimens?
(Multiple Choice)
4.8/5 (33)
Suppose a large population has mean μ and standard deviation σ, and a simple random sample of size n is taken. What are the mean and variance, respectively, of the sampling distribution of the sample mean x̄?
(Multiple Choice)
4.8/5 (48)
Here is a histogram of T-cell velocities in vitro (in microns per minute):
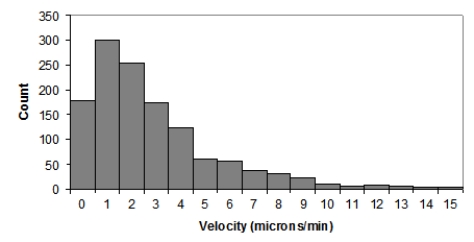
Which of the following statements is NOT true?
Which of the following statements is NOT true?
(Multiple Choice)
4.8/5 (42)
The average age of trees in a large local park is 60 years, with a standard deviation of 2.2 years. A simple random sample of 400 trees is selected, and the sample mean age x̄ of these trees is computed. Which of the following statements about this scenario is true?
(Multiple Choice)
4.8/5 (29)
The state of California reported a total of 1904 cases of pertussis (whooping cough) for all of the year 2013, 12% of which involved infants younger than 6 months. Infants this young cannot be vaccinated yet and must rely on herd immunity for protection from the virus. What is the numerical value, 12%?
(Multiple Choice)
4.9/5 (27)
Filters
- Essay(0)
- Multiple Choice(0)
- Short Answer(0)
- True False(0)
- Matching(0)