Deck 19: Creating Latent Variables
Full screen (f)
Question
Question
Question
Question
Question
Question
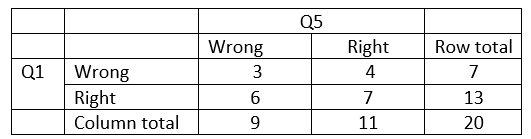
Calculate the log-odds ratio between Question 1 and Question 5 given the data below. Be sure to add a starting value of .50.
A) 0.50
B) 0.88
C) 0.11
D) 1.13
A) 0.50
B) 0.88
C) 0.11
D) 1.13
Question
Question
Question
Question
Question
Question
Question
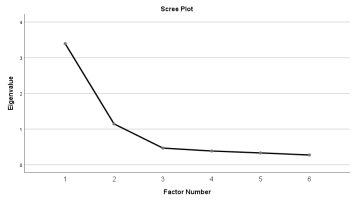
Based on Catell's scree method, how many factors should you retain in this unrotated EFA solution?
A) 4
B) 6
C) 2
D) 3
A) 4
B) 6
C) 2
D) 3
Question
Question
Question
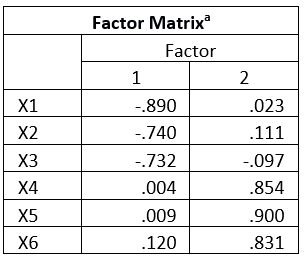
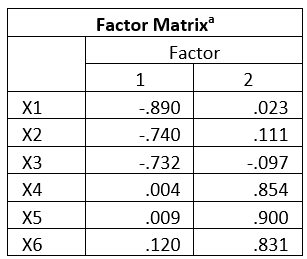
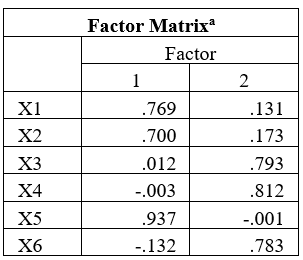
Researchers were interested in identifying the number of factors underlying a 6 item survey. The factor loadings are given below. How would you characterize the loadings on the first factor?
A) The first factor was characterized by near-zero loadings from items X1, X2, and X3 and weak positive loadings from items X4, X5, and X6.
B) The first factor was characterized by strong negative loadings from items X1, X2, and X3 and near-zero loadings from items X4, X5, and X6.
C) The first factor was characterized by near-zero loadings from items X1, X2, and X3 and strong positive loadings from items X4, X5, and X6.
D) The first factor was characterized by moderate positive loadings from X1, X2, and X3 and moderate negative loadings from items X4, X5, and X6.
Question
Researchers were interested in identifying the number of factors underlying a 6 item survey. The factor loadings are given below. How would you characterize the loadings on the second factor?
A) The second factor was characterized by near-zero loadings from items X1, X2, and X3 and weak positive loadings from items X4, X5, and X6.
B) The second factor was characterized by strong negative loadings from items X1, X2, and X3 and near-zero loadings from items X4, X5, and X6.
C) The second factor was characterized by near-zero loadings from items X1, X2, and X3 and strong positive loadings from items X4, X5, and X6.
D) The second factor was characterized by moderate positive loadings from X1, X2, and X3 and moderate negative loadings from items X4, X5, and X6.
Question
Based on the factor loadings given below, how many factors would you retain from this exploratory factor analysis?
A) 2
B) 0
C) 1
D) 4
A) 2
B) 0
C) 1
D) 4
Question
Given the results of the EFA and SPSS Output below, about what percent of the common variance is explained by Factor 2?
A) 67.5%
B) 31.4%
C) 36%
D) 9.43%
A) 67.5%
B) 31.4%
C) 36%
D) 9.43%
Question

Unlock Deck
Sign up to unlock the cards in this deck!
Unlock Deck
Unlock Deck
1/20
Play
Full screen (f)
Deck 19: Creating Latent Variables
1
A latent variable differs from a manifest variables in that:
A) they are not binary.
B) they are hidden and therefore don't exert an effect.
C) they are unobservable.
D) they are interval level variables.
A) they are not binary.
B) they are hidden and therefore don't exert an effect.
C) they are unobservable.
D) they are interval level variables.
C
2
In 1904, Charles Spearman published one of the most important papers in the history of psychology in which he described a latent variable. What was it?
A) General Intelligence.
B) The "Big Five".
C) Self-Esteem.
D) Depression
A) General Intelligence.
B) The "Big Five".
C) Self-Esteem.
D) Depression
A
3
When dealing with latent variable data, what is NOT something of concern when it comes to making inferences?
A) The complexity of the questions.
B) When the scores are high stakes.
C) Bad test questions.
D) All of these.
A) The complexity of the questions.
B) When the scores are high stakes.
C) Bad test questions.
D) All of these.
D
4
Marley got back her student's exams and found that 42% of the questions were not answered (i.e., left blank) by over half of the students. Which of the following should she investigate:
A) that some of these questions were poorly written.
B) that there was not enough time to complete the test.
C) the content was not covered in class appropriately.
D) All of these.
A) that some of these questions were poorly written.
B) that there was not enough time to complete the test.
C) the content was not covered in class appropriately.
D) All of these.
Unlock Deck
Unlock for access to all 20 flashcards in this deck.
Unlock Deck
k this deck
5
Why would you add a starting value to each cell of your data before calculating log-odds ratios?
A) It heightens the effects of any cells with low frequencies.
B) It lessens the effects of any cells with low frequencies.
C) It heightens the effects of cells with large numbers of missing data.
D) It lessens the effects of cells with large numbers of missing data.
A) It heightens the effects of any cells with low frequencies.
B) It lessens the effects of any cells with low frequencies.
C) It heightens the effects of cells with large numbers of missing data.
D) It lessens the effects of cells with large numbers of missing data.
Unlock Deck
Unlock for access to all 20 flashcards in this deck.
Unlock Deck
k this deck
6
Calculate the log-odds ratio between Question 1 and Question 5 given the data below. Be sure to add a starting value of .50.
A) 0.50
B) 0.88
C) 0.11
D) 1.13
A) 0.50
B) 0.88
C) 0.11
D) 1.13
Unlock Deck
Unlock for access to all 20 flashcards in this deck.
Unlock Deck
k this deck
7
Based on your solution in item 6. Give an appropriate statement for the relationship between question 1 and question 5.
A) If you got Question 1 right, you are more likely to get Question 5 right.
B) If you got Question 1 right, you are less likely to get Question 5 right.
C) If you got Question 5 right, you are less likely to get Question 1 wrong.
D) The questions are not appropriate for this age group.
A) If you got Question 1 right, you are more likely to get Question 5 right.
B) If you got Question 1 right, you are less likely to get Question 5 right.
C) If you got Question 5 right, you are less likely to get Question 1 wrong.
D) The questions are not appropriate for this age group.
Unlock Deck
Unlock for access to all 20 flashcards in this deck.
Unlock Deck
k this deck
8
Calculate the 95% confidence interval for lor calculated in Item 6. Remember to include a starting value of 0.5.
A) 1.86, 1.64
B) 2.88, 3.61
C) 3.00, 0.78
D) 1.96, 1.74
A) 1.86, 1.64
B) 2.88, 3.61
C) 3.00, 0.78
D) 1.96, 1.74
Unlock Deck
Unlock for access to all 20 flashcards in this deck.
Unlock Deck
k this deck
9
When looking at the associations between two variables, you might consider all of the following except:
A) Outliers
B) General trend
C) how large the means are
D) if one variable may cause the other
A) Outliers
B) General trend
C) how large the means are
D) if one variable may cause the other
Unlock Deck
Unlock for access to all 20 flashcards in this deck.
Unlock Deck
k this deck
10
Paul was interested in how associated a whole set of 7 quiz items was. He calculated the median lors for each of the quiz items with each question removed. The results are shown below:
On the basis of the results, which question (if any) may Janet wish to remove from her data?
A) Question 5
B) Question 7
C) Question 3
D) None
On the basis of the results, which question (if any) may Janet wish to remove from her data?
A) Question 5
B) Question 7
C) Question 3
D) None
Unlock Deck
Unlock for access to all 20 flashcards in this deck.
Unlock Deck
k this deck
11
When using the Fisher's r→z transformation to make confidence intervals, after you calculate the bounds for the z variables, you should remember to:
A) Transform these back into r values.
B) Multiply all values by the log of 1.
C) Divide by the square root of the sample size.
D) Multiply by the square root of the sample size.
A) Transform these back into r values.
B) Multiply all values by the log of 1.
C) Divide by the square root of the sample size.
D) Multiply by the square root of the sample size.
Unlock Deck
Unlock for access to all 20 flashcards in this deck.
Unlock Deck
k this deck
12
John administered a 3 item depression questionnaire to 50 students. He was interested in assessing the reliability of his instrument. He returned a Cronbach's α of .29. He was concerned that this was low. Which of these might account for the small α ?
A) The sample size used.
B) The number of items on the questionnaire.
C) The researcher's bias.
D) How missing values were imputed.
A) The sample size used.
B) The number of items on the questionnaire.
C) The researcher's bias.
D) How missing values were imputed.
Unlock Deck
Unlock for access to all 20 flashcards in this deck.
Unlock Deck
k this deck
13
Based on Catell's scree method, how many factors should you retain in this unrotated EFA solution?
A) 4
B) 6
C) 2
D) 3
A) 4
B) 6
C) 2
D) 3
Unlock Deck
Unlock for access to all 20 flashcards in this deck.
Unlock Deck
k this deck
14
Why might IRT produce a more meaningful analysis of a student's ability versus just the percentage correct?
A) Because it is much easier for the student to understand.
B) Because it does not use the scree plot.
C) Because the abilities are less affected by poor questions.
D) Because it will produce the same test score.
A) Because it is much easier for the student to understand.
B) Because it does not use the scree plot.
C) Because the abilities are less affected by poor questions.
D) Because it will produce the same test score.
Unlock Deck
Unlock for access to all 20 flashcards in this deck.
Unlock Deck
k this deck
15
When is IRT preferred over EFA?
A) When using binary latent variables.
B) When using binary manifest variables.
C) When using these are more than three latent variables.
D) When the latent variables are ordinal.
A) When using binary latent variables.
B) When using binary manifest variables.
C) When using these are more than three latent variables.
D) When the latent variables are ordinal.
Unlock Deck
Unlock for access to all 20 flashcards in this deck.
Unlock Deck
k this deck
16
Researchers were interested in identifying the number of factors underlying a 6 item survey. The factor loadings are given below. How would you characterize the loadings on the first factor?
A) The first factor was characterized by near-zero loadings from items X1, X2, and X3 and weak positive loadings from items X4, X5, and X6.
B) The first factor was characterized by strong negative loadings from items X1, X2, and X3 and near-zero loadings from items X4, X5, and X6.
C) The first factor was characterized by near-zero loadings from items X1, X2, and X3 and strong positive loadings from items X4, X5, and X6.
D) The first factor was characterized by moderate positive loadings from X1, X2, and X3 and moderate negative loadings from items X4, X5, and X6.
A) The first factor was characterized by near-zero loadings from items X1, X2, and X3 and weak positive loadings from items X4, X5, and X6.
B) The first factor was characterized by strong negative loadings from items X1, X2, and X3 and near-zero loadings from items X4, X5, and X6.
C) The first factor was characterized by near-zero loadings from items X1, X2, and X3 and strong positive loadings from items X4, X5, and X6.
D) The first factor was characterized by moderate positive loadings from X1, X2, and X3 and moderate negative loadings from items X4, X5, and X6.
Unlock Deck
Unlock for access to all 20 flashcards in this deck.
Unlock Deck
k this deck
17
Researchers were interested in identifying the number of factors underlying a 6 item survey. The factor loadings are given below. How would you characterize the loadings on the second factor?
A) The second factor was characterized by near-zero loadings from items X1, X2, and X3 and weak positive loadings from items X4, X5, and X6.
B) The second factor was characterized by strong negative loadings from items X1, X2, and X3 and near-zero loadings from items X4, X5, and X6.
C) The second factor was characterized by near-zero loadings from items X1, X2, and X3 and strong positive loadings from items X4, X5, and X6.
D) The second factor was characterized by moderate positive loadings from X1, X2, and X3 and moderate negative loadings from items X4, X5, and X6.
A) The second factor was characterized by near-zero loadings from items X1, X2, and X3 and weak positive loadings from items X4, X5, and X6.
B) The second factor was characterized by strong negative loadings from items X1, X2, and X3 and near-zero loadings from items X4, X5, and X6.
C) The second factor was characterized by near-zero loadings from items X1, X2, and X3 and strong positive loadings from items X4, X5, and X6.
D) The second factor was characterized by moderate positive loadings from X1, X2, and X3 and moderate negative loadings from items X4, X5, and X6.
Unlock Deck
Unlock for access to all 20 flashcards in this deck.
Unlock Deck
k this deck
18
Based on the factor loadings given below, how many factors would you retain from this exploratory factor analysis?
A) 2
B) 0
C) 1
D) 4
A) 2
B) 0
C) 1
D) 4
Unlock Deck
Unlock for access to all 20 flashcards in this deck.
Unlock Deck
k this deck
19
Given the results of the EFA and SPSS Output below, about what percent of the common variance is explained by Factor 2?
A) 67.5%
B) 31.4%
C) 36%
D) 9.43%
A) 67.5%
B) 31.4%
C) 36%
D) 9.43%
Unlock Deck
Unlock for access to all 20 flashcards in this deck.
Unlock Deck
k this deck
20
Barbara collected data from school leaders from all 300 schools in a large city. She collected data on 50 different average test scores and wanted to reduce the number of dimensions. What analysis method should she use?
A) Principal Principal Components Analysis
B) Item Response Theory
C) Correlation matrix
D) Fisher's transformation Analysis.
A) Principal Principal Components Analysis
B) Item Response Theory
C) Correlation matrix
D) Fisher's transformation Analysis.
Unlock Deck
Unlock for access to all 20 flashcards in this deck.
Unlock Deck
k this deck
Unlock Deck
Unlock for access to all 20 flashcards in this deck.


