Exam 19: Creating Latent Variables
Exam 1: Research Questions, Design, Strategy and Choice of Methods20 Questions
Exam 2: Ethics20 Questions
Exam 3: Big Questions and New Methods20 Questions
Exam 4: Capturing and Recording Information20 Questions
Exam 5: Telling Others About Your Research20 Questions
Exam 6: Psychology As a Science: What Is Science19 Questions
Exam 7: Accessing Difficult to Access Information20 Questions
Exam 8: Quasi-Experimental Designs Including Obervational Methods20 Questions
Exam 9: Experimental Design20 Questions
Exam 10: Interviewing and Focus Groups20 Questions
Exam 11: Descriptive Statistics: Graphical and Numerical Methods20 Questions
Exam 12: Content Analysis, Thematic Analysis and Discourse Analysis20 Questions
Exam 13: Self-Report Data20 Questions
Exam 14: Questionnaire Design20 Questions
Exam 15: Surveys and Sampling20 Questions
Exam 16: Inferential Statistics20 Questions
Exam 17: Factorial Anova20 Questions
Exam 18: Correlation and Regression20 Questions
Exam 19: Creating Latent Variables20 Questions
Select questions type
In 1904, Charles Spearman published one of the most important papers in the history of psychology in which he described a latent variable. What was it?
Free
(Multiple Choice)
4.8/5  (37)
(37)
Correct Answer: Verified
A
Researchers were interested in identifying the number of factors underlying a 6 item survey. The factor loadings are given below. How would you characterize the loadings on the second factor?
factor matrixa factor 1 2 X1 -.890 .023 X2 -.740 .111 X3 -.732 .097 X4 .004 .854 X5 .009 .900 X6 .120 .831
| factor matrixa | ||
| factor | ||
| 1 | 2 | |
| X1 | -.890 | .023 |
| X2 | -.740 | .111 |
| X3 | -.732 | .097 |
| X4 | .004 | .854 |
| X5 | .009 | .900 |
| X6 | .120 | .831 |
Free
(Multiple Choice)
4.7/5 (33)
Correct Answer:Verified
C
Paul was interested in how associated a whole set of 7 quiz items was. He calculated the median lors for each of the quiz items with each question removed. The results are shown below:
? w/o w/o w/o w/o w/o w/o 2 3 4 5 Q6 Q7 0.87 0.79 1.35 0.95 0.68 0.81 0.51 On the basis of the results, which question (if any) may Janet wish to remove from her data?
Free
(Multiple Choice)
4.9/5 (35)
Correct Answer:Verified
C
Calculate the 95% confidence interval for lor calculated in Item 6. Remember to include a starting value of 0.5.
(Multiple Choice)
4.9/5 (35)
Calculate the log-odds ratio between Question 1 and Question 5 given the data below. Be sure to add a starting value of .50.
Q5 WRONG RIGHT ROW TOTAL Q1 WRONG 3 4 7 RIGHT 6 7 13 Column total 9 11 20
| Q5 | ||||
| WRONG | RIGHT | ROW TOTAL | ||
| Q1 | WRONG | 3 | 4 | 7 |
| RIGHT | 6 | 7 | 13 | |
| Column total | 9 | 11 | 20 | |
(Multiple Choice)
4.7/5 (31)
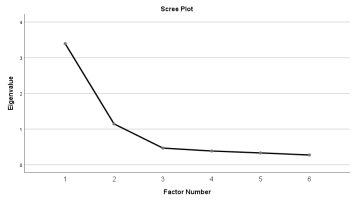
Based on Catell's scree method, how many factors should you retain in this unrotated EFA solution?
(Multiple Choice)
4.9/5 (36)
Based on the factor loadings given below, how many factors would you retain from this exploratory factor analysis?
factor matrixa factor 1 2 X1 .769 .131 X2 .700 .173 X3 .011 .793 X4 .003 .812 X5 .937 -.001 X6 .132 .783
| factor matrixa | ||
| factor | ||
| 1 | 2 | |
| X1 | .769 | .131 |
| X2 | .700 | .173 |
| X3 | .011 | .793 |
| X4 | .003 | .812 |
| X5 | .937 | -.001 |
| X6 | .132 | .783 |
(Multiple Choice)
4.7/5 (30)
John administered a 3 item depression questionnaire to 50 students. He was interested in assessing the reliability of his instrument. He returned a Cronbach's α of .29. He was concerned that this was low. Which of these might account for the small α ?
(Multiple Choice)
4.8/5 (32)
When dealing with latent variable data, what is NOT something of concern when it comes to making inferences?
(Multiple Choice)
4.9/5 (27)
When using the Fisher's r→z transformation to make confidence intervals, after you calculate the bounds for the z variables, you should remember to:
(Multiple Choice)
4.9/5 (27)
A latent variable differs from a manifest variables in that:
(Multiple Choice)
4.8/5 (35)
Why might IRT produce a more meaningful analysis of a student's ability versus just the percentage correct?
(Multiple Choice)
4.8/5 (43)
Marley got back her student's exams and found that 42% of the questions were not answered (i.e., left blank) by over half of the students. Which of the following should she investigate:
(Multiple Choice)
4.8/5 (38)
Barbara collected data from school leaders from all 300 schools in a large city. She collected data on 50 different average test scores and wanted to reduce the number of dimensions. What analysis method should she use?
(Multiple Choice)
4.9/5 (40)
When looking at the associations between two variables, you might consider all of the following except:
(Multiple Choice)
4.9/5 (28)
Based on your solution in item 6. Give an appropriate statement for the relationship between question 1 and question 5.
(Multiple Choice)
4.9/5 (31)
Researchers were interested in identifying the number of factors underlying a 6 item survey. The factor loadings are given below. How would you characterize the loadings on the first factor?
factor matrixa factor 1 2 X1 -.890 .023 X2 -.740 .111 X3 -.732 .097 X4 .004 .854 X5 .009 .900 X6 .120 .831
| factor matrixa | ||
| factor | ||
| 1 | 2 | |
| X1 | -.890 | .023 |
| X2 | -.740 | .111 |
| X3 | -.732 | .097 |
| X4 | .004 | .854 |
| X5 | .009 | .900 |
| X6 | .120 | .831 |
(Multiple Choice)
4.8/5 (24)
Given the results of the EFA and SPSS Output below, about what percent of the common variance is explained by Factor 2?
total variance explained factor initial eigenvalues extraction sums of square loadings total % of variance cumulative % total % of variance cumulative % 1 2.162 36.035 36.035 1.692 28.201 28.201 2 1.885 31.414 67.449 1.389 23.142 51.343 3 .566 9.425 76.875 4 .509 8.480 85.355 5 .471 7.842 93.197 6 .408 6.803 100.000
| total variance explained | ||||||
| factor | initial eigenvalues | extraction sums of square loadings | ||||
| total | % of variance | cumulative % | total | % of variance | cumulative % | |
| 1 | 2.162 | 36.035 | 36.035 | 1.692 | 28.201 | 28.201 |
| 2 | 1.885 | 31.414 | 67.449 | 1.389 | 23.142 | 51.343 |
| 3 | .566 | 9.425 | 76.875 | |||
| 4 | .509 | 8.480 | 85.355 | |||
| 5 | .471 | 7.842 | 93.197 | |||
| 6 | .408 | 6.803 | 100.000 | |||
(Multiple Choice)
5.0/5 (23)
Why would you add a starting value to each cell of your data before calculating log-odds ratios?
(Multiple Choice)
4.7/5 (35)
Filters
- Essay(0)
- Multiple Choice(0)
- Short Answer(0)
- True False(0)
- Matching(0)