Deck 30: Representing and Interpreting Data With One Variable
Full screen (f)
Question
Question
Question
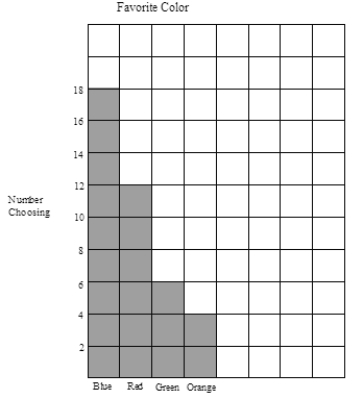
Make a bar graph for the following data about favorite color. Use as much of the grid as you need, but do not add any squares. Be sure to give all labels.
Blue: 18 students Red: 12 students Green: 6 students Orange: 4 students
Blue: 18 students Red: 12 students Green: 6 students Orange: 4 students
Question
Question
Question
Question
Question
Question
Question
Question
Question
Question
Question

From the box-and-whiskers plot above, give the following:
A) the 25th percentile
B) the range
C) two scores that have about 75% of the scores between them
D) two other scores that have about 75% of the scores between them
Question
Box plots of the heights (in inches) for a sample of college students are shown below. (Data file adapted from DataScope.)
A) What is the height of the shortest female student?
B) How many males are shorter than 68 inches tall?
C) Three-fourths of the females have heights less than _____ inches.
D) What is the upper quartile for heights for male?
E) Give two heights that have about 75% of the females between them.
F) Give two other heights that have about 75% of the females between them and _____.
G) The total graph for males is longer than the total graph for females. Is the reason because there are 48 males and only 32 females in the sample? Explain.
H) How short would a female be if her height were an outlier for the data above?
I) Give the five-number summary for the males.
J) If the data for the two groups were put together, at what percentile would 71 inches be?
Question
Box-and-whiskers plots for a sample of students and their number of hours of sleep per night during the week are given below. (Data adapted from DataScope.)
A) Why is the one dot for a male student separate from the rest of the graph?
B) How many female students sleep more than 11 hours?
C) How many male students sleep between 10 and 10.75 hours?
D) Do any females sleep longer than all the males? Explain.
E) Give the interquartile range for the males.
F) Give the five-number summary for the females.
G) If the female and male data were put together, what would be the median number of hours of sleep? Explain how you know or why you can't tell.
Question
Question
Question
Question
Question
Question
Question
Question
Question
Question
Question
Question
Question
Question
Question
Question

Unlock Deck
Sign up to unlock the cards in this deck!
Unlock Deck
Unlock Deck
1/32
Play
Full screen (f)
Deck 30: Representing and Interpreting Data With One Variable
1
A circle graph (pie chart) can be used with categorical data.
True
2
In preparing a circle graph (pie chart) for the following data on favorite color, how many degrees should be allotted to each?
Blue: 18 students Red: 12 students Green: 6 students Orange: 4 students
Blue: 18 students Red: 12 students Green: 6 students Orange: 4 students
Blue: = 162°; Red: 108°; Green: 54°; Orange: 36°
3
Make a bar graph for the following data about favorite color. Use as much of the grid as you need, but do not add any squares. Be sure to give all labels.
Blue: 18 students Red: 12 students Green: 6 students Orange: 4 students
Blue: 18 students Red: 12 students Green: 6 students Orange: 4 students
4
Which types of graphs (bar, box, histogram, pie, stem-and-leaf) could be used for these data sets? (Give all that could be used.)
A) Five hundred voters in an exit poll are asked, "Did you vote for Prop 47?"
B) The length of time (in minutes) you worked on math homework for each of the 23 classes we have had.
A) Five hundred voters in an exit poll are asked, "Did you vote for Prop 47?"
B) The length of time (in minutes) you worked on math homework for each of the 23 classes we have had.
Unlock Deck
Unlock for access to all 32 flashcards in this deck.
Unlock Deck
k this deck
5
Make a stem-and-leaf plot for the following heights (in centimeters) of children in one class.
120 116 98 114 118 122 95 107 114 103 128 106 111 112 116 102
120 116 98 114 118 122 95 107 114 103 128 106 111 112 116 102
Unlock Deck
Unlock for access to all 32 flashcards in this deck.
Unlock Deck
k this deck
6
Explain: With a histogram, you may lose some information.
Unlock Deck
Unlock for access to all 32 flashcards in this deck.
Unlock Deck
k this deck
7
Make a box-and-whiskers plot for these 24 scores, and give the five-number summary.
20, 19, 19, 18, 21, 20, 20, 17, 19, 21, 21, 19, 22, 18, 21, 19, 18, 22, 18, 19, 21, 21, 19, 20
Tell what each number in the five-number summary represents.
20, 19, 19, 18, 21, 20, 20, 17, 19, 21, 21, 19, 22, 18, 21, 19, 18, 22, 18, 19, 21, 21, 19, 20
Tell what each number in the five-number summary represents.
Unlock Deck
Unlock for access to all 32 flashcards in this deck.
Unlock Deck
k this deck
8
Make a box-and-whiskers plot for these 24 scores, and give the five-number summary.
19, 18, 18, 17, 20, 19, 19, 16, 18, 20, 20, 18, 21, 17, 20, 18, 17, 21, 17, 18, 20, 20, 18, 19
Tell what each number in the five-number summary represents.
19, 18, 18, 17, 20, 19, 19, 16, 18, 20, 20, 18, 21, 17, 20, 18, 17, 21, 17, 18, 20, 20, 18, 19
Tell what each number in the five-number summary represents.
Unlock Deck
Unlock for access to all 32 flashcards in this deck.
Unlock Deck
k this deck
9
Of the 1000 scores on a test, 250 scores will be in the second and third quartiles.
Unlock Deck
Unlock for access to all 32 flashcards in this deck.
Unlock Deck
k this deck
10
How many of the 800 scores on a district test will be in the interquartile range?
Unlock Deck
Unlock for access to all 32 flashcards in this deck.
Unlock Deck
k this deck
11
A) Make a box plot for the quiz scores below.
10, 11, 14, 9, 12, 11, 11, 9, 10, 12, 15, 11, 13, 9, 12, 10, 9, 13, 9, 10, 12, 12, 10, 11, 10, 9.
B) Give the five-number summary for those data.
C) What is the interquartile range?
D) Are there any outliers in the given data? If so, what low or high scores would be outliers?
10, 11, 14, 9, 12, 11, 11, 9, 10, 12, 15, 11, 13, 9, 12, 10, 9, 13, 9, 10, 12, 12, 10, 11, 10, 9.
B) Give the five-number summary for those data.
C) What is the interquartile range?
D) Are there any outliers in the given data? If so, what low or high scores would be outliers?
Unlock Deck
Unlock for access to all 32 flashcards in this deck.
Unlock Deck
k this deck
12
A) Make a box plot for the quiz scores below.
10, 11, 14, 9, 12, 11, 11, 9, 10, 12, 15, 11, 13, 9, 12, 10, 9, 13, 9, 10, 12, 12, 10, 11, 10, 9.
B) Give the five-number summary for those data.
C) What is the interquartile range?
D) Are there any outliers in the given data? If so, what low or high scores would be outliers?
10, 11, 14, 9, 12, 11, 11, 9, 10, 12, 15, 11, 13, 9, 12, 10, 9, 13, 9, 10, 12, 12, 10, 11, 10, 9.
B) Give the five-number summary for those data.
C) What is the interquartile range?
D) Are there any outliers in the given data? If so, what low or high scores would be outliers?
Unlock Deck
Unlock for access to all 32 flashcards in this deck.
Unlock Deck
k this deck
13
A) Make a box plot for the exam scores.
B) Give the five-number summary for the scores.
C) What is the 90th percentile for these scores?
D) Are there any outliers?
E) Make a stem-and-leaf plot for the test scores.
F) Make a histogram for the test scores.
Use a cell width of 5 points.
B) Give the five-number summary for the scores.
C) What is the 90th percentile for these scores?
D) Are there any outliers?
E) Make a stem-and-leaf plot for the test scores.
F) Make a histogram for the test scores.
Use a cell width of 5 points.
Unlock Deck
Unlock for access to all 32 flashcards in this deck.
Unlock Deck
k this deck
14
From the box-and-whiskers plot above, give the following:
A) the 25th percentile
B) the range
C) two scores that have about 75% of the scores between them
D) two other scores that have about 75% of the scores between them
Unlock Deck
Unlock for access to all 32 flashcards in this deck.
Unlock Deck
k this deck
15
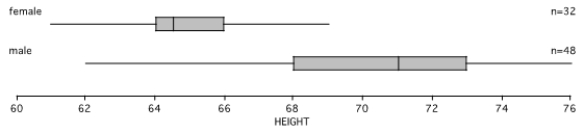
Box plots of the heights (in inches) for a sample of college students are shown below. (Data file adapted from DataScope.)
A) What is the height of the shortest female student?
B) How many males are shorter than 68 inches tall?
C) Three-fourths of the females have heights less than _____ inches.
D) What is the upper quartile for heights for male?
E) Give two heights that have about 75% of the females between them.
F) Give two other heights that have about 75% of the females between them and _____.
G) The total graph for males is longer than the total graph for females. Is the reason because there are 48 males and only 32 females in the sample? Explain.
H) How short would a female be if her height were an outlier for the data above?
I) Give the five-number summary for the males.
J) If the data for the two groups were put together, at what percentile would 71 inches be?
A) What is the height of the shortest female student?
B) How many males are shorter than 68 inches tall?
C) Three-fourths of the females have heights less than _____ inches.
D) What is the upper quartile for heights for male?
E) Give two heights that have about 75% of the females between them.
F) Give two other heights that have about 75% of the females between them and _____.
G) The total graph for males is longer than the total graph for females. Is the reason because there are 48 males and only 32 females in the sample? Explain.
H) How short would a female be if her height were an outlier for the data above?
I) Give the five-number summary for the males.
J) If the data for the two groups were put together, at what percentile would 71 inches be?
Unlock Deck
Unlock for access to all 32 flashcards in this deck.
Unlock Deck
k this deck
16
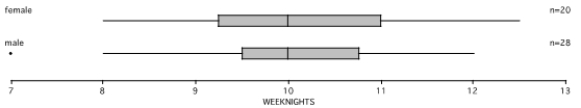
Box-and-whiskers plots for a sample of students and their number of hours of sleep per night during the week are given below. (Data adapted from DataScope.)
A) Why is the one dot for a male student separate from the rest of the graph?
B) How many female students sleep more than 11 hours?
C) How many male students sleep between 10 and 10.75 hours?
D) Do any females sleep longer than all the males? Explain.
E) Give the interquartile range for the males.
F) Give the five-number summary for the females.
G) If the female and male data were put together, what would be the median number of hours of sleep? Explain how you know or why you can't tell.
A) Why is the one dot for a male student separate from the rest of the graph?
B) How many female students sleep more than 11 hours?
C) How many male students sleep between 10 and 10.75 hours?
D) Do any females sleep longer than all the males? Explain.
E) Give the interquartile range for the males.
F) Give the five-number summary for the females.
G) If the female and male data were put together, what would be the median number of hours of sleep? Explain how you know or why you can't tell.
Unlock Deck
Unlock for access to all 32 flashcards in this deck.
Unlock Deck
k this deck
17
Here is a stem-and-leaf plot for some data.
A) What is the median for these data?
B) What is the mean for these data?
A) What is the median for these data?
B) What is the mean for these data?
Unlock Deck
Unlock for access to all 32 flashcards in this deck.
Unlock Deck
k this deck
18
A) Give five values that have mean 20 and median 16.
B) Find the standard deviation for your values in part A.
B) Find the standard deviation for your values in part A.
Unlock Deck
Unlock for access to all 32 flashcards in this deck.
Unlock Deck
k this deck
19
The mean is affected more by an extreme value than the median is.
Unlock Deck
Unlock for access to all 32 flashcards in this deck.
Unlock Deck
k this deck
20
A person who gets 40 out of 50 correct is at the 80th percentile.
Unlock Deck
Unlock for access to all 32 flashcards in this deck.
Unlock Deck
k this deck
21
The mode and the mean for the same set of data can be equal.
Unlock Deck
Unlock for access to all 32 flashcards in this deck.
Unlock Deck
k this deck
22
Suppose that the class mean on a test is 81.2%. What does the 81.2% mean (not how it was calculated)?
Unlock Deck
Unlock for access to all 32 flashcards in this deck.
Unlock Deck
k this deck
23
Calculate the standard deviation for these scores: 80, 72, 80, and 88. Show your work for credit.
Unlock Deck
Unlock for access to all 32 flashcards in this deck.
Unlock Deck
k this deck
24
The standard deviations for the test scores for two classes are quite different (on the same test). What does that tell you?
Unlock Deck
Unlock for access to all 32 flashcards in this deck.
Unlock Deck
k this deck
25
The mean scores for two classes are quite different. Does that imply that the standard deviation for the class with the larger mean will be greater than the standard deviation for the other class? Explain.
Unlock Deck
Unlock for access to all 32 flashcards in this deck.
Unlock Deck
k this deck
26
The median, rather than the mean or mode, is often given in reports about house prices. Why is that?
Unlock Deck
Unlock for access to all 32 flashcards in this deck.
Unlock Deck
k this deck
27
Sketch two distributions that would have the same median but different standard deviations.
Unlock Deck
Unlock for access to all 32 flashcards in this deck.
Unlock Deck
k this deck
28
A) For what kind of distribution does the 68-95-99.7 rule work?
B) What is the 68-95-99.7 rule or summary? If it helps your explanation, use a drawing.
C) One year, the SAT verbal test had scores with a mean of 500 and a standard deviation of 100. SAT scores are normally distributed. Approximately what percent of the people taking the SAT verbal test that year scored above 600? (Write or draw enough to make your reasoning clear.)
Unlock Deck
Unlock for access to all 32 flashcards in this deck.
Unlock Deck
k this deck
29
A particular medicine is not effective if there is less than 147 milligrams of Xylz in a dose, and the medicine is dangerous if there is more than 153 milligrams of Xylz in a dose. One manufacturer of the medicine uses a process that gives medicine with a normally distributed strength of Xylz, with mean 150 milligrams and standard deviation 1.5 milligrams of Xylz per dose. Approximately what percent of the manufacturer's total production will be thrown out and not used because of effectiveness or safety reasons?
Unlock Deck
Unlock for access to all 32 flashcards in this deck.
Unlock Deck
k this deck
30
Aña took both the SAT and the ACT before going to college. Her SAT verbal test had a mean of 500 and a standard deviation of 100. Aña's score was 620. Her ACT had a mean of 18 and a standard deviation of 6. Aña's score was 26. On which test did Aña do better compared with the others who took the tests?
Unlock Deck
Unlock for access to all 32 flashcards in this deck.
Unlock Deck
k this deck
31
A study at the public library in Highbrow City indicated that the number of visitors per week had a mean of 850 and a standard deviation of 70. A similar study at the public library in Podunk Township indicated that the number of visitors per week had a mean of 730 and a standard deviation of 50. In a contest during library week, the Highbrow City library attracted 990 people, while the library in Podunk Township attracted 840. Highbrow said they won because they not only had more people than Podunk, but they also had 140 extra people above the mean, while Podunk had only 110 extra people above their mean. How should Podunk respond?
Unlock Deck
Unlock for access to all 32 flashcards in this deck.
Unlock Deck
k this deck
32
In a normal distribution, at what percentile is each of these z-scores?
A)
B)
C)
A)
B)
C)
Unlock Deck
Unlock for access to all 32 flashcards in this deck.
Unlock Deck
k this deck
Unlock Deck
Unlock for access to all 32 flashcards in this deck.


