Exam 30: Representing and Interpreting Data With One Variable
Exam 1: Reasoning About Quantities34 Questions
Exam 2: Numeration Systems96 Questions
Exam 3: Understanding Whole Number Operations66 Questions
Exam 4: Some Conventional Ways of Computing17 Questions
Exam 5: Using Numbers in Sensible Ways38 Questions
Exam 6: Meanings for Fractions85 Questions
Exam 7: Computing With Fractions54 Questions
Exam 8: Multiplicative Comparisons and Multiplicative Reasoning19 Questions
Exam 9: Ratios, Rates, Proportions, and Percents33 Questions
Exam 10: Integers and Other Number Systems24 Questions
Exam 11: Number Theory57 Questions
Exam 12: What Is Algebra28 Questions
Exam 13: A Quantitative Approach to Algebra and Graphing18 Questions
Exam 14: Understanding Change: Relationships Among Time, Distance, and Rate10 Questions
Exam 15: Further Topics in Algebra and Change55 Questions
Exam 16: Polygons75 Questions
Exam 17: Polyhedra51 Questions
Exam 18: Symmetry17 Questions
Exam 19: Tessellations9 Questions
Exam 20: Similarity47 Questions
Exam 21: Curves, Constructions, and Curved Surfaces17 Questions
Exam 22: Transformation Geometry24 Questions
Exam 23: Measurement Basics21 Questions
Exam 24: Area, Surface Area, and Volume27 Questions
Exam 25: Counting Units Fast: Measurement Formulas31 Questions
Exam 26: Special Topics in Measurement21 Questions
Exam 27: Quantifying Uncertainty39 Questions
Exam 28: Determining More Complicated Probabilities37 Questions
Exam 29: Introduction to Statistics and Sampling7 Questions
Exam 30: Representing and Interpreting Data With One Variable32 Questions
Exam 31: Dealing With Multiple Data Sets or With Multiple Variables8 Questions
Exam 32: Variability in Samples21 Questions
Exam 33: Special Topics in Probability16 Questions
Select questions type
The mode and the mean for the same set of data can be equal.
Free
(True/False)
4.9/5  (36)
(36)
Correct Answer: Verified
True
Sketch two distributions that would have the same median but different standard deviations.
Free
(Essay)
4.9/5 (44)
Correct Answer:Verified
Check that the middles of the distributions are the same in the sketch (most easily done with symmetric distributions), but that one is more spread out.
A) Give five values that have mean 20 and median 16.
B) Find the standard deviation for your values in part A.
Free
(Essay)
4.8/5 (34)
Correct Answer:Verified
A-B) There are many possibilities. Check that the mean is 20 and the median 16, and that the standard deviation is calculated correctly. Having 16 and 20 as two of the values makes it easier: 14, 14, 16, 20, and 36.
Box plots of the heights (in inches) for a sample of college students are shown below. (Data file adapted from DataScope.)
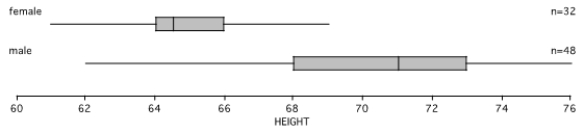 A) What is the height of the shortest female student?
B) How many males are shorter than 68 inches tall?
C) Three-fourths of the females have heights less than _____ inches.
D) What is the upper quartile for heights for male?
E) Give two heights that have about 75% of the females between them.
F) Give two other heights that have about 75% of the females between them and _____.
G) The total graph for males is longer than the total graph for females. Is the reason because there are 48 males and only 32 females in the sample? Explain.
H) How short would a female be if her height were an outlier for the data above?
I) Give the five-number summary for the males.
J) If the data for the two groups were put together, at what percentile would 71 inches be?
A) What is the height of the shortest female student?
B) How many males are shorter than 68 inches tall?
C) Three-fourths of the females have heights less than _____ inches.
D) What is the upper quartile for heights for male?
E) Give two heights that have about 75% of the females between them.
F) Give two other heights that have about 75% of the females between them and _____.
G) The total graph for males is longer than the total graph for females. Is the reason because there are 48 males and only 32 females in the sample? Explain.
H) How short would a female be if her height were an outlier for the data above?
I) Give the five-number summary for the males.
J) If the data for the two groups were put together, at what percentile would 71 inches be?
(Essay)
4.9/5 (35)
Which types of graphs (bar, box, histogram, pie, stem-and-leaf) could be used for these data sets? (Give all that could be used.)
A) Five hundred voters in an exit poll are asked, "Did you vote for Prop 47?"
B) The length of time (in minutes) you worked on math homework for each of the 23 classes we have had.
(Essay)
4.8/5 (39)
How many of the 800 scores on a district test will be in the interquartile range?
(Essay)
4.9/5 (30)
The mean scores for two classes are quite different. Does that imply that the standard deviation for the class with the larger mean will be greater than the standard deviation for the other class? Explain.
(Essay)
4.7/5 (31)
A study at the public library in Highbrow City indicated that the number of visitors per week had a mean of 850 and a standard deviation of 70. A similar study at the public library in Podunk Township indicated that the number of visitors per week had a mean of 730 and a standard deviation of 50. In a contest during library week, the Highbrow City library attracted 990 people, while the library in Podunk Township attracted 840. Highbrow said they won because they not only had more people than Podunk, but they also had 140 extra people above the mean, while Podunk had only 110 extra people above their mean. How should Podunk respond?
(Essay)
4.9/5 (36)
In a normal distribution, at what percentile is each of these z-scores?
A)
B)
C)
(Essay)
4.9/5 (40)
In preparing a circle graph (pie chart) for the following data on favorite color, how many degrees should be allotted to each?
Blue: 18 students Red: 12 students Green: 6 students Orange: 4 students
(Essay)
4.9/5 (36)
A person who gets 40 out of 50 correct is at the 80th percentile.
(True/False)
5.0/5 (34)
Aña took both the SAT and the ACT before going to college. Her SAT verbal test had a mean of 500 and a standard deviation of 100. Aña's score was 620. Her ACT had a mean of 18 and a standard deviation of 6. Aña's score was 26. On which test did Aña do better compared with the others who took the tests?
(Essay)
4.8/5 (35)
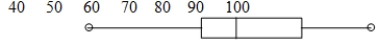 From the box-and-whiskers plot above, give the following:
A) the 25th percentile
B) the range
C) two scores that have about 75% of the scores between them
D) two other scores that have about 75% of the scores between them
From the box-and-whiskers plot above, give the following:
A) the 25th percentile
B) the range
C) two scores that have about 75% of the scores between them
D) two other scores that have about 75% of the scores between them
(Short Answer)
4.9/5 (29)
Make a stem-and-leaf plot for the following heights (in centimeters) of children in one class.
120 116 98 114 118 122 95 107 114 103 128 106 111 112 116 102
(Short Answer)
4.8/5 (31)
A) Make a box plot for the quiz scores below.
10, 11, 14, 9, 12, 11, 11, 9, 10, 12, 15, 11, 13, 9, 12, 10, 9, 13, 9, 10, 12, 12, 10, 11, 10, 9.
B) Give the five-number summary for those data.
C) What is the interquartile range?
D) Are there any outliers in the given data? If so, what low or high scores would be outliers?
(Essay)
4.9/5 (32)
A) Make a box plot for the quiz scores below.
10, 11, 14, 9, 12, 11, 11, 9, 10, 12, 15, 11, 13, 9, 12, 10, 9, 13, 9, 10, 12, 12, 10, 11, 10, 9.
B) Give the five-number summary for those data.
C) What is the interquartile range?
D) Are there any outliers in the given data? If so, what low or high scores would be outliers?
(Essay)
4.8/5 (30)
Make a box-and-whiskers plot for these 24 scores, and give the five-number summary.
19, 18, 18, 17, 20, 19, 19, 16, 18, 20, 20, 18, 21, 17, 20, 18, 17, 21, 17, 18, 20, 20, 18, 19
Tell what each number in the five-number summary represents.
(Essay)
4.9/5 (26)
Here is a stem-and-leaf plot for some data. 10 13447 11\mid 568 12 013
A) What is the median for these data?
B) What is the mean for these data?
(Short Answer)
4.7/5 (39)
A) For what kind of distribution does the 68-95-99.7 rule work?
B) What is the 68-95-99.7 rule or summary? If it helps your explanation, use a drawing.
C) One year, the SAT verbal test had scores with a mean of 500 and a standard deviation of 100. SAT scores are normally distributed. Approximately what percent of the people taking the SAT verbal test that year scored above 600? (Write or draw enough to make your reasoning clear.)
(Essay)
4.9/5 (37)
Filters
- Essay(0)
- Multiple Choice(0)
- Short Answer(0)
- True False(0)
- Matching(0)