Deck 20: Economic Inequality
Full screen (f)
Question
Question
Question
Question
Question
Question
Question
Question
Question
Question
Question
Question
Question
Question
Question
Question
Question
Question
Question
Question
Question
Question
Question
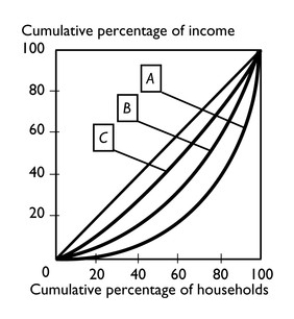
In the figure above,the nation with the most equal distribution of income is nation
A) A.
B) B.
C) C.
D) The distribution of income is the same in all three nations because their Lorenz curves can be plotted on the same diagram.
E) It is impossible to determine with the information given.
Question
Question
In the figure above,the nation with the highest average income is nation
A) A.
B) B.
C) C.
D) The average income is the same in all three nations because their Lorenz curves can be plotted on the same diagram.
E) It is impossible to determine with the information given.
Question
Question
Question
Question
Question
Question
Question
In the United States,it is the case that
A) both income and wealth are equally distributed.
B) wealth is equally distributed but income is distributed unequally.
C) income is equally distributed but wealth is distributed unequally.
D) both income and wealth are unequally distributed and wealth is distributed more unequally than is income.
E) both income and wealth are unequally distributed and income is distributed more unequally than is wealth.
Question
In the figure above,the nation with the least equal distribution of income is nation
A) A.
B) B.
C) C.
D) The distribution of income is the same in all three nations because their Lorenz curves can be plotted on the same diagram.
E) It is impossible to determine with the information given.
Question
Question
Question
Question
Question
Question
Question
Question
Question
Question
Question
Question
Question
Question
Question
Question
Question
Question
Question
Question
Question
Question
Question
Question
Question
Question
Question
Question
Question
Question
Question
Question
Question
Question
Question
Question
Question
Question
Question
Question
Question
Question
Question
Question
Question
Question
Question

Unlock Deck
Sign up to unlock the cards in this deck!
Unlock Deck
Unlock Deck
1/164
Play
Full screen (f)
Deck 20: Economic Inequality
1
In the United States,the poorest 20 percent of households receive about ________ percent of total money income while the richest 20 percent receive about ________ percent of total money income.
A) 3; 50
B) 8; 71
C) 12.; 32
D) 13; 68
E) 20; 20
A) 3; 50
B) 8; 71
C) 12.; 32
D) 13; 68
E) 20; 20
3; 50
2
The table gives the distribution of income in Mise
-What percent of income is earned by the richest 80 percent of the population?
A) 25 percent
B) 95 percent
C) 100 percent
D) 5 percent
E) More information is needed to answer the question.
95 percent
3
-The above table shows the distribution of income in two countries,Alpha and Beta.In Country Beta,the richest 40 percent of households receive ________ percent of total income.
A) 20
B) 40
C) 60
D) 80
E) 100
80
4
As a tool that is used to measure inequality in the distribution of income,the Lorenz curve graphs
A) the cumulative percentage of money income against the cumulative percentage of households.
B) the percentage of total money income received by each given percentage of households.
C) the mean income, median income, and mode income against the percentage of households.
D) the mean money income received by households over time.
E) the cumulative percentage of money income against the mean and median money income.
Unlock Deck
Unlock for access to all 164 flashcards in this deck.
Unlock Deck
k this deck
5
-The above table shows the distribution of income in two countries,Alpha and Beta.Based on these distributions of income,
A) Country Beta has more equal income distribution than does Country Alpha.
B) both countries have equal distributions because 100 percent of the incomes are accounted for.
C) the Lorenz Curve for country Beta is closer to the line of equality.
D) Country Alpha has a more equal distribution of income than does Country Beta.
E) It is impossible to answer the question without more information.
Unlock Deck
Unlock for access to all 164 flashcards in this deck.
Unlock Deck
k this deck
6
In 2004 the wealthiest 1 percent of all U.S.households owned what percentage of total wealth?
A) more than 30 percent
B) less than 10 percent
C) more than 40 percent
D) more than 50 percent
E) more than 45 percent
A) more than 30 percent
B) less than 10 percent
C) more than 40 percent
D) more than 50 percent
E) more than 45 percent
Unlock Deck
Unlock for access to all 164 flashcards in this deck.
Unlock Deck
k this deck
7
In the United States,the richest 20 percent of households receive approximately ________ percent of total money income.
A) 33
B) 12
C) 50
D) 75
E) 20
A) 33
B) 12
C) 50
D) 75
E) 20
Unlock Deck
Unlock for access to all 164 flashcards in this deck.
Unlock Deck
k this deck
8
In the United States,the poorest 20 percent of the household receive approximately ________ percent of total money income.
A) 3.3
B) 9.5
C) 11.8
D) 17.6
E) 20.0
A) 3.3
B) 9.5
C) 11.8
D) 17.6
E) 20.0
Unlock Deck
Unlock for access to all 164 flashcards in this deck.
Unlock Deck
k this deck
9
Lorenz curves are
A) horizontal.
B) vertical.
C) upward sloping.
D) downward sloping.
E) straight lines.
A) horizontal.
B) vertical.
C) upward sloping.
D) downward sloping.
E) straight lines.
Unlock Deck
Unlock for access to all 164 flashcards in this deck.
Unlock Deck
k this deck
10
If the Lorenz curve for income moves upward toward the 45° line,then the
A) distribution of income has become more unequal.
B) distribution of income has become more equal.
C) mean (average) household income increased.
D) total household income increased.
E) total household income decreased.
A) distribution of income has become more unequal.
B) distribution of income has become more equal.
C) mean (average) household income increased.
D) total household income increased.
E) total household income decreased.
Unlock Deck
Unlock for access to all 164 flashcards in this deck.
Unlock Deck
k this deck
11
If all households in a nation receive the same income,the nation's Lorenz curve
A) is horizontal.
B) is vertical.
C) is a 45° line.
D) runs along the horizontal axis until it reaches 50 percent of households and then runs vertically up to 100 percent of income.
E) runs along the horizontal axis until it reaches 100 percent of households and then runs vertically up to 100 percent of income.
Unlock Deck
Unlock for access to all 164 flashcards in this deck.
Unlock Deck
k this deck
12
A Lorenz curve for income shows the
A) demand for Lorenz cough drops.
B) average income graphed against the average number of people in the household.
C) cumulative percentage of income graphed against cumulative percentage of households.
D) relationship between income and wealth.
E) total amount of income graphed against the total number of households.
Unlock Deck
Unlock for access to all 164 flashcards in this deck.
Unlock Deck
k this deck
13
Which of the following statements is true regarding the distribution of income in the United States?
A) The Lorenz curve shows that incomes are distributed fairly.
B) The line of equality shows that incomes are distributed equally.
C) The inequality in the distribution of income can be seen because the Lorenz curve lies below the line of equality.
D) The inequality in the distribution of income can be seen because the Lorenz curve lies above the line of equality.
E) Both answers A and B are correct.
Unlock Deck
Unlock for access to all 164 flashcards in this deck.
Unlock Deck
k this deck
14
-The above table shows the distribution of income in two countries,Alpha and Beta.In Country Alpha,the poorest 20 percent receive ________ percent of total income.
A) 5
B) 9
C) 1
D) 19
E) 14
Unlock Deck
Unlock for access to all 164 flashcards in this deck.
Unlock Deck
k this deck
15
Country A has a more equal distribution of income than country B if
A) country A's Lorenz curve is closer to the line of equality than is country B's Lorenz curve.
B) country B's Lorenz curve is closer to the line of equality than is country A's Lorenz curve.
C) country A's Lorenz curve is just as close to the line of equality as is country B's Lorenz curve.
D) country A's Lorenz curve lies below country B's Lorenz curve at low levels of income and above it at high levels of income.
E) None of the above because it is impossible to compare income inequalities across countries.
Unlock Deck
Unlock for access to all 164 flashcards in this deck.
Unlock Deck
k this deck
16
The table gives the distribution of income in Mise
-What percent of income is earned by the richest 60 percent of the population?
A) 25 percent
B) 30 percent
C) 55 percent
D) 85 percent
E) More information is needed to answer the question.
Unlock Deck
Unlock for access to all 164 flashcards in this deck.
Unlock Deck
k this deck
17
The table gives the distribution of income in Mise
-What percent of income is earned by the richest forty percent?
A) 5 percent
B) 20 percent
C) 70 percent
D) 55 percent
E) More information is needed to answer the question.
Unlock Deck
Unlock for access to all 164 flashcards in this deck.
Unlock Deck
k this deck
18
The table gives the distribution of income in Mise
-What percent of income is earned by the poorest 60 percent of the population?
A) 25 percent
B) 30 percent
C) 55 percent
D) 15 percent
E) More information is needed to answer the question.
Unlock Deck
Unlock for access to all 164 flashcards in this deck.
Unlock Deck
k this deck
19
A Lorenz curve
A) is identical to the straight line sloping up at a 45° angle.
B) lies above the straight line sloping up at a 45° angle.
C) lies below the straight line sloping up at a 45° angle.
D) starts below the straight line sloping up at a 45° angle and then ends above this line.
E) starts above the straight line sloping up at a 45° angle and then ends below this line.
Unlock Deck
Unlock for access to all 164 flashcards in this deck.
Unlock Deck
k this deck
20
Looking at the Lorenz curves for income distribution in all the world's nations,we would find that
A) some nations have Lorenz curves that lie above the 45° line, other nations have Lorenz curves that lie below the 45° line, but no nation has a Lorenz curve that lie on the 45° line.
B) all nations have Lorenz curves that lie above the 45° line.
C) all nations have Lorenz curves that lie below the 45° line.
D) some nations have Lorenz curves that lie above the 45° line, other nations have Lorenz curves that lie below the 45° line, and still other nations have a Lorenz curve that lies on the 45° line.
E) None of the above answers is correct.
Unlock Deck
Unlock for access to all 164 flashcards in this deck.
Unlock Deck
k this deck
21
Measured annual income inequality overstates actual lifetime inequality because
A) poverty levels vary across states.
B) homeless people are not always counted.
C) different households are in different stages in the life cycle.
D) people tend to overstate their incomes.
E) people differ in the amount of education they have attained.
A) poverty levels vary across states.
B) homeless people are not always counted.
C) different households are in different stages in the life cycle.
D) people tend to overstate their incomes.
E) people differ in the amount of education they have attained.
Unlock Deck
Unlock for access to all 164 flashcards in this deck.
Unlock Deck
k this deck
22
In the United States in 2010,the Census Bureau determined that approximately ________ million Americans lived in households that had incomes below the poverty line.
A) 46
B) 22
C) 84
D) 11
E) 112
A) 46
B) 22
C) 84
D) 11
E) 112
Unlock Deck
Unlock for access to all 164 flashcards in this deck.
Unlock Deck
k this deck
23
In the figure above,the nation with the most equal distribution of income is nation
A) A.
B) B.
C) C.
D) The distribution of income is the same in all three nations because their Lorenz curves can be plotted on the same diagram.
E) It is impossible to determine with the information given.
Unlock Deck
Unlock for access to all 164 flashcards in this deck.
Unlock Deck
k this deck
24
In the United States,the
A) distribution of income has become more equal since 1970.
B) Lorenz curve for income and the Lorenz curve for wealth are equally close to the line of equality.
C) Lorenz curve for income is closer to the line of equality than is the Lorenz curve for wealth.
D) Lorenz curve for wealth is closer to the line of equality than is the Lorenz curve for income.
E) None of the above answers is correct.
Unlock Deck
Unlock for access to all 164 flashcards in this deck.
Unlock Deck
k this deck
25
In the figure above,the nation with the highest average income is nation
A) A.
B) B.
C) C.
D) The average income is the same in all three nations because their Lorenz curves can be plotted on the same diagram.
E) It is impossible to determine with the information given.
Unlock Deck
Unlock for access to all 164 flashcards in this deck.
Unlock Deck
k this deck
26
________ is the single biggest factor affecting income distribution in the United States.
A) Location of household
B) Type of household
C) Education
D) Age of household
E) Gender
A) Location of household
B) Type of household
C) Education
D) Age of household
E) Gender
Unlock Deck
Unlock for access to all 164 flashcards in this deck.
Unlock Deck
k this deck
27
The highest-income household in the United States today is likely to be a college-educated
A) married white couple.
B) single white female.
C) married Asian couple.
D) single black male.
E) single black female.
A) married white couple.
B) single white female.
C) married Asian couple.
D) single black male.
E) single black female.
Unlock Deck
Unlock for access to all 164 flashcards in this deck.
Unlock Deck
k this deck
28
In the United States in 2010,a family of four was considered to be living below the poverty line only if its household income was less than approximately
A) $400 per year.
B) $4,000 per year.
C) $11,900 per year.
D) $22,800 per year.
E) $35,800 per year.
A) $400 per year.
B) $4,000 per year.
C) $11,900 per year.
D) $22,800 per year.
E) $35,800 per year.
Unlock Deck
Unlock for access to all 164 flashcards in this deck.
Unlock Deck
k this deck
29
The factor that leads to the largest difference in households' incomes is
A) race.
B) education.
C) gender.
D) size of household.
E) location of household.
A) race.
B) education.
C) gender.
D) size of household.
E) location of household.
Unlock Deck
Unlock for access to all 164 flashcards in this deck.
Unlock Deck
k this deck
30
Of the following major characteristics that lead to income disparity,the factor with the smallest impact is
A) sex.
B) race.
C) region of the country.
D) education.
E) number of people in the household.
A) sex.
B) race.
C) region of the country.
D) education.
E) number of people in the household.
Unlock Deck
Unlock for access to all 164 flashcards in this deck.
Unlock Deck
k this deck
31
Comparing the wealth and income distribution in the United States,we see that
A) wealth is distributed less equally than income.
B) because wealth and income are different terms for the same thing, the distributions are the same.
C) income is distributed less equally than wealth.
D) we cannot compare the distribution of wealth and income.
E) None of the above answers is correct.
Unlock Deck
Unlock for access to all 164 flashcards in this deck.
Unlock Deck
k this deck
32
In the United States,it is the case that
A) both income and wealth are equally distributed.
B) wealth is equally distributed but income is distributed unequally.
C) income is equally distributed but wealth is distributed unequally.
D) both income and wealth are unequally distributed and wealth is distributed more unequally than is income.
E) both income and wealth are unequally distributed and income is distributed more unequally than is wealth.
Unlock Deck
Unlock for access to all 164 flashcards in this deck.
Unlock Deck
k this deck
33
In the figure above,the nation with the least equal distribution of income is nation
A) A.
B) B.
C) C.
D) The distribution of income is the same in all three nations because their Lorenz curves can be plotted on the same diagram.
E) It is impossible to determine with the information given.
Unlock Deck
Unlock for access to all 164 flashcards in this deck.
Unlock Deck
k this deck
34
Looking at the income distribution in the United States since 1970,we see that
A) only the lowest 20 percent and highest 20 percent increased their shares of income.
B) the lower 50 percent increased its share of income and the upper 50 percent stayed the same.
C) the highest 20 percent increased its share of income.
D) all the 20 percent groups increased their shares of income.
E) the lower 50 percent increased its share of income and the upper 50 percent decreased its share of income.
Unlock Deck
Unlock for access to all 164 flashcards in this deck.
Unlock Deck
k this deck
35
Since 1970 in the United States,the distribution of income has changed and the group that benefited the most has been the
A) better educated.
B) less educated.
C) low-skilled workers.
D) middle class, that is the group in the middle 20 percent of the income distribution.
E) None of the above answers is correct because all groups benefited equally.
A) better educated.
B) less educated.
C) low-skilled workers.
D) middle class, that is the group in the middle 20 percent of the income distribution.
E) None of the above answers is correct because all groups benefited equally.
Unlock Deck
Unlock for access to all 164 flashcards in this deck.
Unlock Deck
k this deck
36
Poverty for a household is defined as the state of
A) having a total income that is below the median total income.
B) having an income that can be spent on food, shelter, and clothing that is below the median for food, shelter, and clothing.
C) income below what is thought fair.
D) income below what is thought necessary for food, shelter, and clothing.
E) having an income that is below average.
Unlock Deck
Unlock for access to all 164 flashcards in this deck.
Unlock Deck
k this deck
37
In the United States since 1970 income has become ________ equally distributed and since the 1970s economic mobility among income groups has ________.
A) more; increased
B) more; decreased
C) less; increased
D) less; decreased
E) None of the above answers is correct because economic mobility among income groups cannot be measured.
A) more; increased
B) more; decreased
C) less; increased
D) less; decreased
E) None of the above answers is correct because economic mobility among income groups cannot be measured.
Unlock Deck
Unlock for access to all 164 flashcards in this deck.
Unlock Deck
k this deck
38
In the United States,since 1970 the share of income received by the richest 20 percent of households has ________ and the share received by the other 80 percent of households has ________.
A) increased; increased
B) increased; decreased
C) decreased; increased
D) not changed; not changed
E) increased; not changed
A) increased; increased
B) increased; decreased
C) decreased; increased
D) not changed; not changed
E) increased; not changed
Unlock Deck
Unlock for access to all 164 flashcards in this deck.
Unlock Deck
k this deck
39
Which of the following statements is correct?
A) Wealth inequality in the United States is greater than income inequality.
B) Income inequality in the United States is greater than wealth inequality.
C) Income includes all the things owned by a household at a certain point in time.
D) The top fifth of households have a greater share of the nation's income than the nation's wealth.
E) The fraction of wealth owned by the bottom 20 percent of households is larger than the fraction income earned by the bottom 20 percent of households.
Unlock Deck
Unlock for access to all 164 flashcards in this deck.
Unlock Deck
k this deck
40
The measured inequality of annual income ________ the actual inequality of lifetime income because ________.
A) overstates; different households are at different stages in the life cycle
B) overstates; the Lorenz curves differ for income and wealth
C) understates; people live in different geographic areas
D) understates; people have different levels of education
E) overstates; different households have different amounts of wealth
Unlock Deck
Unlock for access to all 164 flashcards in this deck.
Unlock Deck
k this deck
41
Looking at the U.S.poverty rate by race,we see that
A) the poverty rates by race are now equal.
B) whites have a higher poverty rate than do blacks.
C) Hispanics and blacks have a higher poverty rate than whites.
D) whites have a nearly zero poverty rate while Hispanics and blacks are near 20 percent.
E) whites and blacks have higher poverty rates than do Hispanics.
Unlock Deck
Unlock for access to all 164 flashcards in this deck.
Unlock Deck
k this deck
42
Which of the following statements about poverty is (are)correct?
i.Blacks and Hispanics have higher poverty rates than whites.
ii.Over the last 40 years,poverty rates for all groups have generally increased.
iii.Most household spells of poverty last well beyond 9 months.
A) i only
B) ii only
C) iii only
D) ii and iii
E) i, ii, and iii
i.Blacks and Hispanics have higher poverty rates than whites.
ii.Over the last 40 years,poverty rates for all groups have generally increased.
iii.Most household spells of poverty last well beyond 9 months.
A) i only
B) ii only
C) iii only
D) ii and iii
E) i, ii, and iii
Unlock Deck
Unlock for access to all 164 flashcards in this deck.
Unlock Deck
k this deck
43
The demand for labor
i.depends on the availability of labor.
ii.decreases when the supply of labor increases.
iii.depends on the value of marginal product of labor.
A) i only
B) i and ii
C) iii only
D) i and iii
E) i, ii, and iii
i.depends on the availability of labor.
ii.decreases when the supply of labor increases.
iii.depends on the value of marginal product of labor.
A) i only
B) i and ii
C) iii only
D) i and iii
E) i, ii, and iii
Unlock Deck
Unlock for access to all 164 flashcards in this deck.
Unlock Deck
k this deck
44
Which type of household has the lowest poverty rate?
A) black
B) Hispanic
C) white
D) White and Hispanic are almost tied.
E) White and black are almost tied.
A) black
B) Hispanic
C) white
D) White and Hispanic are almost tied.
E) White and black are almost tied.
Unlock Deck
Unlock for access to all 164 flashcards in this deck.
Unlock Deck
k this deck
45
Workers who have invested in education and training
A) are more likely to find jobs that are not rewarding.
B) have a higher value of marginal product.
C) have a more difficult time finding a job because their wage rate is higher.
D) have identical supply curves to otherwise similar workers who have not invested in education and training.
E) None of the above answers is correct.
Unlock Deck
Unlock for access to all 164 flashcards in this deck.
Unlock Deck
k this deck
46
In the United States in 2004,the wealthiest 1 percent of households held approximately ________ percent of all wealth.
A) 1
B) 13
C) 27
D) 34
E) 88
A) 1
B) 13
C) 27
D) 34
E) 88
Unlock Deck
Unlock for access to all 164 flashcards in this deck.
Unlock Deck
k this deck
47
Which of the following is correct about the United States?
A) Income is equally distributed.
B) Wealth is equally distributed.
C) Income is equally distributed but wealth is unequally distributed because of inheritances.
D) Both wealth and income are unequally distributed.
E) Both wealth and income are equally distributed.
A) Income is equally distributed.
B) Wealth is equally distributed.
C) Income is equally distributed but wealth is unequally distributed because of inheritances.
D) Both wealth and income are unequally distributed.
E) Both wealth and income are equally distributed.
Unlock Deck
Unlock for access to all 164 flashcards in this deck.
Unlock Deck
k this deck
48
In the United States since 1970,the share of money income received by the richest 20 percent of households has ________ and the share of income received by the lowest 20 percent of households has ________.
A) increased; not changed
B) not changed; increased
C) not changed; decreased
D) decreased; increased
E) increased; decreased
A) increased; not changed
B) not changed; increased
C) not changed; decreased
D) decreased; increased
E) increased; decreased
Unlock Deck
Unlock for access to all 164 flashcards in this deck.
Unlock Deck
k this deck
49
The gap between the salary of Tom Cruise and an unknown actor is over $15 million per movie.This difference means that Mr.Cruise's value of marginal product is
A) over $15 million greater than the value of the marginal product of the unknown actor.
B) less than $15 greater than value of the marginal product of the unknown actor.
C) $15 million greater than the value of the marginal product of the unknown actor.
D) equal to the value of the marginal product of the unknown actor.
E) More information is need to make the comparison.
Unlock Deck
Unlock for access to all 164 flashcards in this deck.
Unlock Deck
k this deck
50
Which of the following is (are)a difference between high-skilled workers and low-skilled workers?
i.High-skilled workers have a higher value of marginal product.
ii.High-skilled workers have incurred lower opportunity costs to acquire their skills.
iii.The demand for high-skilled workers exceeds that for low-skilled workers.
A) i only
B) ii and iii
C) i and ii
D) i and iii
E) i, ii, and iii
i.High-skilled workers have a higher value of marginal product.
ii.High-skilled workers have incurred lower opportunity costs to acquire their skills.
iii.The demand for high-skilled workers exceeds that for low-skilled workers.
A) i only
B) ii and iii
C) i and ii
D) i and iii
E) i, ii, and iii
Unlock Deck
Unlock for access to all 164 flashcards in this deck.
Unlock Deck
k this deck
51
Of all the characteristics that lead to income inequality,the factor with the largest impact is
A) race.
B) sex.
C) age.
D) education.
E) location.
A) race.
B) sex.
C) age.
D) education.
E) location.
Unlock Deck
Unlock for access to all 164 flashcards in this deck.
Unlock Deck
k this deck
52
Which of the following is true? At a given quantity of employment,if the
i.value of marginal product of a high-skill worker is $35 and the value of marginal product of a low-skill worker is $10,the value of marginal product of the skill is $25.
ii.value of marginal product of a high-skill worker is $35 and the value of marginal product of a low-skill worker is $10,the cost of acquiring the skill is $25.
iii.value of marginal product of a skill is $25,then the wage rate must be $25.
A) i only
B) ii only
C) iii only
D) i and iii
E) ii and iii
Unlock Deck
Unlock for access to all 164 flashcards in this deck.
Unlock Deck
k this deck
53
The inequality of annual income
A) overstates the amount of lifetime inequality.
B) understates the amount of lifetime inequality.
C) cannot change from one year to the next.
D) is about the same as the amount of lifetime inequality.
E) cannot be compared to the amount of lifetime inequality.
A) overstates the amount of lifetime inequality.
B) understates the amount of lifetime inequality.
C) cannot change from one year to the next.
D) is about the same as the amount of lifetime inequality.
E) cannot be compared to the amount of lifetime inequality.
Unlock Deck
Unlock for access to all 164 flashcards in this deck.
Unlock Deck
k this deck
54
Skills are costly to acquire.What forms do these costs take?
i.out-of-pocket expenditures to pay for more education
ii.a higher value of marginal product
iii.forgone earnings while attending higher education
A) i only
B) ii only
C) iii only
D) i and iii
E) i, ii, and iii
i.out-of-pocket expenditures to pay for more education
ii.a higher value of marginal product
iii.forgone earnings while attending higher education
A) i only
B) ii only
C) iii only
D) i and iii
E) i, ii, and iii
Unlock Deck
Unlock for access to all 164 flashcards in this deck.
Unlock Deck
k this deck
55
The demand curve for high-skilled workers
A) lies to the right of the demand curve for low-skilled workers.
B) lies to the left of the demand curve for low-skilled workers.
C) is vertical.
D) is horizontal.
E) lies to the right of the demand curve for low-skilled workers at high wages and to the left of the demand curve for low-skilled workers at low wages.
Unlock Deck
Unlock for access to all 164 flashcards in this deck.
Unlock Deck
k this deck
56
One reason why economists earn more than Taco Bell workers is because economists have a ________ value of marginal product of labor than Taco Bell workers.
A) lower
B) higher
C) similar
D) more convex
E) more concave
A) lower
B) higher
C) similar
D) more convex
E) more concave
Unlock Deck
Unlock for access to all 164 flashcards in this deck.
Unlock Deck
k this deck
57
If a firm is willing to pay a high-skilled worker $25 per hour and a low-skilled worker $10 per hour then the value of marginal product of skill is
A) $15.
B) $40.
C) $10.
D) $25
E) There is not enough information to answer this question.
A) $15.
B) $40.
C) $10.
D) $25
E) There is not enough information to answer this question.
Unlock Deck
Unlock for access to all 164 flashcards in this deck.
Unlock Deck
k this deck
58
If the income distribution is more unequal than the wealth distribution,then the
A) Lorenz curve for income will be farther away from the line of equality than the Lorenz curve for wealth.
B) government has imposed a higher tax rate on income.
C) Lorenz curve for wealth will be farther away from the line of equality than the Lorenz curve for income.
D) Lorenz curve for wealth will lie above the Lorenz curve for income.
E) It is not possible to draw the Lorenz curve for wealth on the same figure with the Lorenz curve for income.
Unlock Deck
Unlock for access to all 164 flashcards in this deck.
Unlock Deck
k this deck
59
Suppose a supply curve for high-skilled labor is drawn in the same graph as a supply curve for low-skilled labor.The vertical distance between these two curves represents the
A) wage rate paid to a high-skilled worker.
B) wage rate paid to a low-skilled worker.
C) compensation the high-skilled worker requires for the cost of acquiring the skill.
D) number of high-skill workers that will be hired.
E) difference in the value of marginal product between the high-skilled workers and the low-skilled workers.
Unlock Deck
Unlock for access to all 164 flashcards in this deck.
Unlock Deck
k this deck
60
In 2010,the poverty rate in the United States level was approximately ________ percent.
A) 3
B) 15
C) 32
D) 20
E) 26
A) 3
B) 15
C) 32
D) 20
E) 26
Unlock Deck
Unlock for access to all 164 flashcards in this deck.
Unlock Deck
k this deck
61
The more costly it is to acquire a skill,the
A) more people will go to school to learn the skill.
B) less employers are willing to pay for the skill.
C) greater the wage differential between high-skilled and low-skilled workers.
D) smaller the wage differential between high-skilled and low-skilled workers.
E) more the demand for workers with that skill exceeds the demand for workers without that skill.
Unlock Deck
Unlock for access to all 164 flashcards in this deck.
Unlock Deck
k this deck
62
Discrimination by customers creates a wage differential between two groups by creating a difference in the two groups'
A) supply of labor.
B) value of marginal product.
C) marginal cost of labor.
D) minimum wage.
E) opportunity cost of acquiring skills.
A) supply of labor.
B) value of marginal product.
C) marginal cost of labor.
D) minimum wage.
E) opportunity cost of acquiring skills.
Unlock Deck
Unlock for access to all 164 flashcards in this deck.
Unlock Deck
k this deck
63
What economic effect works to eliminate sex and race discrimination?
A) Firms hire only the preferred races and sex.
B) Lower paid races and sexes give up working and drop out of the labor supply.
C) Customers who discriminate pay higher prices to buy from preferred races and sex.
D) The value of marginal product of the less preferred races and sexes eventually increases.
E) Lower paid races and sexes decrease their demand for goods and services.
Unlock Deck
Unlock for access to all 164 flashcards in this deck.
Unlock Deck
k this deck
64
Increased discrimination results in ________ of the workers discriminated against being hired and being paid ________ wage rates.
A) more; higher
B) more; lower
C) fewer; higher
D) fewer; lower
E) the same number; lower
A) more; higher
B) more; lower
C) fewer; higher
D) fewer; lower
E) the same number; lower
Unlock Deck
Unlock for access to all 164 flashcards in this deck.
Unlock Deck
k this deck
65
The ________ distance between the supply curve of low-skilled labor and the supply curve of high-skilled labor is the ________.
A) horizontal; value of marginal product of skill
B) horizontal; compensation for cost of acquiring skill
C) vertical; value of marginal product of skill
D) vertical; compensation for cost of acquiring skill
E) vertical; difference in the price of the product produced b y high-skilled labor minus the price of the product produced by low-skilled labor
Unlock Deck
Unlock for access to all 164 flashcards in this deck.
Unlock Deck
k this deck
66
Looking at wage differentials between white women and white men in the United States since 2000,we see that the amount of the difference
A) has not changed.
B) has increased.
C) has decreased.
D) at first increased but in the last decade it decreased.
E) at first decreased but in the last decade it increased.
A) has not changed.
B) has increased.
C) has decreased.
D) at first increased but in the last decade it decreased.
E) at first decreased but in the last decade it increased.
Unlock Deck
Unlock for access to all 164 flashcards in this deck.
Unlock Deck
k this deck
67
What determines the position of the supply curve of high-skilled workers relative to that of low-skilled workers?
A) the cost of acquiring the skill
B) the difference in the demand curves for the two groups
C) Bureau of Labor Standard guidelines
D) the difference in the value of the marginal products
E) None of the above answers is correct.
A) the cost of acquiring the skill
B) the difference in the demand curves for the two groups
C) Bureau of Labor Standard guidelines
D) the difference in the value of the marginal products
E) None of the above answers is correct.
Unlock Deck
Unlock for access to all 164 flashcards in this deck.
Unlock Deck
k this deck
68
High-skilled workers earn more relative to low-skilled workers because the demand for high-skilled workers is ________ that for low-skilled workers and the supply is ________ that for low-skilled workers.
A) greater than; greater than
B) greater than; lower than
C) lower than; greater than
D) lower than; lower than
E) greater than; the same as
A) greater than; greater than
B) greater than; lower than
C) lower than; greater than
D) lower than; lower than
E) greater than; the same as
Unlock Deck
Unlock for access to all 164 flashcards in this deck.
Unlock Deck
k this deck
69
How does the supply curve of high-skilled workers compare to the supply curve of low-skilled workers?
A) Because skills are costly to acquire, at a given wage rate the quantity supplied of high-skilled workers is greater than that of low-skilled workers.
B) Because skills are costly to acquire, at any given wage rate the quantity supplied of high-skilled workers is less than that of low-skilled workers.
C) Because skills are inexpensive to acquire, at any given wage rate the quantity supplied of high-skilled workers is less than that of low-skilled workers.
D) Because skills are inexpensive to acquire, at any given wage rate the quantity supplied of high-skilled workers is greater than that of low-skilled workers.
E) None of the above answers is correct.
Unlock Deck
Unlock for access to all 164 flashcards in this deck.
Unlock Deck
k this deck
70
The higher the cost of acquiring skills,the ________ are the high-skilled and low-skilled labor ________ curves.
A) closer together; demand
B) farther apart; demand
C) closer together; supply
D) farther apart; supply
A) closer together; demand
B) farther apart; demand
C) closer together; supply
D) farther apart; supply
Unlock Deck
Unlock for access to all 164 flashcards in this deck.
Unlock Deck
k this deck
71
The rates of return on high school and college educations have
A) not been estimated, but are assumed to be high.
B) been estimated as negative, but these are still good options for most.
C) been estimated at 50 percent per year.
D) been estimated at between 5 to 10 percent per year.
E) been estimated to be essentially zero.
A) not been estimated, but are assumed to be high.
B) been estimated as negative, but these are still good options for most.
C) been estimated at 50 percent per year.
D) been estimated at between 5 to 10 percent per year.
E) been estimated to be essentially zero.
Unlock Deck
Unlock for access to all 164 flashcards in this deck.
Unlock Deck
k this deck
72
If buyers discriminate against women and minorities,
i.the value of marginal product of women and minorities is less than otherwise.
ii.the wage rate paid to women and minorities is less than otherwise.
iii.more women and minorities are hired than otherwise.
A) i only
B) ii only
C) ii and iii
D) i and ii
E) i, ii, and iii
i.the value of marginal product of women and minorities is less than otherwise.
ii.the wage rate paid to women and minorities is less than otherwise.
iii.more women and minorities are hired than otherwise.
A) i only
B) ii only
C) ii and iii
D) i and ii
E) i, ii, and iii
Unlock Deck
Unlock for access to all 164 flashcards in this deck.
Unlock Deck
k this deck
73
The ________ the value of marginal product of skill,the ________.
A) smaller; larger is the wage differential between low-skilled workers and high-skilled workers
B) larger; more elastic the supply curve of labor
C) larger; larger is the wage differential between low-skilled workers and high-skilled workers
D) smaller; less elastic the supply curve of labor
E) smaller; larger is the cost of acquiring the skill
Unlock Deck
Unlock for access to all 164 flashcards in this deck.
Unlock Deck
k this deck
74
Which of the following is correct? On the average,
i.the wage differential between white males and white females has narrowed since 2000.
ii.black females are paid more than black males.
iii.Hispanic males are paid more than black males.
A) i only
B) ii only
C) ii and iii
D) i and iii
E) i, ii, and iii
i.the wage differential between white males and white females has narrowed since 2000.
ii.black females are paid more than black males.
iii.Hispanic males are paid more than black males.
A) i only
B) ii only
C) ii and iii
D) i and iii
E) i, ii, and iii
Unlock Deck
Unlock for access to all 164 flashcards in this deck.
Unlock Deck
k this deck
75
High-skilled workers earn more than low-skilled workers in part because the high-skilled workers have
A) a higher value of marginal product.
B) a lower value of marginal product.
C) better health.
D) fewer deductions.
E) a greater supply than do low-skilled workers.
A) a higher value of marginal product.
B) a lower value of marginal product.
C) better health.
D) fewer deductions.
E) a greater supply than do low-skilled workers.
Unlock Deck
Unlock for access to all 164 flashcards in this deck.
Unlock Deck
k this deck
76
The larger the value of marginal product of a skill,the
A) larger the vertical difference between the demand curves for high- and low-skilled labor.
B) smaller the vertical difference between the demand curves for high- and low-skilled labor.
C) larger the vertical distance between the supply curves for high- and low-skilled labor.
D) smaller the vertical distance between the supply curves for high- and low-skilled labor.
E) higher is the wage rate at which the demand curve for high-skilled workers crosses the demand curve for low-skilled workers.
Unlock Deck
Unlock for access to all 164 flashcards in this deck.
Unlock Deck
k this deck
77
The demand curve for high-skilled workers lies ________ the demand curve for low-skilled workers and the supply curve of high-skilled workers lies ________ the supply curve of low-skilled workers.
A) above; above
B) above; below
C) below; above
D) below; below
E) above; on
A) above; above
B) above; below
C) below; above
D) below; below
E) above; on
Unlock Deck
Unlock for access to all 164 flashcards in this deck.
Unlock Deck
k this deck
78
Pete just started a new job as an assembler and is earning a wage of $10 per hour.Sam,who is an experienced assembler assigned to train Pete,earns $15 per hour.The opportunity cost to Pete of acquiring this skill is
A) $25 per hour.
B) $15 per hour.
C) $10 per hour.
D) $5 per hour.
E) $0 per hour because Pete is being paid a wage.
A) $25 per hour.
B) $15 per hour.
C) $10 per hour.
D) $5 per hour.
E) $0 per hour because Pete is being paid a wage.
Unlock Deck
Unlock for access to all 164 flashcards in this deck.
Unlock Deck
k this deck
79
Compared to low-skilled workers,high-skilled workers have a ________ value of marginal product and ________ opportunity cost of obtaining their skills.
A) higher; a higher
B) higher; a lower
C) lower; a higher
D) lower; a lower
E) higher; the same
A) higher; a higher
B) higher; a lower
C) lower; a higher
D) lower; a lower
E) higher; the same
Unlock Deck
Unlock for access to all 164 flashcards in this deck.
Unlock Deck
k this deck
80
Looking at wage differentials between white men and other groups in the United States,we see that
A) white men and black men earn about the same but women of all races earn less.
B) white men earn more than black men but white women earn less than black men.
C) black men earn less than white men and less than white women.
D) white men and white women earn about the same but minorities earn less.
E) black men and men of Hispanic origin earn about the same amount and both groups of men are paid more than black women and women of Hispanic origin.
Unlock Deck
Unlock for access to all 164 flashcards in this deck.
Unlock Deck
k this deck
Unlock Deck
Unlock for access to all 164 flashcards in this deck.


