Exam 20: Economic Inequality
Exam 1: Getting Started347 Questions
Exam 2: The U.S.and Global Economies211 Questions
Exam 3: The Economic Problem283 Questions
Exam 4: Demand and Supply334 Questions
Exam 5: Elasticities of Demand and Supply342 Questions
Exam 6: Efficiency and Fairness of Markets362 Questions
Exam 7: Government Actions in Markets248 Questions
Exam 8: Taxes270 Questions
Exam 9: Global Markets in Action281 Questions
Exam 10: Externalities301 Questions
Exam 11: Public Goods and Common Resources180 Questions
Exam 12: Markets with Private Information103 Questions
Exam 13: Consumer Choice and Demand295 Questions
Exam 14: Production and Cost274 Questions
Exam 15: Perfect Competition285 Questions
Exam 16: Monopoly384 Questions
Exam 17: Monopolistic Competition221 Questions
Exam 18: Oligopoly228 Questions
Exam 19: Markets for Factors of Production188 Questions
Exam 20: Economic Inequality164 Questions
Select questions type
Which of the following is correct about the United States?
Free
(Multiple Choice)
4.9/5  (32)
(32)
Correct Answer: Verified
D
Which of the following statements is correct?
Free
(Multiple Choice)
5.0/5 (34)
Correct Answer:Verified
A
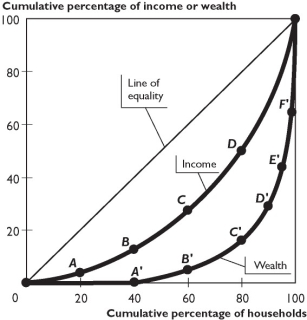 The figure above shows Lorenz curves for a nation
-Based on the figure above,which of the following can cause a movement from point C to point D on the Lorenz curve for income?
The figure above shows Lorenz curves for a nation
-Based on the figure above,which of the following can cause a movement from point C to point D on the Lorenz curve for income?
Free
(Multiple Choice)
4.9/5 (49)
Correct Answer:Verified
E
Looking at the results of government income redistribution programs,we find that the income received by the
(Multiple Choice)
4.8/5 (44)
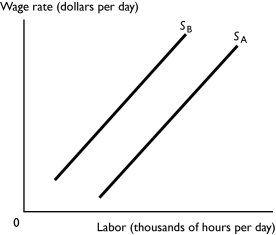 -The figure above shows the market for high and low-skilled labor.Supply curve SB represents the supply of ________ labor because ________.
(Multiple Choice)
4.9/5 (34)
Suppose a government of LaLa Land imposes the following tax rates on its citizens.
Income Tax Rate below \ 30,000 9\% \ 30,001-\ 70,000 12\% above \ 70,000 17\%
The government has imposed a ________ tax system because its citizens will pay a ________ portion of their income as taxes as incomes increase.
(Multiple Choice)
4.9/5 (39)
Which of the following is true? At a given quantity of employment,if the
i.value of marginal product of a high-skill worker is $35 and the value of marginal product of a low-skill worker is $10,the value of marginal product of the skill is $25.
ii.value of marginal product of a high-skill worker is $35 and the value of marginal product of a low-skill worker is $10,the cost of acquiring the skill is $25.
iii.value of marginal product of a skill is $25,then the wage rate must be $25.
(Multiple Choice)
4.9/5 (36)
In the United States in 2010,a family of four was considered to be living below the poverty line only if its household income was less than approximately
(Multiple Choice)
4.8/5 (30)
With a negative income tax that has a $10,000 guaranteed minimum income and a 25 percent tax rate,a household that has earned income of $16,000 has a total income of
(Multiple Choice)
4.9/5 (36)
The figure above shows Lorenz curves for a nation
-Based on the figure above,
(Multiple Choice)
4.8/5 (36)
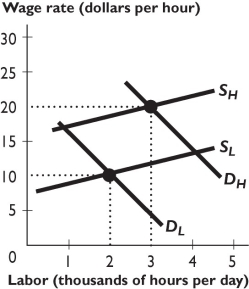 The figure above shows the demand and supply curves for high-skilled (indicated by an "H" subscript) and low-skilled (indicated by an "L" subscript) workers.
-In the figure above,if the cost of acquiring the skill decreased,then the
The figure above shows the demand and supply curves for high-skilled (indicated by an "H" subscript) and low-skilled (indicated by an "L" subscript) workers.
-In the figure above,if the cost of acquiring the skill decreased,then the
(Multiple Choice)
4.8/5 (41)
Group Percent of income Poorest 20\% 5 Second poorest 20\% 10 Middle 20\% 15 Second richest 20\% 25 Richest 20\% 45
The table gives the distribution of income in Mise
-What percent of income is earned by the richest 80 percent of the population?
(Multiple Choice)
4.9/5 (36)
In the United States,the poorest 20 percent of the household receive approximately ________ percent of total money income.
(Multiple Choice)
4.7/5 (31)
Pete just started a new job as an assembler and is earning a wage of $10 per hour.Sam,who is an experienced assembler assigned to train Pete,earns $15 per hour.The opportunity cost to Pete of acquiring this skill is
(Multiple Choice)
4.8/5 (36)
Compared to low-skilled workers,high-skilled workers have a ________ value of marginal product and ________ opportunity cost of obtaining their skills.
(Multiple Choice)
4.7/5 (27)
In the United States,the federal and state income tax system is
(Multiple Choice)
4.7/5 (39)
The figure above shows Lorenz curves for a nation
-Based on the figure above,if the poorest 20 percent group of households increased the share of the nation's income they receive,then
(Multiple Choice)
4.7/5 (43)
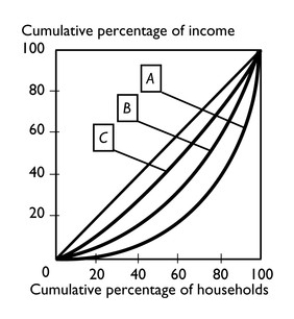 -In the figure above,the nation with the highest average income is nation
(Multiple Choice)
4.8/5 (37)
The figure above shows the demand and supply curves for high-skilled (indicated by an "H" subscript) and low-skilled (indicated by an "L" subscript) workers.
-In the figure above,the compensation for the cost of acquiring the skill creates the difference between the ________ curves and ________.
(Multiple Choice)
4.9/5 (33)
Filters
- Essay(0)
- Multiple Choice(0)
- Short Answer(0)
- True False(0)
- Matching(0)