Deck 14: Inference of the Least-Squares Regression Model
Full screen (f)
Question
Question
The least-squares regression model for one explanatory variable is given by the equation
A) y = mx + b
B) y - = m(x -
  )
)
C) =
=  +
+ 
 +
+ 
D) =
= 
 +
+ 
A) y = mx + b
B) y -
= m(x - )C)
= + + D)
= + Question
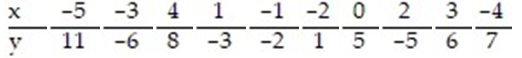
Find the standard error of estimate,  , for the data below, given that
  = 2x + 1.
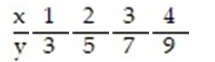
A) 0
B) 2
C) 1
D) 3
, for the data below, given that = 2x + 1. A) 0
B) 2
C) 1
D) 3
Question
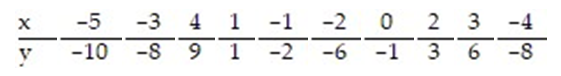
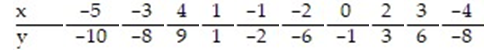
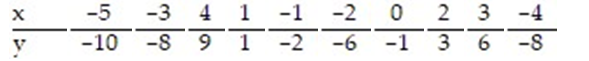
Find the standard error of estimate,  , for the data below, given that
  = -2.5x.
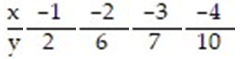
A) 0.532
B) 0.349
C) 0.675
D) 0.866
, for the data below, given that = -2.5x. A) 0.532
B) 0.349
C) 0.675
D) 0.866
Question
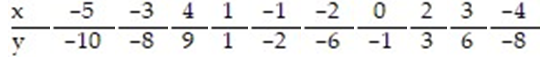
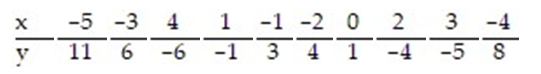
Find the standard error of estimate,  , for the data below, given that
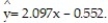
A) 0.976
B) -0.990
C) 0.980
D) 0.990
, for the data below, given that A) 0.976
B) -0.990
C) 0.980
D) 0.990
Question
Find the standard error of estimate,  , for the data below, given that
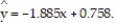

A) 0.981
B) 0.011
C) 0.613
D) 0.312
, for the data below, given that A) 0.981
B) 0.011
C) 0.613
D) 0.312
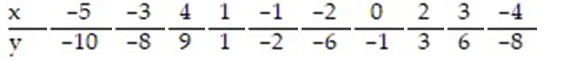
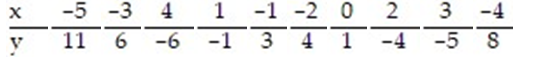
Question
Find the standard error of estimate,  , for the data below, given that
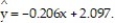
A) 3.203
B) 8.214
C) 5.918
D) 6.306
, for the data below, given that A) 3.203
B) 8.214
C) 5.918
D) 6.306
Question
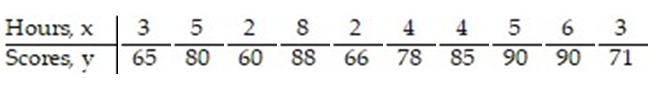
The data below are the final exam scores of 10 randomly selected engineering students and the number of hours they slept the night before the exam. Find the standard error of estimate,  , given that
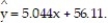

A) 8.912
B) 7.913
C) 9.875
D) 6.305
, given that A) 8.912
B) 7.913
C) 9.875
D) 6.305
Question
The data below are the number of absences and the final grades of 9 randomly selected students in an engineering class. Find the standard error of estimate,  , given that
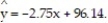

A) 3.876
B) 4.531
C) 1.798
D) 2.160
, given that A) 3.876
B) 4.531
C) 1.798
D) 2.160
Question
Test the claim, at the ? = 0.05 level of significance, that a linear relation exists between the two variables, for the data below, given that  = -2.5x.
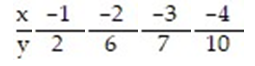
= -2.5x. Question
Test the claim, at the ? = 0.01 level of significance, that a linear relation exists between the two variables, for the data below, given that 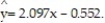
Question
Test the claim, at the ? = 0.10 level of significance, that a linear relation exists between the two variables, for the data below, given that 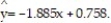
Question
A breeder of thoroughbred horses wishes to model the relationship between the gestation period and the length of life of a horse. The breeder believes that the two variables may follow a linear trend. The information in the table was supplied to the breeder from various thoroughbred stables across the state. Test the claim, at the ? =0.05 level of significance, that a linear relation exists between the gestation period and the length of life of a horse. 
Question
If a hypothesis test of the linear relation between the explanatory and the response variable is of the type where  :
:  = 0,
= 0,  :
:  > 0, then we are testing the claim that
A) no linear relationship exists.
B) a relationship exist without regard to the sign of the slope.
C) the slope of the least square regression model is positive.
D) the slope of the least squares regression model is negative.
: = 0, : > 0, then we are testing the claim thatA) no linear relationship exists.
B) a relationship exist without regard to the sign of the slope.
C) the slope of the least square regression model is positive.
D) the slope of the least squares regression model is negative.
Question
Construct a 95% confidence interval about the slope of the true least-squares regression line, for the data below, given that  = -2.5x.
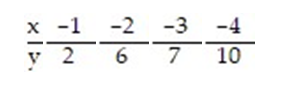
A) (-6.226, 1.226)
B) (-3.630, -1.370)
C) (-4.165, -0.835)
D) (-3.731, -1.269)
= -2.5x. A) (-6.226, 1.226)
B) (-3.630, -1.370)
C) (-4.165, -0.835)
D) (-3.731, -1.269)
Question
Construct a 99% confidence interval about the slope of the true least-squares regression line, for the data below, given that 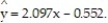
A) (1.787, 2.407)
B) (1.749, 2.445)
C) (1.738, 2.456)
D) ( -1.177, 5.371)
A) (1.787, 2.407)
B) (1.749, 2.445)
C) (1.738, 2.456)
D) ( -1.177, 5.371)
Question
Construct a 90% confidence interval about the slope of the true least-squares regression line, for the data below, for the data below, given that 
A) (-1.979, -1.791)
B) (-2.008, -1.762)
C) (-2.010, -1.760)
D) (-3.025, -0.745)
A) (-1.979, -1.791)
B) (-2.008, -1.762)
C) (-2.010, -1.760)
D) (-3.025, -0.745)
Question
The data below are the ages and systolic blood pressures (measured in millimeters of mercury) of 9 randomly selected adults.Construct a 95% confidence interval about the slope of the true least-squares regression line, for the data below, given that 

A) (-8.443, 11.419)
B) (1.098, 1.877)
C) (1.175, 1.801)
D) (1.108, 1.868)
A) (-8.443, 11.419)
B) (1.098, 1.877)
C) (1.175, 1.801)
D) (1.108, 1.868)
Question
A breeder of Thoroughbred horses wishes to model the relationship between the gestation period and the length of life of a horse. The breeder believes that the two variables may follow a linear trend. The information in the table was supplied to the breeder from various thoroughbred stables across the state. Construct a 90% confidence interval about the slope of the true least-squares regression line. 
Question
Construct a 95% confidence interval about the mean value of y, given x = -3.5,  = 2.097x - 0.552 and
A) (-8.921,-6.862)
B) (-12.142 ,-6.475)
C) (-4.598 ,-1.986)
D) (-10.367, -5.417)
= 2.097x - 0.552 and A) (-8.921,-6.862)
B) (-12.142 ,-6.475)
C) (-4.598 ,-1.986)
D) (-10.367, -5.417)
Question
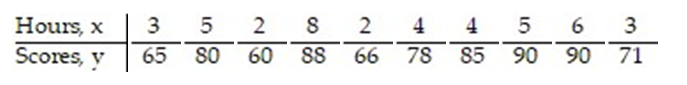
The data below are the scores of 10 randomly selected students from a statistics class and the number of hours they slept the night before the exam. Construct a 95% confidence interval about the mean value of y, the score on the final exam, given x = 7 hours,  = 5.044x + 56.11 and
A) (77.21, 110.45)
B) (82.840, 99.996)
C) (74.54, 108.30)
D) (79.16, 112.34)
= 5.044x + 56.11 and A) (77.21, 110.45)
B) (82.840, 99.996)
C) (74.54, 108.30)
D) (79.16, 112.34)
Question
In an area of Russia, records were kept on the relationship between the rainfall (in inches) and the yield of wheat (bushels per acre). Construct a 95% confidence interval about the mean value of y, the yield, given  inches,
 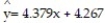 and
and 
A) (39.86, 65.98)
B) (43.56, 61.32)
C) (40.54 , 64.15)
D) (49.41, 55.47)
inches, and A) (39.86, 65.98)
B) (43.56, 61.32)
C) (40.54 , 64.15)
D) (49.41, 55.47)
Question
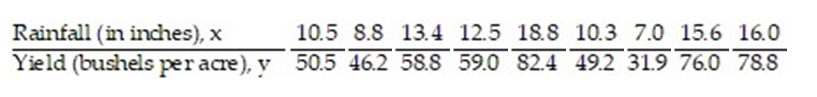
A company keeps extensive records on its new salespeople on the premise that sales should increase with experience. A random sample of seven new salespeople produced the data on experience and sales shown in the table. Construct a 90% confidence interval about the mean value of y when x = 5 months. 
Question
Question
When constructing a confidence interval about the mean response of y in a linear regression, the t-distribution is used with_____________degrees of freedom.
A) n + k - 2
B) +
+  -2
-2
C) n - 1
D) n - 2
A) n + k - 2
B)
+ -2C) n - 1
D) n - 2
Question
Construct a 95% prediction interval for y given x = -3.5,  = 2.097x - 0.552 and
A) (-3.187, -2.154)
B) (-4.598, -1.986)
C) (-8.921, -6.862)
D) (-10.367, -5.417)
= 2.097x - 0.552 and A) (-3.187, -2.154)
B) (-4.598, -1.986)
C) (-8.921, -6.862)
D) (-10.367, -5.417)
Question
The data below are the scores of 10 randomly selected students from a statistics class and the number of hours they slept the night before the exam. Construct a 95% prediction interval for y, the score on the final exam, given x = 7 hours,  = 5.044x + 56.11 and
A) (77.21, 110.45)
B) (82.840, 99.996)
C) (55.43, 78.19)
D) (74.54, 108.30)
= 5.044x + 56.11 and A) (77.21, 110.45)
B) (82.840, 99.996)
C) (55.43, 78.19)
D) (74.54, 108.30)
Question
A breeder of thoroughbred horses wishes to model the relationship between the gestation period and the length of life of a horse. The breeder believes that the two variables may follow a linear trend. The information in the table was supplied to the breeder from various thoroughbred stables across the state. Construct a 95% prediction interval about the value of y when x = 300 days. 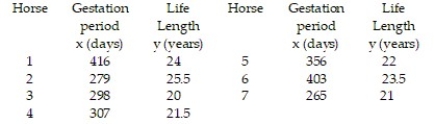

Unlock Deck
Sign up to unlock the cards in this deck!
Unlock Deck
Unlock Deck
1/28
Play
Full screen (f)
Deck 14: Inference of the Least-Squares Regression Model
1
One of the requirements for conducting inference on the least-squares regression model is that the
A) mean of the response variable changes at a constant rate while the standard deviation remains constant.
B) mean of the explanatory variable changes at a constant rate while the standard deviation remains constant.
C) mean of the explanatory variable remains constant while the standard deviation changes at a constant rate.
D) mean of the response variable remains constant while the standard deviation changes at a constant rate.
mean of the response variable changes at a constant rate while the standard deviation remains constant.
2
The least-squares regression model for one explanatory variable is given by the equation
A) y = mx + b
B) y - = m(x - )
C) = + +
D) = +
A) y = mx + b
B) y -
= m(x - )C)
= + + D)
= + = + + 3
Find the standard error of estimate, , for the data below, given that = 2x + 1.
A) 0
B) 2
C) 1
D) 3
, for the data below, given that = 2x + 1. A) 0
B) 2
C) 1
D) 3
0
4
Find the standard error of estimate, , for the data below, given that = -2.5x.
A) 0.532
B) 0.349
C) 0.675
D) 0.866
, for the data below, given that = -2.5x. A) 0.532
B) 0.349
C) 0.675
D) 0.866
Unlock Deck
Unlock for access to all 28 flashcards in this deck.
Unlock Deck
k this deck
5
Find the standard error of estimate, , for the data below, given that
A) 0.976
B) -0.990
C) 0.980
D) 0.990
, for the data below, given that A) 0.976
B) -0.990
C) 0.980
D) 0.990
Unlock Deck
Unlock for access to all 28 flashcards in this deck.
Unlock Deck
k this deck
6
Find the standard error of estimate, , for the data below, given that
A) 0.981
B) 0.011
C) 0.613
D) 0.312
, for the data below, given that A) 0.981
B) 0.011
C) 0.613
D) 0.312
Unlock Deck
Unlock for access to all 28 flashcards in this deck.
Unlock Deck
k this deck
7
Find the standard error of estimate, , for the data below, given that
A) 3.203
B) 8.214
C) 5.918
D) 6.306
, for the data below, given that A) 3.203
B) 8.214
C) 5.918
D) 6.306
Unlock Deck
Unlock for access to all 28 flashcards in this deck.
Unlock Deck
k this deck
8
The data below are the final exam scores of 10 randomly selected engineering students and the number of hours they slept the night before the exam. Find the standard error of estimate, , given that
A) 8.912
B) 7.913
C) 9.875
D) 6.305
, given that A) 8.912
B) 7.913
C) 9.875
D) 6.305
Unlock Deck
Unlock for access to all 28 flashcards in this deck.
Unlock Deck
k this deck
9
The data below are the number of absences and the final grades of 9 randomly selected students in an engineering class. Find the standard error of estimate, , given that
A) 3.876
B) 4.531
C) 1.798
D) 2.160
, given that A) 3.876
B) 4.531
C) 1.798
D) 2.160
Unlock Deck
Unlock for access to all 28 flashcards in this deck.
Unlock Deck
k this deck
10
Test the claim, at the ? = 0.05 level of significance, that a linear relation exists between the two variables, for the data below, given that = -2.5x.
= -2.5x. Unlock Deck
Unlock for access to all 28 flashcards in this deck.
Unlock Deck
k this deck
11
Test the claim, at the ? = 0.01 level of significance, that a linear relation exists between the two variables, for the data below, given that
Unlock Deck
Unlock for access to all 28 flashcards in this deck.
Unlock Deck
k this deck
12
Test the claim, at the ? = 0.10 level of significance, that a linear relation exists between the two variables, for the data below, given that
Unlock Deck
Unlock for access to all 28 flashcards in this deck.
Unlock Deck
k this deck
13
A breeder of thoroughbred horses wishes to model the relationship between the gestation period and the length of life of a horse. The breeder believes that the two variables may follow a linear trend. The information in the table was supplied to the breeder from various thoroughbred stables across the state. Test the claim, at the ? =0.05 level of significance, that a linear relation exists between the gestation period and the length of life of a horse.
Unlock Deck
Unlock for access to all 28 flashcards in this deck.
Unlock Deck
k this deck
14
If a hypothesis test of the linear relation between the explanatory and the response variable is of the type where : = 0, : > 0, then we are testing the claim that
A) no linear relationship exists.
B) a relationship exist without regard to the sign of the slope.
C) the slope of the least square regression model is positive.
D) the slope of the least squares regression model is negative.
: = 0, : > 0, then we are testing the claim thatA) no linear relationship exists.
B) a relationship exist without regard to the sign of the slope.
C) the slope of the least square regression model is positive.
D) the slope of the least squares regression model is negative.
Unlock Deck
Unlock for access to all 28 flashcards in this deck.
Unlock Deck
k this deck
15
Construct a 95% confidence interval about the slope of the true least-squares regression line, for the data below, given that = -2.5x.
A) (-6.226, 1.226)
B) (-3.630, -1.370)
C) (-4.165, -0.835)
D) (-3.731, -1.269)
= -2.5x. A) (-6.226, 1.226)
B) (-3.630, -1.370)
C) (-4.165, -0.835)
D) (-3.731, -1.269)
Unlock Deck
Unlock for access to all 28 flashcards in this deck.
Unlock Deck
k this deck
16
Construct a 99% confidence interval about the slope of the true least-squares regression line, for the data below, given that
A) (1.787, 2.407)
B) (1.749, 2.445)
C) (1.738, 2.456)
D) ( -1.177, 5.371)
A) (1.787, 2.407)
B) (1.749, 2.445)
C) (1.738, 2.456)
D) ( -1.177, 5.371)
Unlock Deck
Unlock for access to all 28 flashcards in this deck.
Unlock Deck
k this deck
17
Construct a 90% confidence interval about the slope of the true least-squares regression line, for the data below, for the data below, given that
A) (-1.979, -1.791)
B) (-2.008, -1.762)
C) (-2.010, -1.760)
D) (-3.025, -0.745)
A) (-1.979, -1.791)
B) (-2.008, -1.762)
C) (-2.010, -1.760)
D) (-3.025, -0.745)
Unlock Deck
Unlock for access to all 28 flashcards in this deck.
Unlock Deck
k this deck
18
The data below are the ages and systolic blood pressures (measured in millimeters of mercury) of 9 randomly selected adults.Construct a 95% confidence interval about the slope of the true least-squares regression line, for the data below, given that
A) (-8.443, 11.419)
B) (1.098, 1.877)
C) (1.175, 1.801)
D) (1.108, 1.868)
A) (-8.443, 11.419)
B) (1.098, 1.877)
C) (1.175, 1.801)
D) (1.108, 1.868)
Unlock Deck
Unlock for access to all 28 flashcards in this deck.
Unlock Deck
k this deck
19
A breeder of Thoroughbred horses wishes to model the relationship between the gestation period and the length of life of a horse. The breeder believes that the two variables may follow a linear trend. The information in the table was supplied to the breeder from various thoroughbred stables across the state. Construct a 90% confidence interval about the slope of the true least-squares regression line.
Unlock Deck
Unlock for access to all 28 flashcards in this deck.
Unlock Deck
k this deck
20
Construct a 95% confidence interval about the mean value of y, given x = -3.5, = 2.097x - 0.552 and
A) (-8.921,-6.862)
B) (-12.142 ,-6.475)
C) (-4.598 ,-1.986)
D) (-10.367, -5.417)
= 2.097x - 0.552 and A) (-8.921,-6.862)
B) (-12.142 ,-6.475)
C) (-4.598 ,-1.986)
D) (-10.367, -5.417)
Unlock Deck
Unlock for access to all 28 flashcards in this deck.
Unlock Deck
k this deck
21
The data below are the scores of 10 randomly selected students from a statistics class and the number of hours they slept the night before the exam. Construct a 95% confidence interval about the mean value of y, the score on the final exam, given x = 7 hours, = 5.044x + 56.11 and
A) (77.21, 110.45)
B) (82.840, 99.996)
C) (74.54, 108.30)
D) (79.16, 112.34)
= 5.044x + 56.11 and A) (77.21, 110.45)
B) (82.840, 99.996)
C) (74.54, 108.30)
D) (79.16, 112.34)
Unlock Deck
Unlock for access to all 28 flashcards in this deck.
Unlock Deck
k this deck
22
In an area of Russia, records were kept on the relationship between the rainfall (in inches) and the yield of wheat (bushels per acre). Construct a 95% confidence interval about the mean value of y, the yield, given inches, and
A) (39.86, 65.98)
B) (43.56, 61.32)
C) (40.54 , 64.15)
D) (49.41, 55.47)
inches, and A) (39.86, 65.98)
B) (43.56, 61.32)
C) (40.54 , 64.15)
D) (49.41, 55.47)
Unlock Deck
Unlock for access to all 28 flashcards in this deck.
Unlock Deck
k this deck
23
A company keeps extensive records on its new salespeople on the premise that sales should increase with experience. A random sample of seven new salespeople produced the data on experience and sales shown in the table. Construct a 90% confidence interval about the mean value of y when x = 5 months.
Unlock Deck
Unlock for access to all 28 flashcards in this deck.
Unlock Deck
k this deck
24
How does a confidence interval differ from a prediction interval?
A) Confidence intervals are used to measure the accuracy of a single individual's predicted value, while a prediction interval is used to measure the accuracy of the mean response of all the individuals in the population.
B) Confidence intervals are used to measure the accuracy of the mean response of all the individuals in the population, while a prediction interval is used to measure the accuracy of a single individual's predicted value.
C) Confidence intervals are constructed about the predicted values of x while prediction intervals a constructed about a particular value of y
D) Confidence intervals are constructed about the predicted values of y while prediction intervals a constructed about a particular value of x
Unlock Deck
Unlock for access to all 28 flashcards in this deck.
Unlock Deck
k this deck
25
When constructing a confidence interval about the mean response of y in a linear regression, the t-distribution is used with_____________degrees of freedom.
A) n + k - 2
B) + -2
C) n - 1
D) n - 2
A) n + k - 2
B)
+ -2C) n - 1
D) n - 2
Unlock Deck
Unlock for access to all 28 flashcards in this deck.
Unlock Deck
k this deck
26
Construct a 95% prediction interval for y given x = -3.5, = 2.097x - 0.552 and
A) (-3.187, -2.154)
B) (-4.598, -1.986)
C) (-8.921, -6.862)
D) (-10.367, -5.417)
= 2.097x - 0.552 and A) (-3.187, -2.154)
B) (-4.598, -1.986)
C) (-8.921, -6.862)
D) (-10.367, -5.417)
Unlock Deck
Unlock for access to all 28 flashcards in this deck.
Unlock Deck
k this deck
27
The data below are the scores of 10 randomly selected students from a statistics class and the number of hours they slept the night before the exam. Construct a 95% prediction interval for y, the score on the final exam, given x = 7 hours, = 5.044x + 56.11 and
A) (77.21, 110.45)
B) (82.840, 99.996)
C) (55.43, 78.19)
D) (74.54, 108.30)
= 5.044x + 56.11 and A) (77.21, 110.45)
B) (82.840, 99.996)
C) (55.43, 78.19)
D) (74.54, 108.30)
Unlock Deck
Unlock for access to all 28 flashcards in this deck.
Unlock Deck
k this deck
28
A breeder of thoroughbred horses wishes to model the relationship between the gestation period and the length of life of a horse. The breeder believes that the two variables may follow a linear trend. The information in the table was supplied to the breeder from various thoroughbred stables across the state. Construct a 95% prediction interval about the value of y when x = 300 days.
Unlock Deck
Unlock for access to all 28 flashcards in this deck.
Unlock Deck
k this deck
Unlock Deck
Unlock for access to all 28 flashcards in this deck.


