Exam 14: Inference of the Least-Squares Regression Model
Exam 1: Data Collection34 Questions
Exam 2: Organizing and Summarizing Data30 Questions
Exam 3: Numerically Summarizing Data66 Questions
Exam 4: Describing the Relation Between Two Variables92 Questions
Exam 5: Probability91 Questions
Exam 6: Discrete Probability Distributions32 Questions
Exam 7: The Normal Probability Distributions36 Questions
Exam 8: Sampling Distributions12 Questions
Exam 9: Estimating the Value of a Parameter Using Confidence Intervals24 Questions
Exam 10: Hypothesis Tests Regarding a Parameter36 Questions
Exam 11: Inference on Two Samples65 Questions
Exam 12: Inference on Categorical Data16 Questions
Exam 13: Comparing Three or More Means15 Questions
Exam 14: Inference of the Least-Squares Regression Model28 Questions
Select questions type
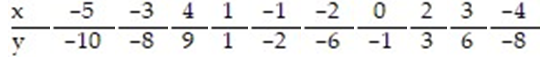
Find the standard error of estimate,  , for the data below, given that
  = 2x + 1.
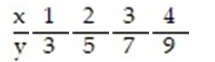
Free
(Multiple Choice)
4.9/5  (25)
(25)
Correct Answer: Verified
A
If a hypothesis test of the linear relation between the explanatory and the response variable is of the type where  :
:  = 0,
= 0,  :
:  > 0, then we are testing the claim that
Free
(Multiple Choice)
4.9/5 (27)
Correct Answer:Verified
C
The data below are the ages and systolic blood pressures (measured in millimeters of mercury) of 9 randomly selected adults.Construct a 95% confidence interval about the slope of the true least-squares regression line, for the data below, given that 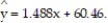

Free
(Multiple Choice)
4.7/5 (29)
Correct Answer:Verified
B
The data below are the number of absences and the final grades of 9 randomly selected students in an engineering class. Find the standard error of estimate,  , given that
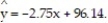

(Multiple Choice)
4.9/5 (32)
The least-squares regression model for one explanatory variable is given by the equation
(Multiple Choice)
4.8/5 (23)
Test the claim, at the ? = 0.05 level of significance, that a linear relation exists between the two variables, for the data below, given that  = -2.5x.
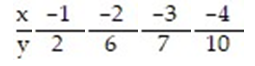
(Essay)
4.8/5 (40)
A breeder of thoroughbred horses wishes to model the relationship between the gestation period and the length of life of a horse. The breeder believes that the two variables may follow a linear trend. The information in the table was supplied to the breeder from various thoroughbred stables across the state. Test the claim, at the ? =0.05 level of significance, that a linear relation exists between the gestation period and the length of life of a horse. 
(Essay)
4.8/5 (37)
A breeder of thoroughbred horses wishes to model the relationship between the gestation period and the length of life of a horse. The breeder believes that the two variables may follow a linear trend. The information in the table was supplied to the breeder from various thoroughbred stables across the state. Construct a 95% prediction interval about the value of y when x = 300 days. 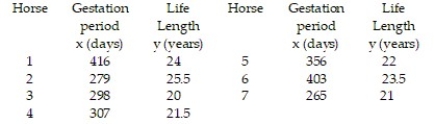
(Essay)
4.9/5 (35)
The data below are the final exam scores of 10 randomly selected engineering students and the number of hours they slept the night before the exam. Find the standard error of estimate,  , given that
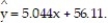

(Multiple Choice)
4.8/5 (40)
One of the requirements for conducting inference on the least-squares regression model is that the
(Multiple Choice)
4.9/5 (37)
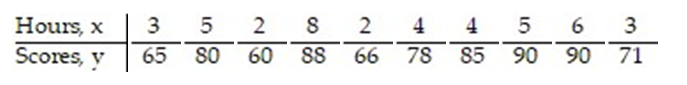
The data below are the scores of 10 randomly selected students from a statistics class and the number of hours they slept the night before the exam. Construct a 95% confidence interval about the mean value of y, the score on the final exam, given x = 7 hours,  = 5.044x + 56.11 and
(Multiple Choice)
4.9/5 (37)
Test the claim, at the ? = 0.01 level of significance, that a linear relation exists between the two variables, for the data below, given that 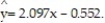
(Essay)
4.9/5 (25)
How does a confidence interval differ from a prediction interval?
(Multiple Choice)
4.7/5 (37)
When constructing a confidence interval about the mean response of y in a linear regression, the t-distribution is used with_____________degrees of freedom.
(Multiple Choice)
4.8/5 (45)
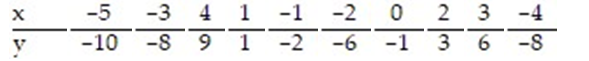
Construct a 95% prediction interval for y given x = -3.5,  = 2.097x - 0.552 and
(Multiple Choice)
4.9/5 (38)
Construct a 99% confidence interval about the slope of the true least-squares regression line, for the data below, given that 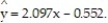
(Multiple Choice)
4.8/5 (26)
A breeder of Thoroughbred horses wishes to model the relationship between the gestation period and the length of life of a horse. The breeder believes that the two variables may follow a linear trend. The information in the table was supplied to the breeder from various thoroughbred stables across the state. Construct a 90% confidence interval about the slope of the true least-squares regression line. 
(Essay)
4.8/5 (31)
Find the standard error of estimate,  , for the data below, given that
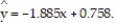

(Multiple Choice)
5.0/5 (33)
Construct a 90% confidence interval about the slope of the true least-squares regression line, for the data below, for the data below, given that 
(Multiple Choice)
4.7/5 (40)
Find the standard error of estimate,  , for the data below, given that
  = -2.5x.
(Multiple Choice)
4.7/5 (35)
Filters
- Essay(0)
- Multiple Choice(0)
- Short Answer(0)
- True False(0)
- Matching(0)