Deck 11: Inference on Two Samples
Full screen (f)
Question
Find the test statistic, z, to test the hypothesis that  =
=  . Use ? = 0.05. The sample statistics listed below are from independent samples.Sample statistics:
  = 50,
= 50,  = 35, and
  = 60,
= 60,  = 40
= 40
A) 2.361
B) 1.328
C) 0.374
D) 0.982
= . Use ? = 0.05. The sample statistics listed below are from independent samples.Sample statistics: = 50, = 35, and = 60, = 40A) 2.361
B) 1.328
C) 0.374
D) 0.982
Question
Find the test statistic estimate, z, to test the hypothesis that  >
>  . Use ? = 0.01. The sample statistics listed below are from independent samples.Sample statistics:
  = 100,
  = 38, and
  = 140,
  = 50
= 50
A) 0.362
B) 1.324
C) 2.116
D) 0.638
> . Use ? = 0.01. The sample statistics listed below are from independent samples.Sample statistics: = 100, = 38, and = 140, = 50A) 0.362
B) 1.324
C) 2.116
D) 0.638
Question
Find the test statistic, z, to test the hypothesis that  <
<  . Use ? = 0.10. The sample statistics listed below are from independent samples.Sample statistics:
  = 550,
  = 121, and
  = 690,
  = 195
= 195
A) -2.513
B) -2.132
C) 1.116
D) -0.985
< . Use ? = 0.10. The sample statistics listed below are from independent samples.Sample statistics: = 550, = 121, and = 690, = 195A) -2.513
B) -2.132
C) 1.116
D) -0.985
Question
Find the test statistic, z, to test the hypothesis that  ?
?  . Use ? = 0.02. The sample statistics listed below are from independent samples.Sample statistics:
  = 1000,
  = 250, and
  = 1200,
  = 195
= 195
A) 2.798
B) 4.761
C) 5.087
D) 3.212
? . Use ? = 0.02. The sample statistics listed below are from independent samples.Sample statistics: = 1000, = 250, and = 1200, = 195A) 2.798
B) 4.761
C) 5.087
D) 3.212
Question
Test the hypothesis that  =
=  . Use α = 0.05. The sample statistics listed below are from independent samples.Sample statistics:
  = 50,
= 50,  = 35, and
  = 60,
= 60,  = 40
= 40
= . Use α = 0.05. The sample statistics listed below are from independent samples.Sample statistics: = 50, = 35, and = 60, = 40 Question
Test the hypothesis that  >
>  . Use α = 0.01. The sample statistics listed below are from independent samples.Sample statistics:
  = 100,
  = 38, and
  = 140,
  = 50
= 50
> . Use α = 0.01. The sample statistics listed below are from independent samples.Sample statistics: = 100, = 38, and = 140, = 50 Question
Test the hypothesis that  <
<  . Use α = 0.10. The sample statistics listed below are from independent samples.Sample statistics:
  = 550,
  = 121, and
  = 690,
  = 195
= 195
< . Use α = 0.10. The sample statistics listed below are from independent samples.Sample statistics: = 550, = 121, and = 690, = 195 Question
Test the hypothesis that  ≠
≠  . Use α = 0.02. The sample statistics listed below are from independent samples.Sample statistics:
  = 1000,
  = 250, and
  = 1200,
  = 195.
≠ . Use α = 0.02. The sample statistics listed below are from independent samples.Sample statistics: = 1000, = 250, and = 1200, = 195. Question
Question
To perform a hypothesis test of two population proportions, the pooled estimate of p must be determined. The pooled estimate,  , is
, is
A) =
= 
B) =
=  +
+ 
C) =
= 
D) =
= 
, isA)
= B)
= + C)
= D)
= Question
Construct a 95% confidence interval for  -
-  . The sample statistics listed below are from independent samples.Sample statistics:
  = 50,
= 50,  = 35, and
  = 60,
= 60,  = 40
= 40
A) (-0.141, 0.208)
B) (-0.871, 0.872)
C) (-2.391, 3.112)
D) (-1.341, 1.781)
- . The sample statistics listed below are from independent samples.Sample statistics: = 50, = 35, and = 60, = 40A) (-0.141, 0.208)
B) (-0.871, 0.872)
C) (-2.391, 3.112)
D) (-1.341, 1.781)
Question
Construct a 98% confidence interval for  -
-  . The sample statistics listed below are from independent samples.Sample statistics:
  = 1000,
  = 250, and
  = 1200,
  = 195
= 195
A) (0.581, 1.819)
B) (-0.621, 0.781)
C) (0.047, 0.128)
D) (1.516, 3.021)
- . The sample statistics listed below are from independent samples.Sample statistics: = 1000, = 250, and = 1200, = 195A) (0.581, 1.819)
B) (-0.621, 0.781)
C) (0.047, 0.128)
D) (1.516, 3.021)
Question
Construct a 95% confidence interval for  -
-  for a survey that finds 30% of 240 males and 41% of 200 females are opposed to the death penalty.
A) (-1.532, 1.342)
B) (-0.561, 0.651)
C) (-0.200, -0.021)
D) (-1.324, 1.512)
- for a survey that finds 30% of 240 males and 41% of 200 females are opposed to the death penalty.A) (-1.532, 1.342)
B) (-0.561, 0.651)
C) (-0.200, -0.021)
D) (-1.324, 1.512)
Question
To construct a confidence interval for the difference of two population proportions the samples must be independently obtained random samples, both must consist of less than 5% of the population, and
A) only one of (1 -
(1 -  ) ? 10 or
  (1 -
(1 -  ) ? 10 must be true.
B) (1-
(1-  )
)  (1-
(1-  )?100.
C) both (1 -
(1 -  ) ? 10 and
  (1 -
(1 -  ) ? 10 must be true.
D) (1-
(1-  )+
)+  (1-
(1-  )?20.
)?20.
A) only one of
(1 - ) ? 10 or (1 - ) ? 10 must be true.B)
(1- ) (1- )?100.C) both
(1 - ) ? 10 and (1 - ) ? 10 must be true.D)
(1- )+ (1- )?20. Question
Two surgical procedures are widely used to treat a certain type of cancer. To compare the success rates of the two procedures, random samples of the two types of surgical patients were obtained and the numbers of patients who showed no recurrence of the disease after a 1-year period were recorded. The data are shown in the table. How large a sample would be necessary in order to estimate the difference in the true success rates to within 0.10 with 95% reliability? 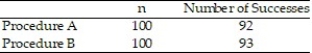
A) =
=  =37
=37
B) =
=  =27
=27
C) =
=  =192
=192
D) =
=  =54
=54
A)
= =37B)
= =27C)
= =192D)
= =54 Question
Data sets A and B are dependent. Find  .
. 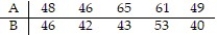 Assume that the paired data came from a population that is normally distributed.
A) -5.1
B) 25.2
C) 33.1
D) 9.0
. Assume that the paired data came from a population that is normally distributed.A) -5.1
B) 25.2
C) 33.1
D) 9.0
Question
Data sets A and B are dependent. Find  .
.  Assume that the paired data came from a population that is normally distributed.
A) -0.76
B) -0.94
C) 0.89
D) 0.58
. Assume that the paired data came from a population that is normally distributed.A) -0.76
B) -0.94
C) 0.89
D) 0.58
Question
Data sets A and B are dependent. Find  .
.  Assume that the paired data came from a population that is normally distributed.
A) 5.6
B) 8.9
C) 7.8
D) 6.8
. Assume that the paired data came from a population that is normally distributed.A) 5.6
B) 8.9
C) 7.8
D) 6.8
Question
Data sets A and B are dependent. Find  .
. 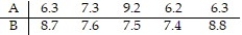 Assume that the paired data came from a population that is normally distributed.
A) 1.73
B) 1.21
C) 1.89
D) 1.32
. Assume that the paired data came from a population that is normally distributed.A) 1.73
B) 1.21
C) 1.89
D) 1.32
Question
Data sets A and B are dependent. Test the claim that  = 0. Use α = 0.05.
 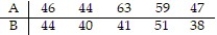 Assume that the paired data came from a population that is normally distributed.
= 0. Use α = 0.05. Assume that the paired data came from a population that is normally distributed. Question
Data sets A and B are dependent. Test the claim that  =0. Use α = 0.01.
 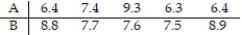 Assume that the paired data came from a population that is normally distributed.
=0. Use α = 0.01. Assume that the paired data came from a population that is normally distributed. Question
Nine students took the SAT. Their scores are listed below. Later on, they read a book on test preparation and retook the SAT. Their new scores are listed below. Test the claim that the book had no effect on their scores. Use α = 0.05. Assume that the distribution is normally distributed. 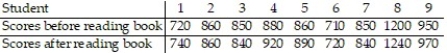
Question
A football coach claims that players can increase their strength by taking a certain supplement. To test the theory, the coach randomly selects 9 athletes and gives them a strength test using a bench press. The results are listed below. Thirty days later, after regular training using the supplement, they are tested again. The new results are listed below. Test the claim that the supplement is effective in increasing the athletes' strength. Use α = 0.05. Assume that the distribution is normally distributed. 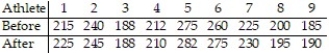
Question
A pharmaceutical company wishes to test a new drug with the expectation of lowering cholesterol levels. Ten subjects are randomly selected and pretested. The results are listed below. The subjects were placed on the drug for a period of 6 months, after which their cholesterol levels were tested again. The results are listed below. (All units are milligrams per deciliter.) Test the company's claim that the drug lowers cholesterol levels. Use α = 0.01. Assume that the distribution is normally distributed. 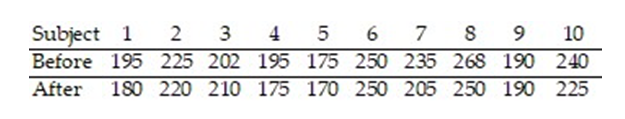
Question
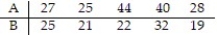
A local company is concerned about the number of days missed by its employees due to illness. A random sample of 10 employees is selected. The number of days absent in one year is listed below. An incentive program is offered in an attempt to decrease the number of days absent. The number of days absent in one year after the incentive program is listed below. Test the claim that the incentive program cuts down on the number of days missed by employees. Use α = 0.05. Assume that the distribution is normally distributed. 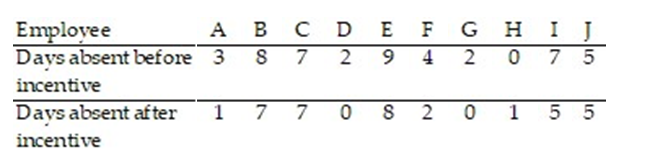
Question
A physician claims that a person's diastolic blood pressure can be lowered if, instead of taking a drug, the person meditates each evening. Ten subjects are randomly selected and pretested. Their blood pressures, measured in millimeters of mercury, are listed below. The 10 patients are instructed in basic meditation and told to practice it each evening for one month. At the end of the month, their blood pressures are taken again. The data are listed below. Test the physician's claim. Use α = 0.01. 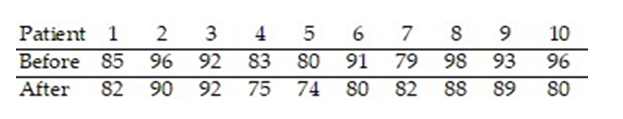
Question
Construct a 95% confidence interval for data sets A and B. Data sets A and B are dependent. 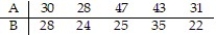 Assume that the paired data came from a population that is normally distributed.
A) (-0.696, 18.700)
B) (-15.341, 15.431)
C) (-0.113, 12.761)
D) (-1.324, 8.981)
Assume that the paired data came from a population that is normally distributed.A) (-0.696, 18.700)
B) (-15.341, 15.431)
C) (-0.113, 12.761)
D) (-1.324, 8.981)
Question
Construct a 99% confidence interval for data sets A and B. Data sets A and B are dependent. 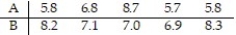 Assume that the paired data came from a population that is normally distributed.
A) (-25.123, 5.761)
B) (-21.342, 18.982)
C) (-15.123, 15.123)
D) (-4.502, 2.622)
Assume that the paired data came from a population that is normally distributed.A) (-25.123, 5.761)
B) (-21.342, 18.982)
C) (-15.123, 15.123)
D) (-4.502, 2.622)
Question
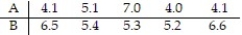
We are interested in comparing the average supermarket prices of two leading colas in the Tampa area. Our sample was taken by randomly going to each of eight supermarkets and recording the price of a six-pack of cola of each brand. The data are shown in the following table. Find a 98% confidence interval for the difference in mean price of brand 1 and brand 2. Assume that the paired data came from a population that is normally distributed. 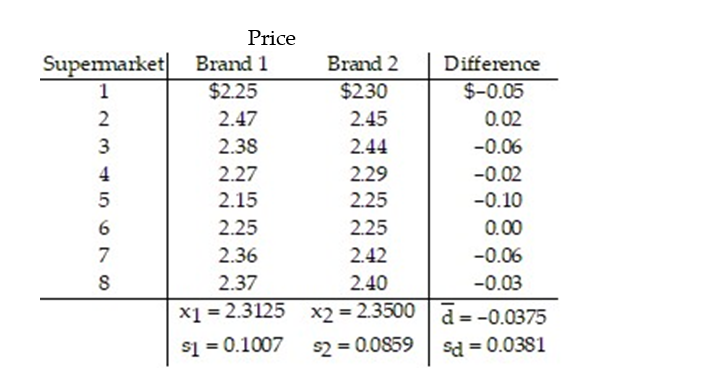
A) (-0.0722, -0.0028)
B) (-0.1768, 0.1018)
C) (-0.0846, 0.0096)
D) (-0.0779, 0.0029)
A) (-0.0722, -0.0028)
B) (-0.1768, 0.1018)
C) (-0.0846, 0.0096)
D) (-0.0779, 0.0029)
Question
A new weight-reducing technique, consisting of a liquid protein diet, is currently undergoing tests before its introduction into the market. A typical test performed is the following: The weights of a random sample of five people are recorded before they are introduced to the liquid protein diet. The five individuals are then instructed to follow the liquid protein diet for 3 weeks. At the end of this period, their weights (in pounds) are again recorded. The results are listed in the table. Let  be the true mean weight of individuals before starting the diet and let
  be the true mean weight of individuals after 3 weeks on the diet. Calculate a 90% confidence interval for the difference between the mean weights before and after the diet is used. Assume that the paired data came from a population that is normally distributed.
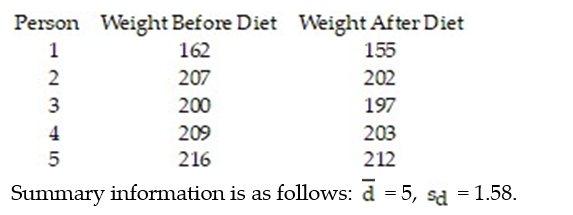
be the true mean weight of individuals before starting the diet and let be the true mean weight of individuals after 3 weeks on the diet. Calculate a 90% confidence interval for the difference between the mean weights before and after the diet is used. Assume that the paired data came from a population that is normally distributed. Question
Seven randomly selected plants that bottle the same beverage implemented a time management program in hopes of improving productivity. The average time, in minutes, that it took the companies to produce the same quantity of bottles before and after the program are listed below. Assume the two population distributions are normal. Construct a 90% confidence interval for  . Assume that the paired data came from a population that is normally distributed.
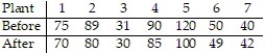
A) (-22, 33.3)
B) (0.21, 10.93)
C) (1.60, 9.54)
D) (-0.22, 11.36)
. Assume that the paired data came from a population that is normally distributed. A) (-22, 33.3)
B) (0.21, 10.93)
C) (1.60, 9.54)
D) (-0.22, 11.36)
Question
Find the test statistic, t, to test the hypothesis that  =
=  . Two samples are randomly selected and come from populations that are normal. The sample statistics are given below.
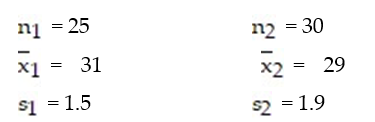
A) 2.892
B) 1.986
C) 4.361
D) 3.287
= . Two samples are randomly selected and come from populations that are normal. The sample statistics are given below. A) 2.892
B) 1.986
C) 4.361
D) 3.287
Question
Find the test statistic, t, to test the hypothesis that  =
=  . Two samples are randomly selected and come from populations that are normal. The sample statistics are given below.
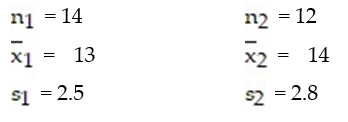
A) -0.954
B) -0.915
C) -0.909
D) -1.558
= . Two samples are randomly selected and come from populations that are normal. The sample statistics are given below. A) -0.954
B) -0.915
C) -0.909
D) -1.558
Question
Find the test statistic, t, to test the hypothesis that  >
>  . Two samples are randomly selected and come from populations that are normal. The sample statistics are given below.
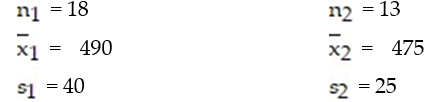
A) 1.865
B) 2.819
C) 1.282
D) 3.271
> . Two samples are randomly selected and come from populations that are normal. The sample statistics are given below. A) 1.865
B) 2.819
C) 1.282
D) 3.271
Question
Find the test statistic, t, to test the hypothesis that  <
<  . Two samples are randomly selected and come from populations that are normal. The sample statistics are given below.
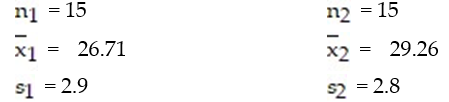
A) -2.450
B) -0.669
C) -1.667
D) -3.165
< . Two samples are randomly selected and come from populations that are normal. The sample statistics are given below. A) -2.450
B) -0.669
C) -1.667
D) -3.165
Question
Find the test statistic, t, to test the hypothesis that  ?
?  . Two samples are randomly selected and come from populations that are normal. The sample statistics are given below.
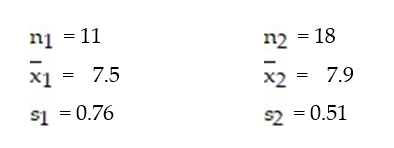
A) -1.821
B) -2.123
C) -1.326
D) -1.546
? . Two samples are randomly selected and come from populations that are normal. The sample statistics are given below. A) -1.821
B) -2.123
C) -1.326
D) -1.546
Question
Test the hypothesis that  =
=  . Two samples are randomly selected from normal populations. The sample statistics are given below. Use α = 0.05.
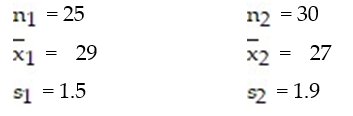
= . Two samples are randomly selected from normal populations. The sample statistics are given below. Use α = 0.05. Question
Test the hypothesis that  =
=  . Two samples are randomly selected from normal populations. The sample statistics are given below. Use α = 0.05.
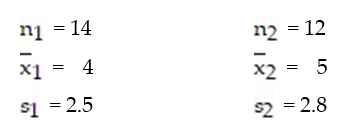
= . Two samples are randomly selected from normal populations. The sample statistics are given below. Use α = 0.05. Question
Test the hypothesis that  >
>  . Two samples are randomly selected from normal populations. The sample statistics are given below. Use α = 0.005.
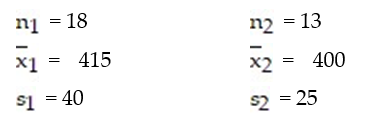
> . Two samples are randomly selected from normal populations. The sample statistics are given below. Use α = 0.005. Question
Test the hypothesis that  <
<  . Two samples are randomly selected from normal populations. The sample statistics are given below. Use α = 0.05.
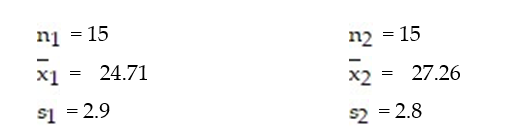
< . Two samples are randomly selected from normal populations. The sample statistics are given below. Use α = 0.05. Question
Test the hypothesis that  ≠
≠  . Two samples are randomly selected from normal populations. The sample statistics are given below. Use α = 0.01.
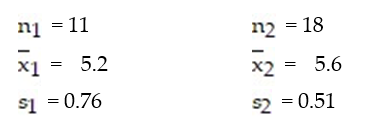
≠ . Two samples are randomly selected from normal populations. The sample statistics are given below. Use α = 0.01. Question
Find the test statistic to test the hypothesis that  =
=  . Two samples are randomly selected from each population. The sample statistics are given below. Use ? = 0.05.
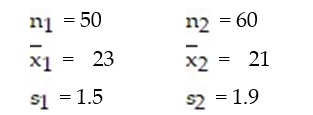
A) 8.1
B) 3.8
C) 4.2
D) 6.2
= . Two samples are randomly selected from each population. The sample statistics are given below. Use ? = 0.05. A) 8.1
B) 3.8
C) 4.2
D) 6.2
Question
Find the test statistic to test the hypothesis that  =
=  . Two samples are randomly selected from each population. The sample statistics are given below. Use ? = 0.05.
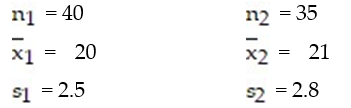
A) -2.6
B) -0.8
C) -1.0
D) -1.6
= . Two samples are randomly selected from each population. The sample statistics are given below. Use ? = 0.05. A) -2.6
B) -0.8
C) -1.0
D) -1.6
Question
Find the test statistic to test the hypothesis that  >
>  . Two samples are randomly selected from each population. The sample statistics are given below. Use ? = 0.05.
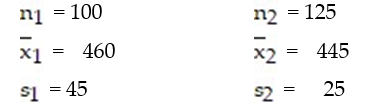
A) 2.81
B) 1.86
C) 2.98
D) 0.91
> . Two samples are randomly selected from each population. The sample statistics are given below. Use ? = 0.05. A) 2.81
B) 1.86
C) 2.98
D) 0.91
Question
Find the test statistic to test the hypothesis that  <
<  . Two samples are randomly selected from each population. The sample statistics are given below. Use ? = 0.05.
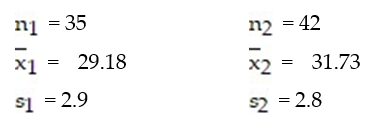
A) -3.90
B) -3.16
C) -1.66
D) -2.63
< . Two samples are randomly selected from each population. The sample statistics are given below. Use ? = 0.05. A) -3.90
B) -3.16
C) -1.66
D) -2.63
Question
Find the test statistic to test the hypothesis that  ?
?  . Two samples are randomly selected from each population. The sample statistics are given below. Use ? = 0.02.
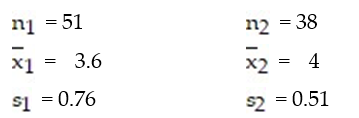
A) -2.32
B) -2.97
C) -2.12
D) -1.82
? . Two samples are randomly selected from each population. The sample statistics are given below. Use ? = 0.02. A) -2.32
B) -2.97
C) -2.12
D) -1.82
Question
Test the hypothesis that  =
=  . Two samples are randomly selected from each population. The sample statistics are given below. Use α = 0.05.
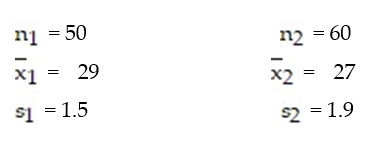
= . Two samples are randomly selected from each population. The sample statistics are given below. Use α = 0.05. Question
Test the hypothesis that  >
>  . Two samples are randomly selected from each population. The sample statistics are given below. Use α = 0.01.
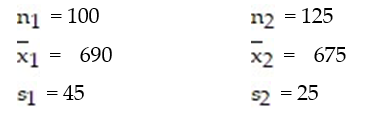
> . Two samples are randomly selected from each population. The sample statistics are given below. Use α = 0.01. Question
Test the hypothesis that  <
<  . Two samples are randomly selected from each population. The sample statistics are given below. Use α = 0.05.
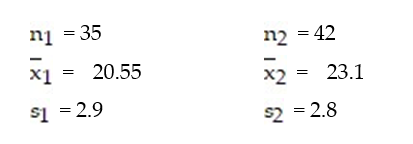
< . Two samples are randomly selected from each population. The sample statistics are given below. Use α = 0.05. Question
Test the hypothesis that  ≠
≠  . Two samples are randomly selected from each population. The sample statistics are given below. Use α = 0.02.
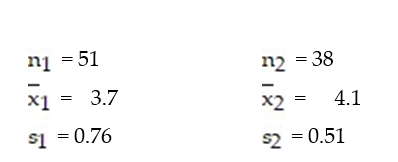
≠ . Two samples are randomly selected from each population. The sample statistics are given below. Use α = 0.02. Question
A university wanted to see whether there was a significant difference in age between its day staff and evening staff. A random sample of 35 staff members is selected from each group. The data are given below. Test the hypothesis that there is no difference in age between the two groups. Use α = 0.05. 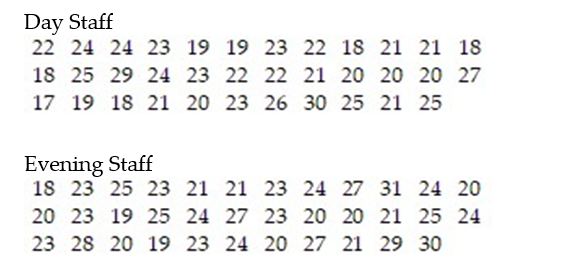
Question
What is the  for testing differences of the means of two independent samples?
A) :
:  ?
? 
B) :
:  >
> 
C) :
:  <
< 
D) :
:  -
-  =0
=0
for testing differences of the means of two independent samples?A)
: ? B)
: > C)
: < D)
: - =0 Question
The degrees of freedom used when testing two independent samples where the population standard deviation is unknown is
A) +
+  -2.
-2.
B) +
+  -1.
-1.
C) the larger of - 1 or
  - 1.
- 1.
D) the smaller of - 1 or
  - 1.
- 1.
A)
+ -2.B)
+ -1.C) the larger of
- 1 or - 1.D) the smaller of
- 1 or - 1. Question
Construct a 95% confidence interval for  -
-  . Two samples are randomly selected from normal populations. The sample statistics are given below.
A) (1.554, 3.651)
B) (1.413, 3.124)
C) (0.360, 3.640)
D) (1.335, 3.012)
- . Two samples are randomly selected from normal populations. The sample statistics are given below. A) (1.554, 3.651)
B) (1.413, 3.124)
C) (0.360, 3.640)
D) (1.335, 3.012)
Question
Construct a 95% confidence interval for  -
-  . Two samples are randomly selected from normal populations. The sample statistics are given below.
A) (-2.762, 2.762)
B) (-1.762, 1.762)
C) (-4.152, 3.981)
D) (-0.977, 0.177)
- . Two samples are randomly selected from normal populations. The sample statistics are given below. A) (-2.762, 2.762)
B) (-1.762, 1.762)
C) (-4.152, 3.981)
D) (-0.977, 0.177)
Question
Construct a 95% confidence interval for  -
-  . Two samples are randomly selected from normal populations. The sample statistics are given below.
A) (-1.679, 1.987)
B) (-3.813, 1.013)
C) (-1.132, 1.543)
D) (2.112, 2.113)
- . Two samples are randomly selected from normal populations. The sample statistics are given below. A) (-1.679, 1.987)
B) (-3.813, 1.013)
C) (-1.132, 1.543)
D) (2.112, 2.113)
Question
Construct a 95% confidence interval for  -
-  . Two samples are randomly selected from each population. The sample statistics are given below.
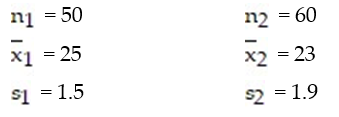
A) (1.572, 2.987)
B) (1.919, 3.142)
C) (1.364, 2.636)
D) (1.723, 3.012)
- . Two samples are randomly selected from each population. The sample statistics are given below. A) (1.572, 2.987)
B) (1.919, 3.142)
C) (1.364, 2.636)
D) (1.723, 3.012)
Question
Construct a 95% confidence interval for  -
-  . Two samples are randomly selected from each population. The sample statistics are given below.
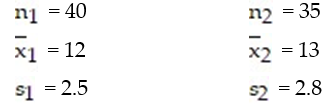
A) (-2.001, -1.873)
B) (-2.209, 0.209)
C) (-1.673, 1.892)
D) (-1.968, 1.561)
- . Two samples are randomly selected from each population. The sample statistics are given below. A) (-2.001, -1.873)
B) (-2.209, 0.209)
C) (-1.673, 1.892)
D) (-1.968, 1.561)
Question
A researcher wishes to determine whether people with high blood pressure can lower their blood pressure by performing yoga exercises. A treatment group and a control group are selected. The sample statistics are given below. Construct a 90% confidence interval for the difference between the two population means,  Would you recommend using yoga exercises? Explain your reasoning.
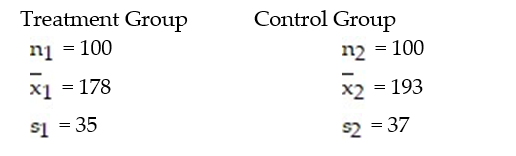
Would you recommend using yoga exercises? Explain your reasoning. Question
Perform the appropriate hypothesis test.
-A random sample of individuals results in
  successes. An independent sample of
  individuals results in
  successes. Does this represent sufficient evidence to conclude that
  at the α = 0.01 level of significance?
-A random sample of
individuals results in successes. An independent sample of individuals results in successes. Does this represent sufficient evidence to conclude that at the α = 0.01 level of significance? Question
Perform the appropriate hypothesis test.
-A random sample of individuals results in
  successes. An independent sample of
  individuals results in
  successes. Does this represent sufficient evidence to conclude that
  at the α = 0.05 level of significance?
-A random sample of
individuals results in successes. An independent sample of individuals results in successes. Does this represent sufficient evidence to conclude that at the α = 0.05 level of significance? Question
Perform the appropriate hypothesis test.
-The table below shows the weights, in pounds, of seven subjects before and after following a particular diet program for three months. Does the sample evidence suggest that the diet program is effective in reducing weight? Use the level of significance. Assume that the differenced data come from a population that is normally distributed with no outliers.
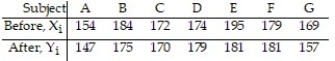
-The table below shows the weights, in pounds, of seven subjects before and after following a particular diet program for three months. Does the sample evidence suggest that the diet program is effective in reducing weight? Use the
level of significance. Assume that the differenced data come from a population that is normally distributed with no outliers. Question
Perform the appropriate hypothesis test.
-The data represent the measure of a variable before and after a treatment. Does the sample evidence suggest that the treatment is effective in increasing the value of the response variable? Use the α = 0.01 level of significance. Assume that the differenced data come from a population that is normally distributed with no outliers.
-The data represent the measure of a variable before and after a treatment. Does the sample evidence suggest that the treatment is effective in increasing the value of the response variable? Use the α = 0.01 level of significance. Assume that the differenced data come from a population that is normally distributed with no outliers.
Question
Question
Perform the appropriate hypothesis test.
-A random samples of 8 apples of variety A and an independent random sample of 13 apples of variety B yielded the following weights in ounces. Do the data provide sufficient evidence to conclude that the mean weight of apples of variety A differs from the mean weight of apples of variety B? Use the α = 0.10 level of significance. Assume that the sample data come from normally distributed populations with no outliers.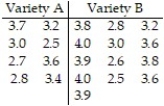
-A random samples of 8 apples of variety A and an independent random sample of 13 apples of variety B yielded the following weights in ounces. Do the data provide sufficient evidence to conclude that the mean weight of apples of variety A differs from the mean weight of apples of variety B? Use the α = 0.10 level of significance. Assume that the sample data come from normally distributed populations with no outliers.

Unlock Deck
Sign up to unlock the cards in this deck!
Unlock Deck
Unlock Deck
1/65
Play
Full screen (f)
Deck 11: Inference on Two Samples
1
Find the test statistic, z, to test the hypothesis that = . Use ? = 0.05. The sample statistics listed below are from independent samples.Sample statistics: = 50, = 35, and = 60, = 40
A) 2.361
B) 1.328
C) 0.374
D) 0.982
= . Use ? = 0.05. The sample statistics listed below are from independent samples.Sample statistics: = 50, = 35, and = 60, = 40A) 2.361
B) 1.328
C) 0.374
D) 0.982
0.374
2
Find the test statistic estimate, z, to test the hypothesis that > . Use ? = 0.01. The sample statistics listed below are from independent samples.Sample statistics: = 100, = 38, and = 140, = 50
A) 0.362
B) 1.324
C) 2.116
D) 0.638
> . Use ? = 0.01. The sample statistics listed below are from independent samples.Sample statistics: = 100, = 38, and = 140, = 50A) 0.362
B) 1.324
C) 2.116
D) 0.638
0.362
3
Find the test statistic, z, to test the hypothesis that < . Use ? = 0.10. The sample statistics listed below are from independent samples.Sample statistics: = 550, = 121, and = 690, = 195
A) -2.513
B) -2.132
C) 1.116
D) -0.985
< . Use ? = 0.10. The sample statistics listed below are from independent samples.Sample statistics: = 550, = 121, and = 690, = 195A) -2.513
B) -2.132
C) 1.116
D) -0.985
-2.513
4
Find the test statistic, z, to test the hypothesis that ? . Use ? = 0.02. The sample statistics listed below are from independent samples.Sample statistics: = 1000, = 250, and = 1200, = 195
A) 2.798
B) 4.761
C) 5.087
D) 3.212
? . Use ? = 0.02. The sample statistics listed below are from independent samples.Sample statistics: = 1000, = 250, and = 1200, = 195A) 2.798
B) 4.761
C) 5.087
D) 3.212
Unlock Deck
Unlock for access to all 65 flashcards in this deck.
Unlock Deck
k this deck
5
Test the hypothesis that = . Use α = 0.05. The sample statistics listed below are from independent samples.Sample statistics: = 50, = 35, and = 60, = 40
= . Use α = 0.05. The sample statistics listed below are from independent samples.Sample statistics: = 50, = 35, and = 60, = 40 Unlock Deck
Unlock for access to all 65 flashcards in this deck.
Unlock Deck
k this deck
6
Test the hypothesis that > . Use α = 0.01. The sample statistics listed below are from independent samples.Sample statistics: = 100, = 38, and = 140, = 50
> . Use α = 0.01. The sample statistics listed below are from independent samples.Sample statistics: = 100, = 38, and = 140, = 50 Unlock Deck
Unlock for access to all 65 flashcards in this deck.
Unlock Deck
k this deck
7
Test the hypothesis that < . Use α = 0.10. The sample statistics listed below are from independent samples.Sample statistics: = 550, = 121, and = 690, = 195
< . Use α = 0.10. The sample statistics listed below are from independent samples.Sample statistics: = 550, = 121, and = 690, = 195 Unlock Deck
Unlock for access to all 65 flashcards in this deck.
Unlock Deck
k this deck
8
Test the hypothesis that ≠ . Use α = 0.02. The sample statistics listed below are from independent samples.Sample statistics: = 1000, = 250, and = 1200, = 195.
≠ . Use α = 0.02. The sample statistics listed below are from independent samples.Sample statistics: = 1000, = 250, and = 1200, = 195. Unlock Deck
Unlock for access to all 65 flashcards in this deck.
Unlock Deck
k this deck
9
A well-known study of 22,000 male physicians was conducted to determine if taking aspirin daily reduces the chances of a heart attack. Half of the physicians were given a regular dose of aspirin while the other half was given placebos. Six years later, among those who took aspirin, 104 suffered heart attacks while among those who took placebos, 189 suffered heart attacks. Does it appear that the aspirin can reduce the number of heart attacks among the sample group that took aspirin? Use α = 0.01.
Unlock Deck
Unlock for access to all 65 flashcards in this deck.
Unlock Deck
k this deck
10
To perform a hypothesis test of two population proportions, the pooled estimate of p must be determined. The pooled estimate, , is
A) =
B) = +
C) =
D) =
, isA)
= B)
= + C)
= D)
= Unlock Deck
Unlock for access to all 65 flashcards in this deck.
Unlock Deck
k this deck
11
Construct a 95% confidence interval for - . The sample statistics listed below are from independent samples.Sample statistics: = 50, = 35, and = 60, = 40
A) (-0.141, 0.208)
B) (-0.871, 0.872)
C) (-2.391, 3.112)
D) (-1.341, 1.781)
- . The sample statistics listed below are from independent samples.Sample statistics: = 50, = 35, and = 60, = 40A) (-0.141, 0.208)
B) (-0.871, 0.872)
C) (-2.391, 3.112)
D) (-1.341, 1.781)
Unlock Deck
Unlock for access to all 65 flashcards in this deck.
Unlock Deck
k this deck
12
Construct a 98% confidence interval for - . The sample statistics listed below are from independent samples.Sample statistics: = 1000, = 250, and = 1200, = 195
A) (0.581, 1.819)
B) (-0.621, 0.781)
C) (0.047, 0.128)
D) (1.516, 3.021)
- . The sample statistics listed below are from independent samples.Sample statistics: = 1000, = 250, and = 1200, = 195A) (0.581, 1.819)
B) (-0.621, 0.781)
C) (0.047, 0.128)
D) (1.516, 3.021)
Unlock Deck
Unlock for access to all 65 flashcards in this deck.
Unlock Deck
k this deck
13
Construct a 95% confidence interval for - for a survey that finds 30% of 240 males and 41% of 200 females are opposed to the death penalty.
A) (-1.532, 1.342)
B) (-0.561, 0.651)
C) (-0.200, -0.021)
D) (-1.324, 1.512)
- for a survey that finds 30% of 240 males and 41% of 200 females are opposed to the death penalty.A) (-1.532, 1.342)
B) (-0.561, 0.651)
C) (-0.200, -0.021)
D) (-1.324, 1.512)
Unlock Deck
Unlock for access to all 65 flashcards in this deck.
Unlock Deck
k this deck
14
To construct a confidence interval for the difference of two population proportions the samples must be independently obtained random samples, both must consist of less than 5% of the population, and
A) only one of (1 - ) ? 10 or (1 - ) ? 10 must be true.
B) (1- ) (1- )?100.
C) both (1 - ) ? 10 and (1 - ) ? 10 must be true.
D) (1- )+ (1- )?20.
A) only one of
(1 - ) ? 10 or (1 - ) ? 10 must be true.B)
(1- ) (1- )?100.C) both
(1 - ) ? 10 and (1 - ) ? 10 must be true.D)
(1- )+ (1- )?20. Unlock Deck
Unlock for access to all 65 flashcards in this deck.
Unlock Deck
k this deck
15
Two surgical procedures are widely used to treat a certain type of cancer. To compare the success rates of the two procedures, random samples of the two types of surgical patients were obtained and the numbers of patients who showed no recurrence of the disease after a 1-year period were recorded. The data are shown in the table. How large a sample would be necessary in order to estimate the difference in the true success rates to within 0.10 with 95% reliability?
A) = =37
B) = =27
C) = =192
D) = =54
A)
= =37B)
= =27C)
= =192D)
= =54 Unlock Deck
Unlock for access to all 65 flashcards in this deck.
Unlock Deck
k this deck
16
Data sets A and B are dependent. Find . Assume that the paired data came from a population that is normally distributed.
A) -5.1
B) 25.2
C) 33.1
D) 9.0
. Assume that the paired data came from a population that is normally distributed.A) -5.1
B) 25.2
C) 33.1
D) 9.0
Unlock Deck
Unlock for access to all 65 flashcards in this deck.
Unlock Deck
k this deck
17
Data sets A and B are dependent. Find . Assume that the paired data came from a population that is normally distributed.
A) -0.76
B) -0.94
C) 0.89
D) 0.58
. Assume that the paired data came from a population that is normally distributed.A) -0.76
B) -0.94
C) 0.89
D) 0.58
Unlock Deck
Unlock for access to all 65 flashcards in this deck.
Unlock Deck
k this deck
18
Data sets A and B are dependent. Find . Assume that the paired data came from a population that is normally distributed.
A) 5.6
B) 8.9
C) 7.8
D) 6.8
. Assume that the paired data came from a population that is normally distributed.A) 5.6
B) 8.9
C) 7.8
D) 6.8
Unlock Deck
Unlock for access to all 65 flashcards in this deck.
Unlock Deck
k this deck
19
Data sets A and B are dependent. Find . Assume that the paired data came from a population that is normally distributed.
A) 1.73
B) 1.21
C) 1.89
D) 1.32
. Assume that the paired data came from a population that is normally distributed.A) 1.73
B) 1.21
C) 1.89
D) 1.32
Unlock Deck
Unlock for access to all 65 flashcards in this deck.
Unlock Deck
k this deck
20
Data sets A and B are dependent. Test the claim that = 0. Use α = 0.05. Assume that the paired data came from a population that is normally distributed.
= 0. Use α = 0.05. Assume that the paired data came from a population that is normally distributed. Unlock Deck
Unlock for access to all 65 flashcards in this deck.
Unlock Deck
k this deck
21
Data sets A and B are dependent. Test the claim that =0. Use α = 0.01. Assume that the paired data came from a population that is normally distributed.
=0. Use α = 0.01. Assume that the paired data came from a population that is normally distributed. Unlock Deck
Unlock for access to all 65 flashcards in this deck.
Unlock Deck
k this deck
22
Nine students took the SAT. Their scores are listed below. Later on, they read a book on test preparation and retook the SAT. Their new scores are listed below. Test the claim that the book had no effect on their scores. Use α = 0.05. Assume that the distribution is normally distributed.
Unlock Deck
Unlock for access to all 65 flashcards in this deck.
Unlock Deck
k this deck
23
A football coach claims that players can increase their strength by taking a certain supplement. To test the theory, the coach randomly selects 9 athletes and gives them a strength test using a bench press. The results are listed below. Thirty days later, after regular training using the supplement, they are tested again. The new results are listed below. Test the claim that the supplement is effective in increasing the athletes' strength. Use α = 0.05. Assume that the distribution is normally distributed.
Unlock Deck
Unlock for access to all 65 flashcards in this deck.
Unlock Deck
k this deck
24
A pharmaceutical company wishes to test a new drug with the expectation of lowering cholesterol levels. Ten subjects are randomly selected and pretested. The results are listed below. The subjects were placed on the drug for a period of 6 months, after which their cholesterol levels were tested again. The results are listed below. (All units are milligrams per deciliter.) Test the company's claim that the drug lowers cholesterol levels. Use α = 0.01. Assume that the distribution is normally distributed.
Unlock Deck
Unlock for access to all 65 flashcards in this deck.
Unlock Deck
k this deck
25
A local company is concerned about the number of days missed by its employees due to illness. A random sample of 10 employees is selected. The number of days absent in one year is listed below. An incentive program is offered in an attempt to decrease the number of days absent. The number of days absent in one year after the incentive program is listed below. Test the claim that the incentive program cuts down on the number of days missed by employees. Use α = 0.05. Assume that the distribution is normally distributed.
Unlock Deck
Unlock for access to all 65 flashcards in this deck.
Unlock Deck
k this deck
26
A physician claims that a person's diastolic blood pressure can be lowered if, instead of taking a drug, the person meditates each evening. Ten subjects are randomly selected and pretested. Their blood pressures, measured in millimeters of mercury, are listed below. The 10 patients are instructed in basic meditation and told to practice it each evening for one month. At the end of the month, their blood pressures are taken again. The data are listed below. Test the physician's claim. Use α = 0.01.
Unlock Deck
Unlock for access to all 65 flashcards in this deck.
Unlock Deck
k this deck
27
Construct a 95% confidence interval for data sets A and B. Data sets A and B are dependent. Assume that the paired data came from a population that is normally distributed.
A) (-0.696, 18.700)
B) (-15.341, 15.431)
C) (-0.113, 12.761)
D) (-1.324, 8.981)
Assume that the paired data came from a population that is normally distributed.A) (-0.696, 18.700)
B) (-15.341, 15.431)
C) (-0.113, 12.761)
D) (-1.324, 8.981)
Unlock Deck
Unlock for access to all 65 flashcards in this deck.
Unlock Deck
k this deck
28
Construct a 99% confidence interval for data sets A and B. Data sets A and B are dependent. Assume that the paired data came from a population that is normally distributed.
A) (-25.123, 5.761)
B) (-21.342, 18.982)
C) (-15.123, 15.123)
D) (-4.502, 2.622)
Assume that the paired data came from a population that is normally distributed.A) (-25.123, 5.761)
B) (-21.342, 18.982)
C) (-15.123, 15.123)
D) (-4.502, 2.622)
Unlock Deck
Unlock for access to all 65 flashcards in this deck.
Unlock Deck
k this deck
29
We are interested in comparing the average supermarket prices of two leading colas in the Tampa area. Our sample was taken by randomly going to each of eight supermarkets and recording the price of a six-pack of cola of each brand. The data are shown in the following table. Find a 98% confidence interval for the difference in mean price of brand 1 and brand 2. Assume that the paired data came from a population that is normally distributed.
A) (-0.0722, -0.0028)
B) (-0.1768, 0.1018)
C) (-0.0846, 0.0096)
D) (-0.0779, 0.0029)
A) (-0.0722, -0.0028)
B) (-0.1768, 0.1018)
C) (-0.0846, 0.0096)
D) (-0.0779, 0.0029)
Unlock Deck
Unlock for access to all 65 flashcards in this deck.
Unlock Deck
k this deck
30
A new weight-reducing technique, consisting of a liquid protein diet, is currently undergoing tests before its introduction into the market. A typical test performed is the following: The weights of a random sample of five people are recorded before they are introduced to the liquid protein diet. The five individuals are then instructed to follow the liquid protein diet for 3 weeks. At the end of this period, their weights (in pounds) are again recorded. The results are listed in the table. Let be the true mean weight of individuals before starting the diet and let be the true mean weight of individuals after 3 weeks on the diet. Calculate a 90% confidence interval for the difference between the mean weights before and after the diet is used. Assume that the paired data came from a population that is normally distributed.
be the true mean weight of individuals before starting the diet and let be the true mean weight of individuals after 3 weeks on the diet. Calculate a 90% confidence interval for the difference between the mean weights before and after the diet is used. Assume that the paired data came from a population that is normally distributed. Unlock Deck
Unlock for access to all 65 flashcards in this deck.
Unlock Deck
k this deck
31
Seven randomly selected plants that bottle the same beverage implemented a time management program in hopes of improving productivity. The average time, in minutes, that it took the companies to produce the same quantity of bottles before and after the program are listed below. Assume the two population distributions are normal. Construct a 90% confidence interval for . Assume that the paired data came from a population that is normally distributed.
A) (-22, 33.3)
B) (0.21, 10.93)
C) (1.60, 9.54)
D) (-0.22, 11.36)
. Assume that the paired data came from a population that is normally distributed. A) (-22, 33.3)
B) (0.21, 10.93)
C) (1.60, 9.54)
D) (-0.22, 11.36)
Unlock Deck
Unlock for access to all 65 flashcards in this deck.
Unlock Deck
k this deck
32
Find the test statistic, t, to test the hypothesis that = . Two samples are randomly selected and come from populations that are normal. The sample statistics are given below.
A) 2.892
B) 1.986
C) 4.361
D) 3.287
= . Two samples are randomly selected and come from populations that are normal. The sample statistics are given below. A) 2.892
B) 1.986
C) 4.361
D) 3.287
Unlock Deck
Unlock for access to all 65 flashcards in this deck.
Unlock Deck
k this deck
33
Find the test statistic, t, to test the hypothesis that = . Two samples are randomly selected and come from populations that are normal. The sample statistics are given below.
A) -0.954
B) -0.915
C) -0.909
D) -1.558
= . Two samples are randomly selected and come from populations that are normal. The sample statistics are given below. A) -0.954
B) -0.915
C) -0.909
D) -1.558
Unlock Deck
Unlock for access to all 65 flashcards in this deck.
Unlock Deck
k this deck
34
Find the test statistic, t, to test the hypothesis that > . Two samples are randomly selected and come from populations that are normal. The sample statistics are given below.
A) 1.865
B) 2.819
C) 1.282
D) 3.271
> . Two samples are randomly selected and come from populations that are normal. The sample statistics are given below. A) 1.865
B) 2.819
C) 1.282
D) 3.271
Unlock Deck
Unlock for access to all 65 flashcards in this deck.
Unlock Deck
k this deck
35
Find the test statistic, t, to test the hypothesis that < . Two samples are randomly selected and come from populations that are normal. The sample statistics are given below.
A) -2.450
B) -0.669
C) -1.667
D) -3.165
< . Two samples are randomly selected and come from populations that are normal. The sample statistics are given below. A) -2.450
B) -0.669
C) -1.667
D) -3.165
Unlock Deck
Unlock for access to all 65 flashcards in this deck.
Unlock Deck
k this deck
36
Find the test statistic, t, to test the hypothesis that ? . Two samples are randomly selected and come from populations that are normal. The sample statistics are given below.
A) -1.821
B) -2.123
C) -1.326
D) -1.546
? . Two samples are randomly selected and come from populations that are normal. The sample statistics are given below. A) -1.821
B) -2.123
C) -1.326
D) -1.546
Unlock Deck
Unlock for access to all 65 flashcards in this deck.
Unlock Deck
k this deck
37
Test the hypothesis that = . Two samples are randomly selected from normal populations. The sample statistics are given below. Use α = 0.05.
= . Two samples are randomly selected from normal populations. The sample statistics are given below. Use α = 0.05. Unlock Deck
Unlock for access to all 65 flashcards in this deck.
Unlock Deck
k this deck
38
Test the hypothesis that = . Two samples are randomly selected from normal populations. The sample statistics are given below. Use α = 0.05.
= . Two samples are randomly selected from normal populations. The sample statistics are given below. Use α = 0.05. Unlock Deck
Unlock for access to all 65 flashcards in this deck.
Unlock Deck
k this deck
39
Test the hypothesis that > . Two samples are randomly selected from normal populations. The sample statistics are given below. Use α = 0.005.
> . Two samples are randomly selected from normal populations. The sample statistics are given below. Use α = 0.005. Unlock Deck
Unlock for access to all 65 flashcards in this deck.
Unlock Deck
k this deck
40
Test the hypothesis that < . Two samples are randomly selected from normal populations. The sample statistics are given below. Use α = 0.05.
< . Two samples are randomly selected from normal populations. The sample statistics are given below. Use α = 0.05. Unlock Deck
Unlock for access to all 65 flashcards in this deck.
Unlock Deck
k this deck
41
Test the hypothesis that ≠ . Two samples are randomly selected from normal populations. The sample statistics are given below. Use α = 0.01.
≠ . Two samples are randomly selected from normal populations. The sample statistics are given below. Use α = 0.01. Unlock Deck
Unlock for access to all 65 flashcards in this deck.
Unlock Deck
k this deck
42
Find the test statistic to test the hypothesis that = . Two samples are randomly selected from each population. The sample statistics are given below. Use ? = 0.05.
A) 8.1
B) 3.8
C) 4.2
D) 6.2
= . Two samples are randomly selected from each population. The sample statistics are given below. Use ? = 0.05. A) 8.1
B) 3.8
C) 4.2
D) 6.2
Unlock Deck
Unlock for access to all 65 flashcards in this deck.
Unlock Deck
k this deck
43
Find the test statistic to test the hypothesis that = . Two samples are randomly selected from each population. The sample statistics are given below. Use ? = 0.05.
A) -2.6
B) -0.8
C) -1.0
D) -1.6
= . Two samples are randomly selected from each population. The sample statistics are given below. Use ? = 0.05. A) -2.6
B) -0.8
C) -1.0
D) -1.6
Unlock Deck
Unlock for access to all 65 flashcards in this deck.
Unlock Deck
k this deck
44
Find the test statistic to test the hypothesis that > . Two samples are randomly selected from each population. The sample statistics are given below. Use ? = 0.05.
A) 2.81
B) 1.86
C) 2.98
D) 0.91
> . Two samples are randomly selected from each population. The sample statistics are given below. Use ? = 0.05. A) 2.81
B) 1.86
C) 2.98
D) 0.91
Unlock Deck
Unlock for access to all 65 flashcards in this deck.
Unlock Deck
k this deck
45
Find the test statistic to test the hypothesis that < . Two samples are randomly selected from each population. The sample statistics are given below. Use ? = 0.05.
A) -3.90
B) -3.16
C) -1.66
D) -2.63
< . Two samples are randomly selected from each population. The sample statistics are given below. Use ? = 0.05. A) -3.90
B) -3.16
C) -1.66
D) -2.63
Unlock Deck
Unlock for access to all 65 flashcards in this deck.
Unlock Deck
k this deck
46
Find the test statistic to test the hypothesis that ? . Two samples are randomly selected from each population. The sample statistics are given below. Use ? = 0.02.
A) -2.32
B) -2.97
C) -2.12
D) -1.82
? . Two samples are randomly selected from each population. The sample statistics are given below. Use ? = 0.02. A) -2.32
B) -2.97
C) -2.12
D) -1.82
Unlock Deck
Unlock for access to all 65 flashcards in this deck.
Unlock Deck
k this deck
47
Test the hypothesis that = . Two samples are randomly selected from each population. The sample statistics are given below. Use α = 0.05.
= . Two samples are randomly selected from each population. The sample statistics are given below. Use α = 0.05. Unlock Deck
Unlock for access to all 65 flashcards in this deck.
Unlock Deck
k this deck
48
Test the hypothesis that > . Two samples are randomly selected from each population. The sample statistics are given below. Use α = 0.01.
> . Two samples are randomly selected from each population. The sample statistics are given below. Use α = 0.01. Unlock Deck
Unlock for access to all 65 flashcards in this deck.
Unlock Deck
k this deck
49
Test the hypothesis that < . Two samples are randomly selected from each population. The sample statistics are given below. Use α = 0.05.
< . Two samples are randomly selected from each population. The sample statistics are given below. Use α = 0.05. Unlock Deck
Unlock for access to all 65 flashcards in this deck.
Unlock Deck
k this deck
50
Test the hypothesis that ≠ . Two samples are randomly selected from each population. The sample statistics are given below. Use α = 0.02.
≠ . Two samples are randomly selected from each population. The sample statistics are given below. Use α = 0.02. Unlock Deck
Unlock for access to all 65 flashcards in this deck.
Unlock Deck
k this deck
51
A university wanted to see whether there was a significant difference in age between its day staff and evening staff. A random sample of 35 staff members is selected from each group. The data are given below. Test the hypothesis that there is no difference in age between the two groups. Use α = 0.05.
Unlock Deck
Unlock for access to all 65 flashcards in this deck.
Unlock Deck
k this deck
52
What is the for testing differences of the means of two independent samples?
A) : ?
B) : >
C) : <
D) : - =0
for testing differences of the means of two independent samples?A)
: ? B)
: > C)
: < D)
: - =0 Unlock Deck
Unlock for access to all 65 flashcards in this deck.
Unlock Deck
k this deck
53
The degrees of freedom used when testing two independent samples where the population standard deviation is unknown is
A) + -2.
B) + -1.
C) the larger of - 1 or - 1.
D) the smaller of - 1 or - 1.
A)
+ -2.B)
+ -1.C) the larger of
- 1 or - 1.D) the smaller of
- 1 or - 1. Unlock Deck
Unlock for access to all 65 flashcards in this deck.
Unlock Deck
k this deck
54
Construct a 95% confidence interval for - . Two samples are randomly selected from normal populations. The sample statistics are given below.
A) (1.554, 3.651)
B) (1.413, 3.124)
C) (0.360, 3.640)
D) (1.335, 3.012)
- . Two samples are randomly selected from normal populations. The sample statistics are given below. A) (1.554, 3.651)
B) (1.413, 3.124)
C) (0.360, 3.640)
D) (1.335, 3.012)
Unlock Deck
Unlock for access to all 65 flashcards in this deck.
Unlock Deck
k this deck
55
Construct a 95% confidence interval for - . Two samples are randomly selected from normal populations. The sample statistics are given below.
A) (-2.762, 2.762)
B) (-1.762, 1.762)
C) (-4.152, 3.981)
D) (-0.977, 0.177)
- . Two samples are randomly selected from normal populations. The sample statistics are given below. A) (-2.762, 2.762)
B) (-1.762, 1.762)
C) (-4.152, 3.981)
D) (-0.977, 0.177)
Unlock Deck
Unlock for access to all 65 flashcards in this deck.
Unlock Deck
k this deck
56
Construct a 95% confidence interval for - . Two samples are randomly selected from normal populations. The sample statistics are given below.
A) (-1.679, 1.987)
B) (-3.813, 1.013)
C) (-1.132, 1.543)
D) (2.112, 2.113)
- . Two samples are randomly selected from normal populations. The sample statistics are given below. A) (-1.679, 1.987)
B) (-3.813, 1.013)
C) (-1.132, 1.543)
D) (2.112, 2.113)
Unlock Deck
Unlock for access to all 65 flashcards in this deck.
Unlock Deck
k this deck
57
Construct a 95% confidence interval for - . Two samples are randomly selected from each population. The sample statistics are given below.
A) (1.572, 2.987)
B) (1.919, 3.142)
C) (1.364, 2.636)
D) (1.723, 3.012)
- . Two samples are randomly selected from each population. The sample statistics are given below. A) (1.572, 2.987)
B) (1.919, 3.142)
C) (1.364, 2.636)
D) (1.723, 3.012)
Unlock Deck
Unlock for access to all 65 flashcards in this deck.
Unlock Deck
k this deck
58
Construct a 95% confidence interval for - . Two samples are randomly selected from each population. The sample statistics are given below.
A) (-2.001, -1.873)
B) (-2.209, 0.209)
C) (-1.673, 1.892)
D) (-1.968, 1.561)
- . Two samples are randomly selected from each population. The sample statistics are given below. A) (-2.001, -1.873)
B) (-2.209, 0.209)
C) (-1.673, 1.892)
D) (-1.968, 1.561)
Unlock Deck
Unlock for access to all 65 flashcards in this deck.
Unlock Deck
k this deck
59
A researcher wishes to determine whether people with high blood pressure can lower their blood pressure by performing yoga exercises. A treatment group and a control group are selected. The sample statistics are given below. Construct a 90% confidence interval for the difference between the two population means, Would you recommend using yoga exercises? Explain your reasoning.
Would you recommend using yoga exercises? Explain your reasoning. Unlock Deck
Unlock for access to all 65 flashcards in this deck.
Unlock Deck
k this deck
60
Perform the appropriate hypothesis test.
-A random sample of individuals results in successes. An independent sample of individuals results in successes. Does this represent sufficient evidence to conclude that at the α = 0.01 level of significance?
-A random sample of
individuals results in successes. An independent sample of individuals results in successes. Does this represent sufficient evidence to conclude that at the α = 0.01 level of significance? Unlock Deck
Unlock for access to all 65 flashcards in this deck.
Unlock Deck
k this deck
61
Perform the appropriate hypothesis test.
-A random sample of individuals results in successes. An independent sample of individuals results in successes. Does this represent sufficient evidence to conclude that at the α = 0.05 level of significance?
-A random sample of
individuals results in successes. An independent sample of individuals results in successes. Does this represent sufficient evidence to conclude that at the α = 0.05 level of significance? Unlock Deck
Unlock for access to all 65 flashcards in this deck.
Unlock Deck
k this deck
62
Perform the appropriate hypothesis test.
-The table below shows the weights, in pounds, of seven subjects before and after following a particular diet program for three months. Does the sample evidence suggest that the diet program is effective in reducing weight? Use the level of significance. Assume that the differenced data come from a population that is normally distributed with no outliers.
-The table below shows the weights, in pounds, of seven subjects before and after following a particular diet program for three months. Does the sample evidence suggest that the diet program is effective in reducing weight? Use the
level of significance. Assume that the differenced data come from a population that is normally distributed with no outliers. Unlock Deck
Unlock for access to all 65 flashcards in this deck.
Unlock Deck
k this deck
63
Perform the appropriate hypothesis test.
-The data represent the measure of a variable before and after a treatment. Does the sample evidence suggest that the treatment is effective in increasing the value of the response variable? Use the α = 0.01 level of significance. Assume that the differenced data come from a population that is normally distributed with no outliers.
-The data represent the measure of a variable before and after a treatment. Does the sample evidence suggest that the treatment is effective in increasing the value of the response variable? Use the α = 0.01 level of significance. Assume that the differenced data come from a population that is normally distributed with no outliers.
Unlock Deck
Unlock for access to all 65 flashcards in this deck.
Unlock Deck
k this deck
64
Perform the appropriate hypothesis test.
-A random sample of 100 male employees of a retail store results in a mean monthly salary of $ 720 with a standard deviation of $44. An independent random sample of 125 female employees of the same store results in a mean monthly salary of $ 705 with a standard deviation of $25. Does this constitute sufficient evidence to conclude that the mean monthly salary for male employees of the store is higher than the mean monthly salary for female employees of the store? Use the α = 0.01 level of significance.
-A random sample of 100 male employees of a retail store results in a mean monthly salary of $ 720 with a standard deviation of $44. An independent random sample of 125 female employees of the same store results in a mean monthly salary of $ 705 with a standard deviation of $25. Does this constitute sufficient evidence to conclude that the mean monthly salary for male employees of the store is higher than the mean monthly salary for female employees of the store? Use the α = 0.01 level of significance.
Unlock Deck
Unlock for access to all 65 flashcards in this deck.
Unlock Deck
k this deck
65
Perform the appropriate hypothesis test.
-A random samples of 8 apples of variety A and an independent random sample of 13 apples of variety B yielded the following weights in ounces. Do the data provide sufficient evidence to conclude that the mean weight of apples of variety A differs from the mean weight of apples of variety B? Use the α = 0.10 level of significance. Assume that the sample data come from normally distributed populations with no outliers.
-A random samples of 8 apples of variety A and an independent random sample of 13 apples of variety B yielded the following weights in ounces. Do the data provide sufficient evidence to conclude that the mean weight of apples of variety A differs from the mean weight of apples of variety B? Use the α = 0.10 level of significance. Assume that the sample data come from normally distributed populations with no outliers.
Unlock Deck
Unlock for access to all 65 flashcards in this deck.
Unlock Deck
k this deck
Unlock Deck
Unlock for access to all 65 flashcards in this deck.


