Exam 11: Inference on Two Samples
Exam 1: Data Collection34 Questions
Exam 2: Organizing and Summarizing Data30 Questions
Exam 3: Numerically Summarizing Data66 Questions
Exam 4: Describing the Relation Between Two Variables92 Questions
Exam 5: Probability91 Questions
Exam 6: Discrete Probability Distributions32 Questions
Exam 7: The Normal Probability Distributions36 Questions
Exam 8: Sampling Distributions12 Questions
Exam 9: Estimating the Value of a Parameter Using Confidence Intervals24 Questions
Exam 10: Hypothesis Tests Regarding a Parameter36 Questions
Exam 11: Inference on Two Samples65 Questions
Exam 12: Inference on Categorical Data16 Questions
Exam 13: Comparing Three or More Means15 Questions
Exam 14: Inference of the Least-Squares Regression Model28 Questions
Select questions type
Test the hypothesis that  >
>  . Two samples are randomly selected from each population. The sample statistics are given below. Use α = 0.01.
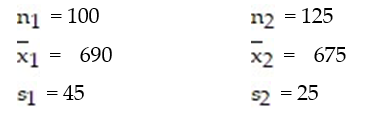
Free
(Essay)
4.9/5  (33)
(33)
Correct Answer: Verified
test statistic ≈ 2.99; 0.001 < P-value < 0.0025; reject  ; There is sufficient evidence to support the hypothesis.
Find the test statistic, t, to test the hypothesis that  =
=  . Two samples are randomly selected and come from populations that are normal. The sample statistics are given below.
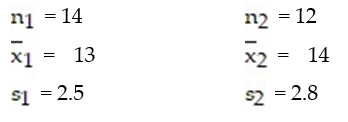
Free
(Multiple Choice)
4.9/5 (34)
Correct Answer:Verified
A
Data sets A and B are dependent. Find  .
. 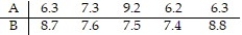 Assume that the paired data came from a population that is normally distributed.
Free
(Multiple Choice)
4.7/5 (29)
Correct Answer:Verified
A
Construct a 95% confidence interval for  -
-  . The sample statistics listed below are from independent samples.Sample statistics:
  = 50,
= 50,  = 35, and
  = 60,
= 60,  = 40
= 40
(Multiple Choice)
4.8/5 (32)
Data sets A and B are dependent. Find  .
. 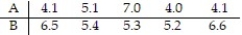 Assume that the paired data came from a population that is normally distributed.
(Multiple Choice)
4.8/5 (34)
Perform the appropriate hypothesis test.
-The data represent the measure of a variable before and after a treatment. Does the sample evidence suggest that the treatment is effective in increasing the value of the response variable? Use the α = 0.01 level of significance. Assume that the differenced data come from a population that is normally distributed with no outliers. 
(Essay)
4.8/5 (37)
Two surgical procedures are widely used to treat a certain type of cancer. To compare the success rates of the two procedures, random samples of the two types of surgical patients were obtained and the numbers of patients who showed no recurrence of the disease after a 1-year period were recorded. The data are shown in the table. How large a sample would be necessary in order to estimate the difference in the true success rates to within 0.10 with 95% reliability? 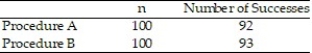
(Multiple Choice)
4.8/5 (30)
Find the test statistic, z, to test the hypothesis that  ?
?  . Use ? = 0.02. The sample statistics listed below are from independent samples.Sample statistics:
  = 1000,
  = 250, and
  = 1200,
  = 195
= 195
(Multiple Choice)
4.8/5 (34)
Test the hypothesis that  <
<  . Two samples are randomly selected from normal populations. The sample statistics are given below. Use α = 0.05.
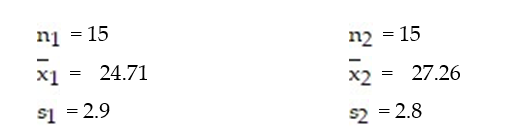
(Essay)
4.9/5 (35)
A researcher wishes to determine whether people with high blood pressure can lower their blood pressure by performing yoga exercises. A treatment group and a control group are selected. The sample statistics are given below. Construct a 90% confidence interval for the difference between the two population means,  Would you recommend using yoga exercises? Explain your reasoning.
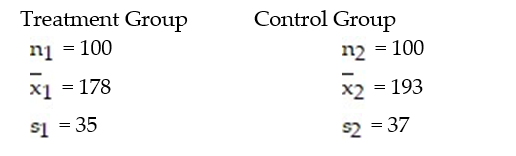
(Essay)
4.8/5 (28)
Find the test statistic to test the hypothesis that  <
<  . Two samples are randomly selected from each population. The sample statistics are given below. Use ? = 0.05.
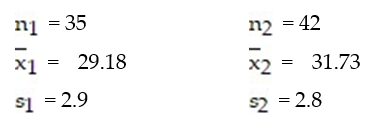
(Multiple Choice)
4.9/5 (37)
Test the hypothesis that  ≠
≠  . Use α = 0.02. The sample statistics listed below are from independent samples.Sample statistics:
  = 1000,
  = 250, and
  = 1200,
  = 195.
(Essay)
4.8/5 (34)
The degrees of freedom used when testing two independent samples where the population standard deviation is unknown is
(Multiple Choice)
4.8/5 (31)
Construct a 95% confidence interval for  -
-  . Two samples are randomly selected from each population. The sample statistics are given below.
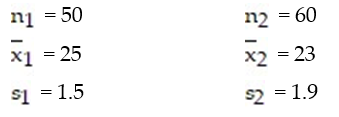
(Multiple Choice)
4.9/5 (30)
Construct a 95% confidence interval for  -
-  . Two samples are randomly selected from each population. The sample statistics are given below.
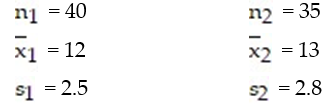
(Multiple Choice)
4.9/5 (46)
Find the test statistic to test the hypothesis that  ?
?  . Two samples are randomly selected from each population. The sample statistics are given below. Use ? = 0.02.
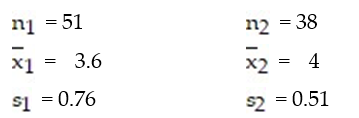
(Multiple Choice)
4.9/5 (29)
Find the test statistic to test the hypothesis that  >
>  . Two samples are randomly selected from each population. The sample statistics are given below. Use ? = 0.05.
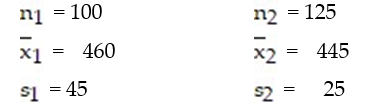
(Multiple Choice)
4.8/5 (32)
Construct a 95% confidence interval for  -
-  for a survey that finds 30% of 240 males and 41% of 200 females are opposed to the death penalty.
(Multiple Choice)
4.9/5 (39)
Nine students took the SAT. Their scores are listed below. Later on, they read a book on test preparation and retook the SAT. Their new scores are listed below. Test the claim that the book had no effect on their scores. Use α = 0.05. Assume that the distribution is normally distributed. 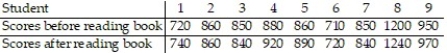
(Essay)
4.8/5 (42)
Construct a 99% confidence interval for data sets A and B. Data sets A and B are dependent. 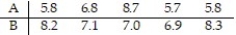 Assume that the paired data came from a population that is normally distributed.
(Multiple Choice)
4.9/5 (33)
Filters
- Essay(0)
- Multiple Choice(0)
- Short Answer(0)
- True False(0)
- Matching(0)