Deck 4: Exponential Functions
Full screen (f)
Question
An investment grows according to the formula  . How many years will it take for the original investment to quadruple? Round to 1 decimal place.
. How many years will it take for the original investment to quadruple? Round to 1 decimal place. Question
The price of an item increases due to inflation. Let  give the price of the item as a function of time in years, with t = 0 in 2004. At what continuous annual rate is the price increasing? Round to 2 decimal places.
give the price of the item as a function of time in years, with t = 0 in 2004. At what continuous annual rate is the price increasing? Round to 2 decimal places. Question
Is the formula for a function representing a quantity which begins at N in year t = 0 and grows at a constant annual rate of r% given by  ?
?
? Question
Is the formula for a function representing a quantity which begins at 2N in year t = 0 and grows at a continuous annual rate of r% given by  ?
?
? Question
Is the formula for a function representing a quantity which begins at an amount 35% larger than N in year t = 0 and grows at a continuous annual rate of r% given by 
?
?
Question
Is the formula for a function representing a quantity which begins at N in year t = 0 and grows at a continuous annual rate of  % given by
  ?
?
% given by ? Question
Let  give the size of a population of animals in year t. What will the population be after 19 years? Round to the nearest whole number.
give the size of a population of animals in year t. What will the population be after 19 years? Round to the nearest whole number. Question
Let  give the size of a population of animals in year t. After how many years will the population be approximately 770?
give the size of a population of animals in year t. After how many years will the population be approximately 770? Question
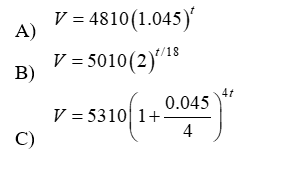
The US population in 2005 was approximately 296.4 million. Assume the population increases at a rate of 1.32% per year. What is the formula for
 , the population for the United States t years after 2005?
A)
B)
C)
D)
, the population for the United States t years after 2005?A)
B)
C)
D)
Question
The figure below shows the graphs of the following functions:
(A)

(B)

(C)

(D)

 Which one is the graph of D?
(A)
(B)
(C)
(D)
Which one is the graph of D? Question
 ?
? Question
 ?
? Question
 ?
? Question
Which of the following is correctly ordered from least to greatest?
A)
B)
C)
D)
E)
F)
A)
B)
C)
D)
E)
F)
Question
Question
Question
 ?
? Question
Question
Without a calculator, graph the following on the same set of axes:
A)
B)
C)
A)
B)
C)
Question
Which of the following quantities 
Are increasing with time t ?
A)
B)
C)
D)
Are increasing with time t ?
A)
B)
C)
D)
Question
Question
Question
Question
Question
Question
Question
Use the formula 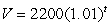 to answer the following questions about the investment it describes. Units are dollars and years.
A) Is the investment increasing or decreasing?
B) What is the initial value of the investment?
C) What is the effective annual rate of the account?
to answer the following questions about the investment it describes. Units are dollars and years.A) Is the investment increasing or decreasing?
B) What is the initial value of the investment?
C) What is the effective annual rate of the account?
Question
A radioactive substance decays by 11% every year. Which of the following is the formula for the quantity,  , of a 20 gram sample remaining after
 years?
A)
B)
C)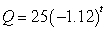
D)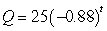
, of a 20 gram sample remaining after years?A)
B)
C)
D)
Question
The amount of pollution in a harbor t hours after it was contaminated by illegal dumping is given by  tons. What percentage of the pollution leaves the harbor each hour?
tons. What percentage of the pollution leaves the harbor each hour? Question
Question
Question
Question
Question
Question
Question
Question
Question
Question
Question
Question
Question
Write a verbal description for each of the following formulas. The units are dollars and years.
Question
The price of an item increases due to inflation. Let 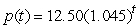 Give the price of the item as a function of time in years, with t = 0 in 2004. What is the practical interpretation of
  ?
?
A) The price in 2004 of an item that is $75 now.
B) The price now of an item that was $75 in 2004.
C) The time at which the price reaches $75.
D) The price of the item after 75 years.
Give the price of the item as a function of time in years, with t = 0 in 2004. What is the practical interpretation of ?A) The price in 2004 of an item that is $75 now.
B) The price now of an item that was $75 in 2004.
C) The time at which the price reaches $75.
D) The price of the item after 75 years.
Question
The price of an item increases due to inflation. Let 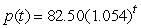 be the price of the item as a function of time in years, with t = 0 in 2004. What is the daily inflation rate? Round to 2 decimal places.
be the price of the item as a function of time in years, with t = 0 in 2004. What is the daily inflation rate? Round to 2 decimal places. Question
Question
Question
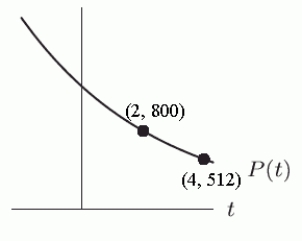
The graph of the exponential function  is shown below. The formula for
  must be
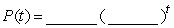
.
is shown below. The formula for must be .
Question
The graph of the exponential function  Is shown below. Suppose
  Represents a city's population, in thousands, t years after 1995. Which of the following quantities are equivalent?
A)
B) Approximately -295 thousand
C) Approximately 705 thousand
D) The change in the city's population between 1996 and 2000
E)
F) The rate at which the population is declining between 1996 and 2000
Is shown below. Suppose Represents a city's population, in thousands, t years after 1995. Which of the following quantities are equivalent?A)
B) Approximately -295 thousand
C) Approximately 705 thousand
D) The change in the city's population between 1996 and 2000
E)
F) The rate at which the population is declining between 1996 and 2000
Question
Question
Question
Question
In the following figure, the functions f, g, h, and p can all be written in the form  . Which one has the smallest value for b?
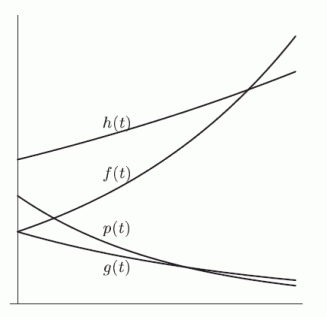
. Which one has the smallest value for b? Question
Solve  graphically for x if y = 13. Round to 1 decimal place.
graphically for x if y = 13. Round to 1 decimal place. Question
The price of an item increases due to inflation. Let 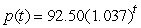 give the price of the item as a function of time in years, with t = 0 in 2004. Estimate
  to 2 decimal places.
give the price of the item as a function of time in years, with t = 0 in 2004. Estimate to 2 decimal places. Question
Question
The population of a city is increasing exponentially. In 2000, the city had a population of 60,000. In 2005, the population was 83,748. Let  be the population of the town t years after 2000. Use a graph of
  to estimate the year in which the population will reach 250,000.
be the population of the town t years after 2000. Use a graph of to estimate the year in which the population will reach 250,000. Question
The following figure gives the graph of  , where C is the computer hard disk capacity (in hundreds of megabytes) that could be bought for $500 t years past 1989. If the trend displayed in the graph continued, how many megabytes would a $500 hard drive have in 1999? Round to the nearest hundred.

, where C is the computer hard disk capacity (in hundreds of megabytes) that could be bought for $500 t years past 1989. If the trend displayed in the graph continued, how many megabytes would a $500 hard drive have in 1999? Round to the nearest hundred. Question
The following figure gives the graph of  , where C is the computer hard disk capacity (in hundreds of megabytes) that could be bought for $500 t years past 1989. If the trend displayed in the graph continued, in what year would the capacity that can be bought for $500 be 9700?
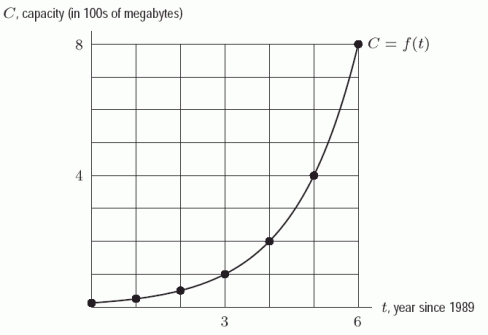
, where C is the computer hard disk capacity (in hundreds of megabytes) that could be bought for $500 t years past 1989. If the trend displayed in the graph continued, in what year would the capacity that can be bought for $500 be 9700? Question
Which of the following characteristics describe the graph of  ?
?
A) It is concave down.
B) It is concave up.
C) It crosses the y-axis at 1.
D)
E)
F)
G)
?A) It is concave down.
B) It is concave up.
C) It crosses the y-axis at 1.
D)
E)
F)
G)
Question
The amount of pollution in a harbor t hours after it was contaminated by illegal dumping is given by  tons. After how many hours is there less than 23 tons of pollution in the harbor? Round to 1 decimal place.
tons. After how many hours is there less than 23 tons of pollution in the harbor? Round to 1 decimal place. Question
What is the horizontal asymptote of 
A) y = 0.85
B) y = 25
C) y = 0
D) There isn't one
A) y = 0.85
B) y = 25
C) y = 0
D) There isn't one
Question
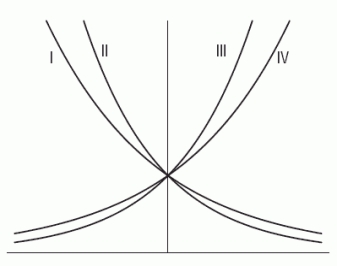
Consider the following figure, where Graph I has equation  , Graph II has equation
  , Graph III has equation
  , and Graph IV has equation
  .
.
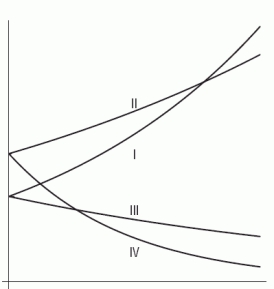 Is
Is  positive or negative?
, Graph II has equation , Graph III has equation , and Graph IV has equation . Is positive or negative? Question
Let  be the intersection of the graphs of the two exponential functions
  and
and  , where
  . If b is decreased, does
  increase, decrease, or stay the same?
be the intersection of the graphs of the two exponential functions and , where . If b is decreased, does increase, decrease, or stay the same? Question
Let  be the intersection of the graphs of the two exponential functions
  and
and  , where
  . If s is decreased, does
  increase, decrease, or stay the same?
be the intersection of the graphs of the two exponential functions and , where . If s is decreased, does increase, decrease, or stay the same? Question
Assume that all important features are shown in the following graph of  . What is
  ? For
? For  or
or  , enter "inf" or "-inf".
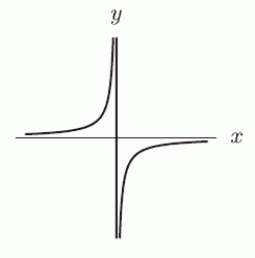
. What is ? For or , enter "inf" or "-inf". Question
The graph of  has a horizontal asymptote at
  . (If there is no horizontal asymptote, enter "DNE".)
has a horizontal asymptote at . (If there is no horizontal asymptote, enter "DNE".) Question
Which of the following formulas are exponential?
A)
B)
C)
D)
E)
F)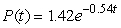
G)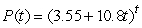
A)
B)
C)
D)
E)
F)
G)
Question
Question
The following table gives values from an exponential or a linear function. Determine which, and find values for a and b so that  if the function is linear, or
  if the function is exponential.
a = ______, b = ______.

if the function is linear, or if the function is exponential.a = ______, b = ______.
Question
The table below shows v, the dollar value of a share of a certain stock, as a function of t, the time (in weeks) since the initial offering of the stock. A possible formula for  is
is 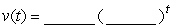 . Round the second answer to 3 decimal places.
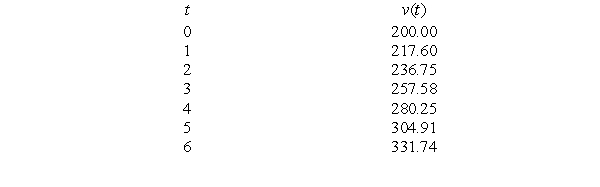
is . Round the second answer to 3 decimal places. Question
A population has size 2300 at time t = 0, with t in years. If the population grows by 90 people per year, what is the formula for P, the population at time t?
A)
B)
C)
D)
A)
B)
C)
D)
Question
A population has size 4900 at time t = 0, with t in years. If the population grows by 15% per year, what is the formula for P, the population at time t?
A)
B)
C)
D)
A)
B)
C)
D)
Question
The graph below shows the quantity of a drug in a patient's bloodstream over a period of time t, in minutes.
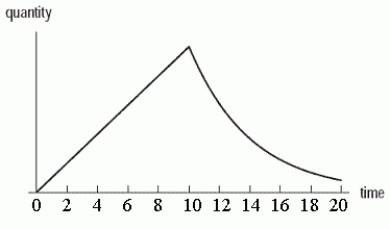 Which of the following scenarios best describes the graph?
A) The drug is injected over a 10 minute interval, during which the quantity increases linearly. After the 10 minutes, the injection is discontinued and the quantity then decays exponentially.
B) The drug is injected over a 10 minute interval, during which the quantity increases exponentially. After the 10 minutes, the injection is discontinued and the quantity then decays linearly.
C) The drug is injected all at once. The quantity first increases and then decreases linearly.
D) The drug is injected all at once. The quantity first increases and then decreases exponentially.
Which of the following scenarios best describes the graph?A) The drug is injected over a 10 minute interval, during which the quantity increases linearly. After the 10 minutes, the injection is discontinued and the quantity then decays exponentially.
B) The drug is injected over a 10 minute interval, during which the quantity increases exponentially. After the 10 minutes, the injection is discontinued and the quantity then decays linearly.
C) The drug is injected all at once. The quantity first increases and then decreases linearly.
D) The drug is injected all at once. The quantity first increases and then decreases exponentially.
Question
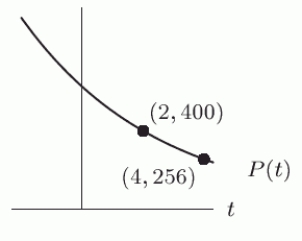
Kevin buys a new CD player for $190, and finds two years later when he wants to sell it that it is only worth $45. Assuming the value of the CD player decreases exponentially, the formula for  , the value of the CD player after t years, is given by
  . Round your second answer to 2 decimal places.
, the value of the CD player after t years, is given by . Round your second answer to 2 decimal places. Question
Question
A biologist measures the amount of contaminant in a lake 5 hours after a chemical spill and again 8 hours after the spill. She sets up two possible models to determine Q, the amount of the chemical remaining in the lake as a function of t, the time in hours since the spill. The first model assumes the contaminant is leaving the lake at a constant rate, which she determines to be 3 tons/hour. Using this model, she estimates that the lake will be free from the contaminant 30 hours after the spill. Thus,  and
and  . The second model assumes that the amount of contaminant decreases exponentially. In this model, she finds that
  . Round both answers to 3 decimal places.
and . The second model assumes that the amount of contaminant decreases exponentially. In this model, she finds that . Round both answers to 3 decimal places. Question
Question


Question


Question
The following figure shows two functions, one linear and the other exponential. The formula for the linear one is  , and the formula for the exponential one is
 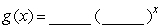 . Round the first two answers to 2 decimal places and the last two answers to 3 decimal places.
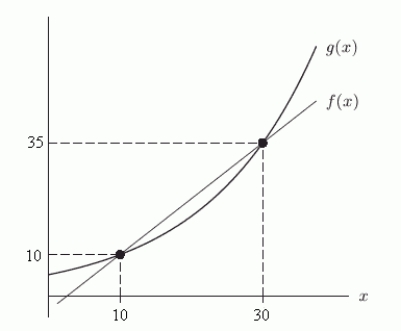
, and the formula for the exponential one is . Round the first two answers to 2 decimal places and the last two answers to 3 decimal places. 
Unlock Deck
Sign up to unlock the cards in this deck!
Unlock Deck
Unlock Deck
1/106
Play
Full screen (f)
Deck 4: Exponential Functions
1
An investment grows according to the formula . How many years will it take for the original investment to quadruple? Round to 1 decimal place.
. How many years will it take for the original investment to quadruple? Round to 1 decimal place.34.7
2
The price of an item increases due to inflation. Let give the price of the item as a function of time in years, with t = 0 in 2004. At what continuous annual rate is the price increasing? Round to 2 decimal places.
give the price of the item as a function of time in years, with t = 0 in 2004. At what continuous annual rate is the price increasing? Round to 2 decimal places.3.54%
3
Is the formula for a function representing a quantity which begins at N in year t = 0 and grows at a constant annual rate of r% given by ?
?False
4
Is the formula for a function representing a quantity which begins at 2N in year t = 0 and grows at a continuous annual rate of r% given by ?
? Unlock Deck
Unlock for access to all 106 flashcards in this deck.
Unlock Deck
k this deck
5
Is the formula for a function representing a quantity which begins at an amount 35% larger than N in year t = 0 and grows at a continuous annual rate of r% given by
?
?
Unlock Deck
Unlock for access to all 106 flashcards in this deck.
Unlock Deck
k this deck
6
Is the formula for a function representing a quantity which begins at N in year t = 0 and grows at a continuous annual rate of % given by ?
% given by ? Unlock Deck
Unlock for access to all 106 flashcards in this deck.
Unlock Deck
k this deck
7
Let give the size of a population of animals in year t. What will the population be after 19 years? Round to the nearest whole number.
give the size of a population of animals in year t. What will the population be after 19 years? Round to the nearest whole number. Unlock Deck
Unlock for access to all 106 flashcards in this deck.
Unlock Deck
k this deck
8
Let give the size of a population of animals in year t. After how many years will the population be approximately 770?
give the size of a population of animals in year t. After how many years will the population be approximately 770? Unlock Deck
Unlock for access to all 106 flashcards in this deck.
Unlock Deck
k this deck
9
The US population in 2005 was approximately 296.4 million. Assume the population increases at a rate of 1.32% per year. What is the formula for
, the population for the United States t years after 2005?
A)
B)
C)
D)
, the population for the United States t years after 2005?A)
B)
C)
D)
Unlock Deck
Unlock for access to all 106 flashcards in this deck.
Unlock Deck
k this deck
10
The figure below shows the graphs of the following functions:
(A)
(B)
(C)
(D)
Which one is the graph of D?
(A)
(B)
(C)
(D)
Which one is the graph of D? Unlock Deck
Unlock for access to all 106 flashcards in this deck.
Unlock Deck
k this deck
11
? Unlock Deck
Unlock for access to all 106 flashcards in this deck.
Unlock Deck
k this deck
12
? Unlock Deck
Unlock for access to all 106 flashcards in this deck.
Unlock Deck
k this deck
13
? Unlock Deck
Unlock for access to all 106 flashcards in this deck.
Unlock Deck
k this deck
14
Which of the following is correctly ordered from least to greatest?
A)
B)
C)
D)
E)
F)
A)
B)
C)
D)
E)
F)
Unlock Deck
Unlock for access to all 106 flashcards in this deck.
Unlock Deck
k this deck
15
Jeff has $20,000.He placed $10,000 in Bank 1 with an account earning 3.1% annual interest, compounded continuously. He also placed $10,000 in Bank 2 with an account earning 3.7% annual interest compounded weekly. After 10 years,
A) how much money is in Bank 1?
B) how much money is in Bank 2?
A) how much money is in Bank 1?
B) how much money is in Bank 2?
Unlock Deck
Unlock for access to all 106 flashcards in this deck.
Unlock Deck
k this deck
16
You invest $6000 in an account earning 2.5% annual interest, compounded continuously. After how many years is the investment worth $14,000? Round your answer to two decimal places, if necessary.
Unlock Deck
Unlock for access to all 106 flashcards in this deck.
Unlock Deck
k this deck
17
? Unlock Deck
Unlock for access to all 106 flashcards in this deck.
Unlock Deck
k this deck
18
An ant population grows at a continuous growth rate of 11.2%. If the population starts with 27,000 ants, how many ants are there after 6 months? Round your answer to the nearest ant.
Unlock Deck
Unlock for access to all 106 flashcards in this deck.
Unlock Deck
k this deck
19
Without a calculator, graph the following on the same set of axes:
A)
B)
C)
A)
B)
C)
Unlock Deck
Unlock for access to all 106 flashcards in this deck.
Unlock Deck
k this deck
20
Which of the following quantities
Are increasing with time t ?
A)
B)
C)
D)
Are increasing with time t ?
A)
B)
C)
D)
Unlock Deck
Unlock for access to all 106 flashcards in this deck.
Unlock Deck
k this deck
21
For an account paying 9% annual interest, compounded continuously, the nominal rate is _____ % and the effective rate is _____ %. Round to 3 decimal places.
Unlock Deck
Unlock for access to all 106 flashcards in this deck.
Unlock Deck
k this deck
22
What is the balance after 10 years in an account containing $600 that earns 4% interest compounded monthly? Round to the nearest cent.
Unlock Deck
Unlock for access to all 106 flashcards in this deck.
Unlock Deck
k this deck
23
Which bank has the best effective annual yield?
A)Bank 1 with a nominal rate of 6.45% compounded monthly.
B)Bank 2 with a nominal rate of 6.33% compounded weekly.
C)Bank 3 with a nominal rate of 6.6% compounded yearly.
A)Bank 1 with a nominal rate of 6.45% compounded monthly.
B)Bank 2 with a nominal rate of 6.33% compounded weekly.
C)Bank 3 with a nominal rate of 6.6% compounded yearly.
Unlock Deck
Unlock for access to all 106 flashcards in this deck.
Unlock Deck
k this deck
24
What is the maximum effective annual yield among the following three banks? Give your answer correct to four decimal places.
A)Bank 1 with a nominal rate of 6.5% compounded monthly.
B)Bank 2 with a nominal rate of 6.35% compounded weekly.
C)Bank 3 with a nominal rate of 6.55% compounded yearly.
A)Bank 1 with a nominal rate of 6.5% compounded monthly.
B)Bank 2 with a nominal rate of 6.35% compounded weekly.
C)Bank 3 with a nominal rate of 6.55% compounded yearly.
Unlock Deck
Unlock for access to all 106 flashcards in this deck.
Unlock Deck
k this deck
25
You place $10,000 in an account. You hope to have $22,000 in the account after 15 years. What effective annual yield is needed to accomplish this? Give your answer correct to four decimal places.
Unlock Deck
Unlock for access to all 106 flashcards in this deck.
Unlock Deck
k this deck
26
Suppose you would like to have $20,000 in 10 years. What is the minimum amount you need to deposit into a bank account earning 3% compounded weekly to reach this goal?
Unlock Deck
Unlock for access to all 106 flashcards in this deck.
Unlock Deck
k this deck
27
Use the formula to answer the following questions about the investment it describes. Units are dollars and years.
A) Is the investment increasing or decreasing?
B) What is the initial value of the investment?
C) What is the effective annual rate of the account?
to answer the following questions about the investment it describes. Units are dollars and years.A) Is the investment increasing or decreasing?
B) What is the initial value of the investment?
C) What is the effective annual rate of the account?
Unlock Deck
Unlock for access to all 106 flashcards in this deck.
Unlock Deck
k this deck
28
A radioactive substance decays by 11% every year. Which of the following is the formula for the quantity, , of a 20 gram sample remaining after
years?
A)
B)
C)
D)
, of a 20 gram sample remaining after years?A)
B)
C)
D)
Unlock Deck
Unlock for access to all 106 flashcards in this deck.
Unlock Deck
k this deck
29
The amount of pollution in a harbor t hours after it was contaminated by illegal dumping is given by tons. What percentage of the pollution leaves the harbor each hour?
tons. What percentage of the pollution leaves the harbor each hour? Unlock Deck
Unlock for access to all 106 flashcards in this deck.
Unlock Deck
k this deck
30
Write a formula that gives the value in an account after t years. Assume that the initial value in the account is $1200 and that the account doubles in value every 8 years.
Unlock Deck
Unlock for access to all 106 flashcards in this deck.
Unlock Deck
k this deck
31
Write a formula that gives the value of an investment which is initially worth $125,000 and loses value at a rate of 2.9% per year.
Unlock Deck
Unlock for access to all 106 flashcards in this deck.
Unlock Deck
k this deck
32
Kathleen opens a savings account with $1600. The account earns 3.6% annual interest compounded quarterly. How much will be in the account after 12 years?
Unlock Deck
Unlock for access to all 106 flashcards in this deck.
Unlock Deck
k this deck
33
Kathleen opens a savings account with $1200. The account earns 3.3% annual interest compounded monthly. How much will be in the account after 16 years?
Unlock Deck
Unlock for access to all 106 flashcards in this deck.
Unlock Deck
k this deck
34
Kathleen opens a savings account with $1200. The account earns 3.4% annual interest compounded weekly. How much will be in the account after 15 years?
Unlock Deck
Unlock for access to all 106 flashcards in this deck.
Unlock Deck
k this deck
35
Suppose Taylor win $10,000 in a lottery. If she invests half in a CD earning 4.1% annual interest compounded quarterly and the rest in a savings account earning 3.9% annual interest compounded monthly. How much money does she have after 10 years?
Unlock Deck
Unlock for access to all 106 flashcards in this deck.
Unlock Deck
k this deck
36
Taylor has $11,000 which she would like to invest. She can either invest in a CD earning 3.1% annual interest compounded quarterly, or she can deposit the money in a savings account earning 2.9% annual interest compounded monthly. If she chooses the investment with the maximum return, how much will she have at the end of 5 years?
Unlock Deck
Unlock for access to all 106 flashcards in this deck.
Unlock Deck
k this deck
37
Taylor has $12,000 which she would like to invest. She can either invest in a CD earning 3.3% annual interest compounded quarterly, or she can deposit the money in a savings account earning 3.25% annual interest compounded monthly. If she chooses the investment with the maximum return, how much interest will she have earned at the end of 5 years?
Unlock Deck
Unlock for access to all 106 flashcards in this deck.
Unlock Deck
k this deck
38
How much interest is earned in an account yielding 4.2% annual interest compounded weekly if the initial investment is $1000 and the money stays in the account for 20 years?
Unlock Deck
Unlock for access to all 106 flashcards in this deck.
Unlock Deck
k this deck
39
Write a formula that gives the value of an investment which is initially worth $124,000 and gains value at a rate of 2.6% per year.
Unlock Deck
Unlock for access to all 106 flashcards in this deck.
Unlock Deck
k this deck
40
An investment grows by 1.4% per year for 25 years. By what percent does it increase over the 25-year period? Give your answer correct to four decimal places.
Unlock Deck
Unlock for access to all 106 flashcards in this deck.
Unlock Deck
k this deck
41
An investment decreases by 20% over a decade. By what effective annual rate does it decrease? Give your answer correct to four decimal places.
Unlock Deck
Unlock for access to all 106 flashcards in this deck.
Unlock Deck
k this deck
42
Write a verbal description for each of the following formulas. The units are dollars and years.
Unlock Deck
Unlock for access to all 106 flashcards in this deck.
Unlock Deck
k this deck
43
The price of an item increases due to inflation. Let Give the price of the item as a function of time in years, with t = 0 in 2004. What is the practical interpretation of ?
A) The price in 2004 of an item that is $75 now.
B) The price now of an item that was $75 in 2004.
C) The time at which the price reaches $75.
D) The price of the item after 75 years.
Give the price of the item as a function of time in years, with t = 0 in 2004. What is the practical interpretation of ?A) The price in 2004 of an item that is $75 now.
B) The price now of an item that was $75 in 2004.
C) The time at which the price reaches $75.
D) The price of the item after 75 years.
Unlock Deck
Unlock for access to all 106 flashcards in this deck.
Unlock Deck
k this deck
44
The price of an item increases due to inflation. Let be the price of the item as a function of time in years, with t = 0 in 2004. What is the daily inflation rate? Round to 2 decimal places.
be the price of the item as a function of time in years, with t = 0 in 2004. What is the daily inflation rate? Round to 2 decimal places. Unlock Deck
Unlock for access to all 106 flashcards in this deck.
Unlock Deck
k this deck
45
One solution to the equation 4 + x = 4(2)x is x = 0. Use your calculator to estimate the other solution to 2 decimal places.
Unlock Deck
Unlock for access to all 106 flashcards in this deck.
Unlock Deck
k this deck
46
What is the maximum number of solutions the equation 4 + x = 4(2)x can have?
Unlock Deck
Unlock for access to all 106 flashcards in this deck.
Unlock Deck
k this deck
47
The graph of the exponential function is shown below. The formula for must be
.
is shown below. The formula for must be .
Unlock Deck
Unlock for access to all 106 flashcards in this deck.
Unlock Deck
k this deck
48
The graph of the exponential function Is shown below. Suppose Represents a city's population, in thousands, t years after 1995. Which of the following quantities are equivalent?
A)
B) Approximately -295 thousand
C) Approximately 705 thousand
D) The change in the city's population between 1996 and 2000
E)
F) The rate at which the population is declining between 1996 and 2000
Is shown below. Suppose Represents a city's population, in thousands, t years after 1995. Which of the following quantities are equivalent?A)
B) Approximately -295 thousand
C) Approximately 705 thousand
D) The change in the city's population between 1996 and 2000
E)
F) The rate at which the population is declining between 1996 and 2000
Unlock Deck
Unlock for access to all 106 flashcards in this deck.
Unlock Deck
k this deck
49
The US population in 2005 was approximately 296.4 million. Assume the population increases at a rate of 1.22% per year. Some demographers believe that the ideal population of the United States is about 130 million. According to this model, in what year did this occur?
Unlock Deck
Unlock for access to all 106 flashcards in this deck.
Unlock Deck
k this deck
50
Unlock Deck
Unlock for access to all 106 flashcards in this deck.
Unlock Deck
k this deck
51
Unlock Deck
Unlock for access to all 106 flashcards in this deck.
Unlock Deck
k this deck
52
In the following figure, the functions f, g, h, and p can all be written in the form . Which one has the smallest value for b?
. Which one has the smallest value for b? Unlock Deck
Unlock for access to all 106 flashcards in this deck.
Unlock Deck
k this deck
53
Solve graphically for x if y = 13. Round to 1 decimal place.
graphically for x if y = 13. Round to 1 decimal place. Unlock Deck
Unlock for access to all 106 flashcards in this deck.
Unlock Deck
k this deck
54
The price of an item increases due to inflation. Let give the price of the item as a function of time in years, with t = 0 in 2004. Estimate to 2 decimal places.
give the price of the item as a function of time in years, with t = 0 in 2004. Estimate to 2 decimal places. Unlock Deck
Unlock for access to all 106 flashcards in this deck.
Unlock Deck
k this deck
55
Suppose the amount of ozone in the atmosphere is decreasing exponentially at a continuous rate of 0.26% per year. How many years will it take before one-fourth of the ozone has disappeared? Round to the nearest year.
Unlock Deck
Unlock for access to all 106 flashcards in this deck.
Unlock Deck
k this deck
56
The population of a city is increasing exponentially. In 2000, the city had a population of 60,000. In 2005, the population was 83,748. Let be the population of the town t years after 2000. Use a graph of to estimate the year in which the population will reach 250,000.
be the population of the town t years after 2000. Use a graph of to estimate the year in which the population will reach 250,000. Unlock Deck
Unlock for access to all 106 flashcards in this deck.
Unlock Deck
k this deck
57
The following figure gives the graph of , where C is the computer hard disk capacity (in hundreds of megabytes) that could be bought for $500 t years past 1989. If the trend displayed in the graph continued, how many megabytes would a $500 hard drive have in 1999? Round to the nearest hundred.
, where C is the computer hard disk capacity (in hundreds of megabytes) that could be bought for $500 t years past 1989. If the trend displayed in the graph continued, how many megabytes would a $500 hard drive have in 1999? Round to the nearest hundred. Unlock Deck
Unlock for access to all 106 flashcards in this deck.
Unlock Deck
k this deck
58
The following figure gives the graph of , where C is the computer hard disk capacity (in hundreds of megabytes) that could be bought for $500 t years past 1989. If the trend displayed in the graph continued, in what year would the capacity that can be bought for $500 be 9700?
, where C is the computer hard disk capacity (in hundreds of megabytes) that could be bought for $500 t years past 1989. If the trend displayed in the graph continued, in what year would the capacity that can be bought for $500 be 9700? Unlock Deck
Unlock for access to all 106 flashcards in this deck.
Unlock Deck
k this deck
59
Which of the following characteristics describe the graph of ?
A) It is concave down.
B) It is concave up.
C) It crosses the y-axis at 1.
D)
E)
F)
G)
?A) It is concave down.
B) It is concave up.
C) It crosses the y-axis at 1.
D)
E)
F)
G)
Unlock Deck
Unlock for access to all 106 flashcards in this deck.
Unlock Deck
k this deck
60
The amount of pollution in a harbor t hours after it was contaminated by illegal dumping is given by tons. After how many hours is there less than 23 tons of pollution in the harbor? Round to 1 decimal place.
tons. After how many hours is there less than 23 tons of pollution in the harbor? Round to 1 decimal place. Unlock Deck
Unlock for access to all 106 flashcards in this deck.
Unlock Deck
k this deck
61
What is the horizontal asymptote of
A) y = 0.85
B) y = 25
C) y = 0
D) There isn't one
A) y = 0.85
B) y = 25
C) y = 0
D) There isn't one
Unlock Deck
Unlock for access to all 106 flashcards in this deck.
Unlock Deck
k this deck
62
Consider the following figure, where Graph I has equation , Graph II has equation , Graph III has equation , and Graph IV has equation .
Is positive or negative?
, Graph II has equation , Graph III has equation , and Graph IV has equation . Is positive or negative? Unlock Deck
Unlock for access to all 106 flashcards in this deck.
Unlock Deck
k this deck
63
Let be the intersection of the graphs of the two exponential functions and , where . If b is decreased, does increase, decrease, or stay the same?
be the intersection of the graphs of the two exponential functions and , where . If b is decreased, does increase, decrease, or stay the same? Unlock Deck
Unlock for access to all 106 flashcards in this deck.
Unlock Deck
k this deck
64
Let be the intersection of the graphs of the two exponential functions and , where . If s is decreased, does increase, decrease, or stay the same?
be the intersection of the graphs of the two exponential functions and , where . If s is decreased, does increase, decrease, or stay the same? Unlock Deck
Unlock for access to all 106 flashcards in this deck.
Unlock Deck
k this deck
65
Assume that all important features are shown in the following graph of . What is ? For or , enter "inf" or "-inf".
. What is ? For or , enter "inf" or "-inf". Unlock Deck
Unlock for access to all 106 flashcards in this deck.
Unlock Deck
k this deck
66
The graph of has a horizontal asymptote at . (If there is no horizontal asymptote, enter "DNE".)
has a horizontal asymptote at . (If there is no horizontal asymptote, enter "DNE".) Unlock Deck
Unlock for access to all 106 flashcards in this deck.
Unlock Deck
k this deck
67
Which of the following formulas are exponential?
A)
B)
C)
D)
E)
F)
G)
A)
B)
C)
D)
E)
F)
G)
Unlock Deck
Unlock for access to all 106 flashcards in this deck.
Unlock Deck
k this deck
68
The number of books in a library tends to increase by the same percentage each year. Should a linear or an exponential function be used to model this scenario?
Unlock Deck
Unlock for access to all 106 flashcards in this deck.
Unlock Deck
k this deck
69
The following table gives values from an exponential or a linear function. Determine which, and find values for a and b so that if the function is linear, or if the function is exponential.
a = ______, b = ______.
if the function is linear, or if the function is exponential.a = ______, b = ______.
Unlock Deck
Unlock for access to all 106 flashcards in this deck.
Unlock Deck
k this deck
70
The table below shows v, the dollar value of a share of a certain stock, as a function of t, the time (in weeks) since the initial offering of the stock. A possible formula for is . Round the second answer to 3 decimal places.
is . Round the second answer to 3 decimal places. Unlock Deck
Unlock for access to all 106 flashcards in this deck.
Unlock Deck
k this deck
71
A population has size 2300 at time t = 0, with t in years. If the population grows by 90 people per year, what is the formula for P, the population at time t?
A)
B)
C)
D)
A)
B)
C)
D)
Unlock Deck
Unlock for access to all 106 flashcards in this deck.
Unlock Deck
k this deck
72
A population has size 4900 at time t = 0, with t in years. If the population grows by 15% per year, what is the formula for P, the population at time t?
A)
B)
C)
D)
A)
B)
C)
D)
Unlock Deck
Unlock for access to all 106 flashcards in this deck.
Unlock Deck
k this deck
73
The graph below shows the quantity of a drug in a patient's bloodstream over a period of time t, in minutes.
Which of the following scenarios best describes the graph?
A) The drug is injected over a 10 minute interval, during which the quantity increases linearly. After the 10 minutes, the injection is discontinued and the quantity then decays exponentially.
B) The drug is injected over a 10 minute interval, during which the quantity increases exponentially. After the 10 minutes, the injection is discontinued and the quantity then decays linearly.
C) The drug is injected all at once. The quantity first increases and then decreases linearly.
D) The drug is injected all at once. The quantity first increases and then decreases exponentially.
Which of the following scenarios best describes the graph?A) The drug is injected over a 10 minute interval, during which the quantity increases linearly. After the 10 minutes, the injection is discontinued and the quantity then decays exponentially.
B) The drug is injected over a 10 minute interval, during which the quantity increases exponentially. After the 10 minutes, the injection is discontinued and the quantity then decays linearly.
C) The drug is injected all at once. The quantity first increases and then decreases linearly.
D) The drug is injected all at once. The quantity first increases and then decreases exponentially.
Unlock Deck
Unlock for access to all 106 flashcards in this deck.
Unlock Deck
k this deck
74
Kevin buys a new CD player for $190, and finds two years later when he wants to sell it that it is only worth $45. Assuming the value of the CD player decreases exponentially, the formula for , the value of the CD player after t years, is given by . Round your second answer to 2 decimal places.
, the value of the CD player after t years, is given by . Round your second answer to 2 decimal places. Unlock Deck
Unlock for access to all 106 flashcards in this deck.
Unlock Deck
k this deck
75
A biologist measures the amount of contaminant in a lake 3 hours after a chemical spill and again 11 hours after the spill. She sets up a possible model to determine Q, the amount of the chemical remaining in the lake as a function of t, the time in hours since the spill. The model assumes the contaminant is leaving the lake at a constant rate, which she determines to be 6 tons/hour. She estimates that the lake will be free from the contaminant 30 hours after the spill. How many tons of the contaminant were in the lake at the 3 hour reading?
Unlock Deck
Unlock for access to all 106 flashcards in this deck.
Unlock Deck
k this deck
76
A biologist measures the amount of contaminant in a lake 5 hours after a chemical spill and again 8 hours after the spill. She sets up two possible models to determine Q, the amount of the chemical remaining in the lake as a function of t, the time in hours since the spill. The first model assumes the contaminant is leaving the lake at a constant rate, which she determines to be 3 tons/hour. Using this model, she estimates that the lake will be free from the contaminant 30 hours after the spill. Thus, and . The second model assumes that the amount of contaminant decreases exponentially. In this model, she finds that . Round both answers to 3 decimal places.
and . The second model assumes that the amount of contaminant decreases exponentially. In this model, she finds that . Round both answers to 3 decimal places. Unlock Deck
Unlock for access to all 106 flashcards in this deck.
Unlock Deck
k this deck
77
A biologist measures the amount of contaminant in a lake 2 hours after a chemical spill and again 11 hours after the spill. She sets up two possible models to determine Q, the amount of the chemical remaining in the lake as a function of t, the time in hours since the spill. The first model assumes the contaminant is leaving the lake at a constant rate, which she determines to be 3 tons/hour. Using this model, she estimates that the lake will be free from the contaminant 25 hours after the spill. The second model assumes that the amount of contaminant decreases exponentially. She measures the spill a third time after 18 hours and finds that 29 tons remain. Which model seems best?
A) The linear one
B) The exponential one
A) The linear one
B) The exponential one
Unlock Deck
Unlock for access to all 106 flashcards in this deck.
Unlock Deck
k this deck
78
Unlock Deck
Unlock for access to all 106 flashcards in this deck.
Unlock Deck
k this deck
79
Unlock Deck
Unlock for access to all 106 flashcards in this deck.
Unlock Deck
k this deck
80
The following figure shows two functions, one linear and the other exponential. The formula for the linear one is , and the formula for the exponential one is . Round the first two answers to 2 decimal places and the last two answers to 3 decimal places.
, and the formula for the exponential one is . Round the first two answers to 2 decimal places and the last two answers to 3 decimal places. Unlock Deck
Unlock for access to all 106 flashcards in this deck.
Unlock Deck
k this deck
Unlock Deck
Unlock for access to all 106 flashcards in this deck.


