Deck 12: Aggregate Demand and Aggregate Supply
Full screen (f)
Question
Question
Question
Question
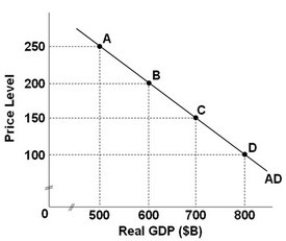
- Refer to the above graph, which shows an aggregate demand curve for a hypothetical economy. If the price level is 200, the quantity of real GDP demanded is:
A) $500 billion.
B) $600 billion.
C) $700 billion.
D) $800 billion.
Question
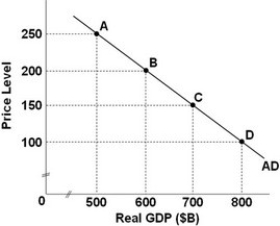
- Refer to the above graph, which shows an aggregate demand curve for a hypothetical economy. If the price level is 150, the quantity of real GDP demanded is:
A) $500 billion.
B) $600 billion.
C) $700 billion.
D) $800 billion.
Question
Question
Question
Question
Question
Question
Question
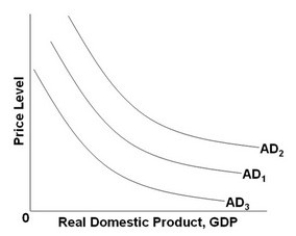 Refer to the above graph. Which factor will shift AD1 to AD2?
A) The real-balances effect.
B) An increase in productivity.
C) The foreign purchase effect.
D) An increase in investment spending.
Question
Question
Question
Question
Question
Question
Question
Question
Question
Question
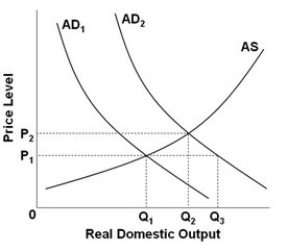
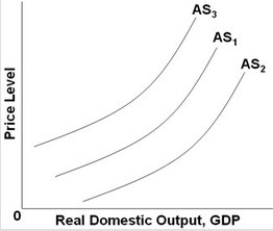 Refer to the above graph. Which factor will shift AS1 to AS2?
A) A rise in national income abroad.
B) An increase in government spending.
C) A reduction in business taxes.
D) A decline in consumer confidence.
Question
Question
Question
Question
Question
Question
Question
Question
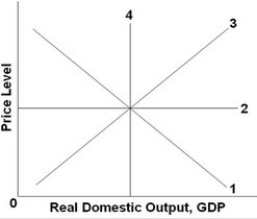
-Refer to the above graph. Which line shows the full-employment output for the economy?
A) 1
B) 2
C) 3
D) 4
Question
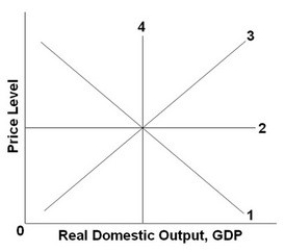
- Refer to the above graph. As the price level changes, real domestic output remains constant with which line?
A) 1
B) 2
C) 3
D) 4
Question
Question
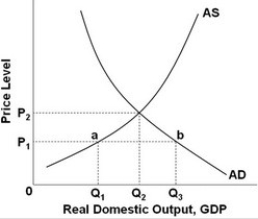
- Refer to the above graph. At price level P2:
A) the quantity of output supplied is constant.
B) the quantity of output supplied is equal to the quantity of output demanded.
C) the quantity of output supplied is greater than the quantity of output demanded.
D) the quantity of output supplied is less than the quantity of output demanded.
Question
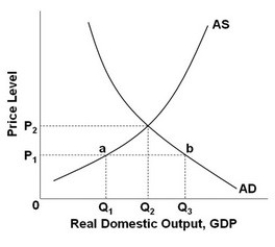
- Refer to the above graph. At price level P1:
A) the quantity of output supplied is constant.
B) the quantity of output supplied is equal to the quantity of output demanded.
C) the quantity of output supplied is greater than the quantity of output demanded.
D) the quantity of output supplied is less than the quantity of output demanded.
Question
The table shows the aggregate demand and aggregate supply schedule for a hypothetical economy.
 Refer to the above table. Using the original data from the table, if the quantity of real domestic output demanded increased by $3000 and the quantity of real domestic output supplied increased by $1000 at each price level, the new equilibrium price level and quantity of real domestic output would be:
A) 350 and $8000.
B) 300 and $9000.
C) 250 and $8000.
D) 200 and $7000.
Refer to the above table. Using the original data from the table, if the quantity of real domestic output demanded increased by $3000 and the quantity of real domestic output supplied increased by $1000 at each price level, the new equilibrium price level and quantity of real domestic output would be:A) 350 and $8000.
B) 300 and $9000.
C) 250 and $8000.
D) 200 and $7000.
Question
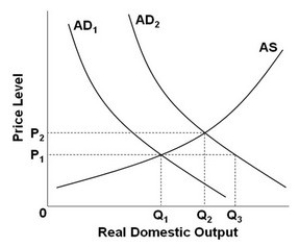
-Refer to the above diagram. If AD1 shifts to AD2, then the equilibrium output and price level will be:
A) P1Q3.
B) P2Q3.
C) P1Q2.
D) P2Q2.
Question
- Refer to the above diagram. When AD1 shifts to AD2, real output:
A) increases from Q1 to Q2, while the price level stays the same.
B) increases from Q1 to Q3, while the price level declines.
C) increases from Q1 to Q2, while the price level rises.
D) stays the same, while the price level rises.
Question
Question
Question
Question
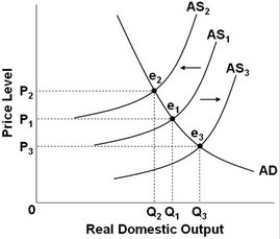
- Refer to the above diagram. When output increases from Q1 and the price level decreases from P1, this change will:
A) be caused by a shift in the aggregate supply curve from AS1 to AS2.
B) be caused by a shift in the aggregate supply curve from AS1 to AS3.
C) result in a movement along the aggregate demand curve from e1 to e2.
D) result in a movement along the aggregate demand curve from e3 to e1.
Question
- Refer to the above diagram. When output decreases from Q1 and the price level increases from P1, then this change will:
A) be caused by a shift in the aggregate supply curve from AS1 to AS3.
B) be caused by a shift in the aggregate supply curve from AS2 to AS1.
C) result in a movement along the aggregate demand curve from e2 to e1.
D) result in a movement along the aggregate demand curve from e1 to e2.
Question

-Refer to the above diagram. Cost-push inflation can be illustrated by a:
A) shift in the aggregate supply curve from AS1 to AS2.
B) shift in the aggregate supply curve from AS1 to AS3.
C) shift in the aggregate supply curve from AS2 to AS3.
D) movement along the aggregate demand curve from e1 to e3.
Question
Question
Question
 Refer to the above graph. The ratchet effect would suggest that:
A) if AD1 moves to AD2, the new equilibrium would be at b.
B) if AD1 moves to AD2, the new equilibrium would be at c.
C) if AD2 moves to AD1, the new equilibrium would be at a.
D) if AD2 moves to AD1, the new equilibrium would be at b.
Question
Question
Question
Question
Question
Question
Question
Question
Question
Question
Question
Question
Question
Question
Question
Question

Unlock Deck
Sign up to unlock the cards in this deck!
Unlock Deck
Unlock Deck
1/62
Play
Full screen (f)
Deck 12: Aggregate Demand and Aggregate Supply
1
The aggregate demand curve is the relationship between the:
A) price level and the sales of producers.
B) price level and the purchasing of real domestic output.
C) price level and the distribution of real domestic output.
D) real domestic output bought and the real domestic output sold.
A) price level and the sales of producers.
B) price level and the purchasing of real domestic output.
C) price level and the distribution of real domestic output.
D) real domestic output bought and the real domestic output sold.
price level and the purchasing of real domestic output.
2
The amount of real domestic output that will be purchased at each possible price level is best shown by the:
A) aggregate supply curve.
B) aggregate demand curve.
C) aggregate expenditures model.
D) difference between real and nominal GDP.
A) aggregate supply curve.
B) aggregate demand curve.
C) aggregate expenditures model.
D) difference between real and nominal GDP.
aggregate demand curve.
3
When the price level falls:
A) the demand for money rises.
B) there is a decrease in spending that is sensitive to interest-rate changes.
C) there is a decrease in the quantity of goods demanded as net exports.
D) holders of financial assets with fixed money values increase their spending.
A) the demand for money rises.
B) there is a decrease in spending that is sensitive to interest-rate changes.
C) there is a decrease in the quantity of goods demanded as net exports.
D) holders of financial assets with fixed money values increase their spending.
holders of financial assets with fixed money values increase their spending.
4
- Refer to the above graph, which shows an aggregate demand curve for a hypothetical economy. If the price level is 200, the quantity of real GDP demanded is:
A) $500 billion.
B) $600 billion.
C) $700 billion.
D) $800 billion.
Unlock Deck
Unlock for access to all 62 flashcards in this deck.
Unlock Deck
k this deck
5
- Refer to the above graph, which shows an aggregate demand curve for a hypothetical economy. If the price level is 150, the quantity of real GDP demanded is:
A) $500 billion.
B) $600 billion.
C) $700 billion.
D) $800 billion.
Unlock Deck
Unlock for access to all 62 flashcards in this deck.
Unlock Deck
k this deck
6
An increase in government spending will cause a(n):
A) increase in aggregate supply.
B) decrease in aggregate supply.
C) decrease in aggregate demand.
D) increase in aggregate demand.
A) increase in aggregate supply.
B) decrease in aggregate supply.
C) decrease in aggregate demand.
D) increase in aggregate demand.
Unlock Deck
Unlock for access to all 62 flashcards in this deck.
Unlock Deck
k this deck
7
A decrease in net exports will cause a(n):
A) decrease in aggregate demand.
B) increase in aggregate demand.
C) increase in aggregate supply.
D) decrease in aggregate supply.
A) decrease in aggregate demand.
B) increase in aggregate demand.
C) increase in aggregate supply.
D) decrease in aggregate supply.
Unlock Deck
Unlock for access to all 62 flashcards in this deck.
Unlock Deck
k this deck
8
If the U.S. dollar appreciates in value relative to foreign currencies, then this will:
A) increase aggregate demand.
B) decrease aggregate demand.
C) cause a movement downward along the aggregate demand curve.
D) cause a movement upward along the aggregate demand curve.
A) increase aggregate demand.
B) decrease aggregate demand.
C) cause a movement downward along the aggregate demand curve.
D) cause a movement upward along the aggregate demand curve.
Unlock Deck
Unlock for access to all 62 flashcards in this deck.
Unlock Deck
k this deck
9
When national income in other nations decreases, aggregate:
A) demand increases.
B) demand decreases.
C) supply increases.
D) supply decreases.
A) demand increases.
B) demand decreases.
C) supply increases.
D) supply decreases.
Unlock Deck
Unlock for access to all 62 flashcards in this deck.
Unlock Deck
k this deck
10
A decrease in aggregate demand is likely to result from:
A) a decrease in the price level.
B) an increase in the price level.
C) an appreciation in the value of the U.S. dollar.
D) a decrease in the excess capacity of factories.
A) a decrease in the price level.
B) an increase in the price level.
C) an appreciation in the value of the U.S. dollar.
D) a decrease in the excess capacity of factories.
Unlock Deck
Unlock for access to all 62 flashcards in this deck.
Unlock Deck
k this deck
11
Which set of events would most likely increase aggregate demand?
A) An increase in incomes in foreign nations and a depreciation of the dollar.
B) An increase in incomes in foreign nations and an appreciation of the dollar.
C) A decrease in incomes in foreign nations and an appreciation of the dollar.
D) A decrease in incomes in foreign nations and a depreciation of the dollar.
Unlock Deck
Unlock for access to all 62 flashcards in this deck.
Unlock Deck
k this deck
12
Refer to the above graph. Which factor will shift AD1 to AD2?A) The real-balances effect.
B) An increase in productivity.
C) The foreign purchase effect.
D) An increase in investment spending.
Unlock Deck
Unlock for access to all 62 flashcards in this deck.
Unlock Deck
k this deck
13
Which of the following will lead to an increase in aggregate demand?
A) A decrease in the price level.
B) An increase in the price level.
C) An increase in national incomes abroad.
D) An appreciation in the value of the U.S. dollar.
A) A decrease in the price level.
B) An increase in the price level.
C) An increase in national incomes abroad.
D) An appreciation in the value of the U.S. dollar.
Unlock Deck
Unlock for access to all 62 flashcards in this deck.
Unlock Deck
k this deck
14
Which would be one of the factors that increase aggregate demand?
A) An increase in personal income tax rates.
B) An increase in the productivity of labor.
C) An increase in consumer wealth.
D) An increase in real interest rates.
A) An increase in personal income tax rates.
B) An increase in the productivity of labor.
C) An increase in consumer wealth.
D) An increase in real interest rates.
Unlock Deck
Unlock for access to all 62 flashcards in this deck.
Unlock Deck
k this deck
15
Which event would most likely increase aggregate demand?
A) A depreciation of the dollar.
B) An appreciation of the dollar.
C) A decrease in the national incomes in foreign nations.
D) A decrease in the price level that results in a foreign purchases effect.
A) A depreciation of the dollar.
B) An appreciation of the dollar.
C) A decrease in the national incomes in foreign nations.
D) A decrease in the price level that results in a foreign purchases effect.
Unlock Deck
Unlock for access to all 62 flashcards in this deck.
Unlock Deck
k this deck
16
The following list contains factors that are related to the aggregate demand curve.
1) Household expectations
2) Profit expectations
3) Degree of excess capacity
4) Personal income tax rates
5) Exchange rates
6) National income abroad
7) Government spending
8) Household wealth
-
Changes in which three of the above factors would most likely cause a change in consumer spending?
A) 1, 2, and 6
B) 1, 4, and 8
C) 3, 5, and 7
D) 5, 6, and 7
Unlock Deck
Unlock for access to all 62 flashcards in this deck.
Unlock Deck
k this deck
17
The following list contains factors that are related to the aggregate demand curve.
1) Household expectations
2) Profit expectations
3) Degree of excess capacity
4) Personal income tax rates
5) Exchange rates
6) National income abroad
7) Government spending
8) Household wealth
-
Refer to the above information. Investment spending would most likely be influenced by changes in:
A) 1 and 4.
B) 5 and 6.
C) 2 and 3.
D) 1 and 8.
Unlock Deck
Unlock for access to all 62 flashcards in this deck.
Unlock Deck
k this deck
18
The following list contains factors that are related to the aggregate demand curve.
1) Household expectations
2) Profit expectations
3) Degree of excess capacity
4) Personal income tax rates
5) Exchange rates
6) National income abroad
7) Government spending
8) Household wealth
-
Refer to the above information. A change in net export spending would most likely be caused by changes in:
A) 2 and 3.
B) 4 and 7.
C) 1 and 8.
D) 5 and 6.
Unlock Deck
Unlock for access to all 62 flashcards in this deck.
Unlock Deck
k this deck
19
An aggregate supply curve shows the:
A) level of real domestic output that will be produced at each possible price level.
B) level of real domestic output that will be purchased at each possible price level.
C) price level at which real domestic output will be purchased.
D) price level at which real domestic output will be in equilibrium.
Unlock Deck
Unlock for access to all 62 flashcards in this deck.
Unlock Deck
k this deck
20
A fall in prices of imported resources will cause aggregate:
A) supply to increase.
B) demand to increase.
C) supply to decrease.
D) demand to decrease.
A) supply to increase.
B) demand to increase.
C) supply to decrease.
D) demand to decrease.
Unlock Deck
Unlock for access to all 62 flashcards in this deck.
Unlock Deck
k this deck
21
If the prices of imported resources decrease, then this event would most likely:
A) decrease aggregate supply.
B) increase aggregate supply.
C) increase aggregate demand.
D) decrease aggregate demand.
A) decrease aggregate supply.
B) increase aggregate supply.
C) increase aggregate demand.
D) decrease aggregate demand.
Unlock Deck
Unlock for access to all 62 flashcards in this deck.
Unlock Deck
k this deck
22
Refer to the above graph. Which factor will shift AS1 to AS2?A) A rise in national income abroad.
B) An increase in government spending.
C) A reduction in business taxes.
D) A decline in consumer confidence.
Unlock Deck
Unlock for access to all 62 flashcards in this deck.
Unlock Deck
k this deck
23
In an economy it costs $1500 to produce 2000 units of output. If the costs increase to $2500, then the per-unit cost of production will have increased from:
A) $0.75 to $1.25.
B) $0.75 to $1.00.
C) $1.33 to $1.75.
D) $0.80 to $1.33.
A) $0.75 to $1.25.
B) $0.75 to $1.00.
C) $1.33 to $1.75.
D) $0.80 to $1.33.
Unlock Deck
Unlock for access to all 62 flashcards in this deck.
Unlock Deck
k this deck
24
If the prices of imported resources decrease, then this event would most likely:
A) decrease aggregate supply.
B) increase aggregate supply.
C) increase aggregate demand.
D) decrease aggregate demand.
A) decrease aggregate supply.
B) increase aggregate supply.
C) increase aggregate demand.
D) decrease aggregate demand.
Unlock Deck
Unlock for access to all 62 flashcards in this deck.
Unlock Deck
k this deck
25
If Congress raised taxes on businesses, this action would:
A) increase per-unit production costs and thus increase aggregate demand.
B) increase per-unit production costs and thus increase aggregate supply.
C) increase per-unit production costs and thus decrease aggregate supply.
D) increase aggregate demand and increase aggregate supply.
A) increase per-unit production costs and thus increase aggregate demand.
B) increase per-unit production costs and thus increase aggregate supply.
C) increase per-unit production costs and thus decrease aggregate supply.
D) increase aggregate demand and increase aggregate supply.
Unlock Deck
Unlock for access to all 62 flashcards in this deck.
Unlock Deck
k this deck
26
A rise in prices of imported resources will cause aggregate:
A) supply to increase.
B) demand to increase.
C) supply to decrease.
D) demand to decrease.
A) supply to increase.
B) demand to increase.
C) supply to decrease.
D) demand to decrease.
Unlock Deck
Unlock for access to all 62 flashcards in this deck.
Unlock Deck
k this deck
27
The following list contains items that are related to aggregate demand and/or aggregate supply.
1) Government Spending
2) Consumer Expectations
3) Degree of Excess capacity
4) Personal Income Tax Rates
5) Productivity
6) National Income Abroad
7) Business Taxes
8) Domestic Resource Availability
9) Price of Imported Products
10) Profit Expectations on Investments
-
Refer to the above list. Changes in which combination of factors best explain why the aggregate supply curve would shift?
A) 1 and 2
B) 2 and 10
C) 3 and 6
D) 7 and 8
Unlock Deck
Unlock for access to all 62 flashcards in this deck.
Unlock Deck
k this deck
28
The following list contains items that are related to aggregate demand and/or aggregate supply.
1) Government Spending
2) Consumer Expectations
3) Degree of Excess capacity
4) Personal Income Tax Rates
5) Productivity
6) National Income Abroad
7) Business Taxes
8) Domestic Resource Availability
9) Price of Imported Products
10) Profit Expectations on Investments
-
Refer to the above list. Changes in which of the above two factors would most likely cause a change in aggregate supply?
A) 1 and 5
B) 3 and 10
C) 5 and 7
D) 8 and 9
Unlock Deck
Unlock for access to all 62 flashcards in this deck.
Unlock Deck
k this deck
29
The following list contains items that are related to aggregate demand and/or aggregate supply.
1) Government Spending
2) Consumer Expectations
3) Degree of Excess capacity
4) Personal Income Tax Rates
5) Productivity
6) National Income Abroad
7) Business Taxes
8) Domestic Resource Availability
9) Price of Imported Products
10) Profit Expectations on Investments
-
Refer to the above list. A change in which factor is most likely to change both aggregate demand and aggregate supply?
A) 3
B) 5
C) 7
D) 9
Unlock Deck
Unlock for access to all 62 flashcards in this deck.
Unlock Deck
k this deck
30
-Refer to the above graph. Which line shows the full-employment output for the economy?
A) 1
B) 2
C) 3
D) 4
Unlock Deck
Unlock for access to all 62 flashcards in this deck.
Unlock Deck
k this deck
31
- Refer to the above graph. As the price level changes, real domestic output remains constant with which line?
A) 1
B) 2
C) 3
D) 4
Unlock Deck
Unlock for access to all 62 flashcards in this deck.
Unlock Deck
k this deck
32
A graph of the long-run aggregate supply curve is:
A) horizontal, and a graph of the short-run aggregate supply is upsloping.
B) upsloping, and a graph of the short-run aggregate supply is vertical.
C) upsloping, and a graph of the short-run aggregate supply is horizontal.
D) vertical, and a graph of the short-run aggregate supply is upsloping.
A) horizontal, and a graph of the short-run aggregate supply is upsloping.
B) upsloping, and a graph of the short-run aggregate supply is vertical.
C) upsloping, and a graph of the short-run aggregate supply is horizontal.
D) vertical, and a graph of the short-run aggregate supply is upsloping.
Unlock Deck
Unlock for access to all 62 flashcards in this deck.
Unlock Deck
k this deck
33
- Refer to the above graph. At price level P2:
A) the quantity of output supplied is constant.
B) the quantity of output supplied is equal to the quantity of output demanded.
C) the quantity of output supplied is greater than the quantity of output demanded.
D) the quantity of output supplied is less than the quantity of output demanded.
Unlock Deck
Unlock for access to all 62 flashcards in this deck.
Unlock Deck
k this deck
34
- Refer to the above graph. At price level P1:
A) the quantity of output supplied is constant.
B) the quantity of output supplied is equal to the quantity of output demanded.
C) the quantity of output supplied is greater than the quantity of output demanded.
D) the quantity of output supplied is less than the quantity of output demanded.
Unlock Deck
Unlock for access to all 62 flashcards in this deck.
Unlock Deck
k this deck
35
The table shows the aggregate demand and aggregate supply schedule for a hypothetical economy.
Refer to the above table. Using the original data from the table, if the quantity of real domestic output demanded increased by $3000 and the quantity of real domestic output supplied increased by $1000 at each price level, the new equilibrium price level and quantity of real domestic output would be:
A) 350 and $8000.
B) 300 and $9000.
C) 250 and $8000.
D) 200 and $7000.
Refer to the above table. Using the original data from the table, if the quantity of real domestic output demanded increased by $3000 and the quantity of real domestic output supplied increased by $1000 at each price level, the new equilibrium price level and quantity of real domestic output would be:A) 350 and $8000.
B) 300 and $9000.
C) 250 and $8000.
D) 200 and $7000.
Unlock Deck
Unlock for access to all 62 flashcards in this deck.
Unlock Deck
k this deck
36
-Refer to the above diagram. If AD1 shifts to AD2, then the equilibrium output and price level will be:
A) P1Q3.
B) P2Q3.
C) P1Q2.
D) P2Q2.
Unlock Deck
Unlock for access to all 62 flashcards in this deck.
Unlock Deck
k this deck
37
- Refer to the above diagram. When AD1 shifts to AD2, real output:
A) increases from Q1 to Q2, while the price level stays the same.
B) increases from Q1 to Q3, while the price level declines.
C) increases from Q1 to Q2, while the price level rises.
D) stays the same, while the price level rises.
Unlock Deck
Unlock for access to all 62 flashcards in this deck.
Unlock Deck
k this deck
38
The massive increase in government spending during World War II moved the economy in the span of a few short years from mass unemployment and price stability to "overfull" employment and severe demand-pull inflation. This situation can be best characterized by:
A) a decrease in aggregate supply.
B) an increase in aggregate supply.
C) an increase in aggregate demand.
D) a decrease in aggregate demand.
A) a decrease in aggregate supply.
B) an increase in aggregate supply.
C) an increase in aggregate demand.
D) a decrease in aggregate demand.
Unlock Deck
Unlock for access to all 62 flashcards in this deck.
Unlock Deck
k this deck
39
One reason why the aggregate supply curve might shift to the left is that:
A) consumer incomes have increased.
B) per-unit production costs have increased.
C) government spending has increased.
D) businesses have become more optimistic.
A) consumer incomes have increased.
B) per-unit production costs have increased.
C) government spending has increased.
D) businesses have become more optimistic.
Unlock Deck
Unlock for access to all 62 flashcards in this deck.
Unlock Deck
k this deck
40
Other things being equal, a reorganization of the OPEC cartel to permit it to increase world oil prices by 70 percent would most likely have which effect?
A) It would shift the aggregate demand curve right.
B) It would shift the aggregate supply curve right.
C) It would shift the aggregate supply curve left.
D) It would shift the aggregate demand curve right and the aggregate supply curve left.
A) It would shift the aggregate demand curve right.
B) It would shift the aggregate supply curve right.
C) It would shift the aggregate supply curve left.
D) It would shift the aggregate demand curve right and the aggregate supply curve left.
Unlock Deck
Unlock for access to all 62 flashcards in this deck.
Unlock Deck
k this deck
41
- Refer to the above diagram. When output increases from Q1 and the price level decreases from P1, this change will:
A) be caused by a shift in the aggregate supply curve from AS1 to AS2.
B) be caused by a shift in the aggregate supply curve from AS1 to AS3.
C) result in a movement along the aggregate demand curve from e1 to e2.
D) result in a movement along the aggregate demand curve from e3 to e1.
Unlock Deck
Unlock for access to all 62 flashcards in this deck.
Unlock Deck
k this deck
42
- Refer to the above diagram. When output decreases from Q1 and the price level increases from P1, then this change will:
A) be caused by a shift in the aggregate supply curve from AS1 to AS3.
B) be caused by a shift in the aggregate supply curve from AS2 to AS1.
C) result in a movement along the aggregate demand curve from e2 to e1.
D) result in a movement along the aggregate demand curve from e1 to e2.
Unlock Deck
Unlock for access to all 62 flashcards in this deck.
Unlock Deck
k this deck
43
-Refer to the above diagram. Cost-push inflation can be illustrated by a:
A) shift in the aggregate supply curve from AS1 to AS2.
B) shift in the aggregate supply curve from AS1 to AS3.
C) shift in the aggregate supply curve from AS2 to AS3.
D) movement along the aggregate demand curve from e1 to e3.
Unlock Deck
Unlock for access to all 62 flashcards in this deck.
Unlock Deck
k this deck
44
When aggregate demand decreases, product prices, wage rates, and per-unit production costs are inflexible downward because of a:
A) ratchet effect.
B) interest-rate effect.
C) real-balances effect.
D) foreign-purchases effect.
A) ratchet effect.
B) interest-rate effect.
C) real-balances effect.
D) foreign-purchases effect.
Unlock Deck
Unlock for access to all 62 flashcards in this deck.
Unlock Deck
k this deck
45
The ratchet effect means that:
A) when aggregate supply increases, the price level decreases.
B) when aggregate supply decreases, the price level increases.
C) when aggregate demand decreases, the price level remains constant.
D) when aggregate demand increases, the price level remains constant.
A) when aggregate supply increases, the price level decreases.
B) when aggregate supply decreases, the price level increases.
C) when aggregate demand decreases, the price level remains constant.
D) when aggregate demand increases, the price level remains constant.
Unlock Deck
Unlock for access to all 62 flashcards in this deck.
Unlock Deck
k this deck
46
Refer to the above graph. The ratchet effect would suggest that:A) if AD1 moves to AD2, the new equilibrium would be at b.
B) if AD1 moves to AD2, the new equilibrium would be at c.
C) if AD2 moves to AD1, the new equilibrium would be at a.
D) if AD2 moves to AD1, the new equilibrium would be at b.
Unlock Deck
Unlock for access to all 62 flashcards in this deck.
Unlock Deck
k this deck
47
Major increases in oil prices in the mid-1970s and in the late 1970s created:
A) an increase in long-run aggregate supply.
B) a reduction in the unemployment rate.
C) adverse aggregate supply shocks.
D) beneficial aggregate demand shocks.
A) an increase in long-run aggregate supply.
B) a reduction in the unemployment rate.
C) adverse aggregate supply shocks.
D) beneficial aggregate demand shocks.
Unlock Deck
Unlock for access to all 62 flashcards in this deck.
Unlock Deck
k this deck
48
The magnification of small changes in spending into larger changes in output and income is produced by:
A) the average propensity to consume.
B) the average propensity to save.
C) the multiplier effect.
D) saving.
A) the average propensity to consume.
B) the average propensity to save.
C) the multiplier effect.
D) saving.
Unlock Deck
Unlock for access to all 62 flashcards in this deck.
Unlock Deck
k this deck
49
If a $100 billion increase in government spending results in a $500 billion increase in real GDP, then the value of the multiplier:
A) equals $400 billion.
B) equals 5.
C) equals 0.2.
D) cannot be determined.
A) equals $400 billion.
B) equals 5.
C) equals 0.2.
D) cannot be determined.
Unlock Deck
Unlock for access to all 62 flashcards in this deck.
Unlock Deck
k this deck
50
If the multiplier is 4 and the desired increase in real GDP is $200 billion, the initial change in spending required to achieve that goal:
A) is $50 billion.
B) is $800 billion.
C) is $200 billion.
D) cannot be determined.
A) is $50 billion.
B) is $800 billion.
C) is $200 billion.
D) cannot be determined.
Unlock Deck
Unlock for access to all 62 flashcards in this deck.
Unlock Deck
k this deck
51
Which of the following statements about the multiplier is most accurate?
A) The multiplier applies to both increases and decreases in initial spending.
B) The multiplier only applies to increases in initial spending.
C) The multiplier only applies to decreases in initial spending.
D) The multiplier is rarely associated with changes in investment spending.
A) The multiplier applies to both increases and decreases in initial spending.
B) The multiplier only applies to increases in initial spending.
C) The multiplier only applies to decreases in initial spending.
D) The multiplier is rarely associated with changes in investment spending.
Unlock Deck
Unlock for access to all 62 flashcards in this deck.
Unlock Deck
k this deck
52
Aggregate demand is a schedule that shows the various amounts of goods and services that only consumers and businesses desire to purchase at each possible price level.
Unlock Deck
Unlock for access to all 62 flashcards in this deck.
Unlock Deck
k this deck
53
A change in household indebtedness will cause a movement along an existing aggregate demand curve.
Unlock Deck
Unlock for access to all 62 flashcards in this deck.
Unlock Deck
k this deck
54
An increase in net exports reduces aggregate demand.
Unlock Deck
Unlock for access to all 62 flashcards in this deck.
Unlock Deck
k this deck
55
The shape of a short-run aggregate supply curve basically depends on what happens to production costs and, therefore, to the prices that businesses must receive to cover costs and make a profit as real domestic output expands.
Unlock Deck
Unlock for access to all 62 flashcards in this deck.
Unlock Deck
k this deck
56
Below the full-employment level of output, per-unit production costs rise and firms must receive higher product prices for them to be profitable.
Unlock Deck
Unlock for access to all 62 flashcards in this deck.
Unlock Deck
k this deck
57
A rightward shift of the aggregate demand curve will increase real domestic output and the price level in the short run.
Unlock Deck
Unlock for access to all 62 flashcards in this deck.
Unlock Deck
k this deck
58
When there is an increase in aggregate demand in the long run, there will be an increase in the price level but not in the level of output or employment.
Unlock Deck
Unlock for access to all 62 flashcards in this deck.
Unlock Deck
k this deck
59
A decrease in aggregate demand will have no effect on the real equilibrium GDP of the economy and will lower its price level in the short run.
Unlock Deck
Unlock for access to all 62 flashcards in this deck.
Unlock Deck
k this deck
60
A decrease in aggregate demand will have no effect on the real equilibrium GDP of the economy and will lower its price level in the long run.
Unlock Deck
Unlock for access to all 62 flashcards in this deck.
Unlock Deck
k this deck
61
If the prices of imported resources increase, then aggregate supply will decrease.
Unlock Deck
Unlock for access to all 62 flashcards in this deck.
Unlock Deck
k this deck
62
An increase in aggregate supply increases the real domestic output and reduces the price level effects from an increase in aggregate demand.
Unlock Deck
Unlock for access to all 62 flashcards in this deck.
Unlock Deck
k this deck
Unlock Deck
Unlock for access to all 62 flashcards in this deck.


