Exam 12: Aggregate Demand and Aggregate Supply
Exam 1: Limits, Alternatives, and Choices21 Questions
Exam 2: The Market System and the Circular Flow11 Questions
Exam 3: Demand, Supply, and Market Equilibrium30 Questions
Exam 4: Elasticity of Demand and Supply23 Questions
Exam 5: Market Failures: Public Goods and Externalities12 Questions
Exam 6: Businesses and Their Costs15 Questions
Exam 7: Pure Competition6 Questions
Exam 8: Pure Monopoly17 Questions
Exam 9: Monopolistic Competition and Oligopoly16 Questions
Exam 10: GDP and Economic Growth39 Questions
Exam 11: Business Cycles, Unemployment, and Inflation40 Questions
Exam 12: Aggregate Demand and Aggregate Supply62 Questions
Exam 13: Fiscal Policy, Deficits, and Debt72 Questions
Exam 14: Money, Banking, and Financial Institutions58 Questions
Exam 15: Interest Rates and Monetary Policy69 Questions
Exam 16: International Trade and Exchange Rates28 Questions
Exam 17: Wage Determination17 Questions
Exam 18: Income Inequality and Poverty20 Questions
Select questions type
Which of the following statements about the multiplier is most accurate?
Free
(Multiple Choice)
4.9/5  (40)
(40)
Correct Answer: Verified
A
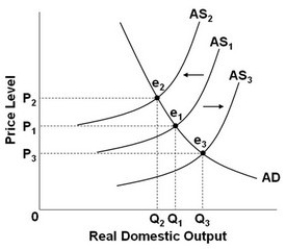 - Refer to the above diagram. When output decreases from Q1 and the price level increases from P1, then this change will:
Free
(Multiple Choice)
4.8/5 (33)
Correct Answer:Verified
D
Which set of events would most likely increase aggregate demand?
Free
(Multiple Choice)
4.8/5 (33)
Correct Answer:Verified
A
The shape of a short-run aggregate supply curve basically depends on what happens to production costs and, therefore, to the prices that businesses must receive to cover costs and make a profit as real domestic output expands.
(True/False)
4.8/5 (45)
If the prices of imported resources increase, then aggregate supply will decrease.
(True/False)
4.7/5 (37)
A fall in prices of imported resources will cause aggregate:
(Multiple Choice)
4.8/5 (34)
Which would be one of the factors that increase aggregate demand?
(Multiple Choice)
4.9/5 (34)
An increase in aggregate supply increases the real domestic output and reduces the price level effects from an increase in aggregate demand.
(True/False)
4.8/5 (23)
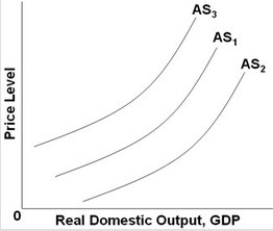 Refer to the above graph. Which factor will shift AS1 to AS2?
(Multiple Choice)
4.7/5 (40)
Major increases in oil prices in the mid-1970s and in the late 1970s created:
(Multiple Choice)
4.8/5 (40)
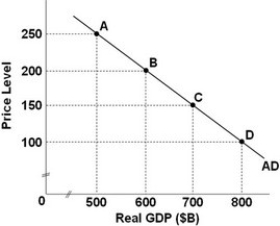 - Refer to the above graph, which shows an aggregate demand curve for a hypothetical economy. If the price level is 150, the quantity of real GDP demanded is:
(Multiple Choice)
4.9/5 (36)
Other things being equal, a reorganization of the OPEC cartel to permit it to increase world oil prices by 70 percent would most likely have which effect?
(Multiple Choice)
4.7/5 (42)
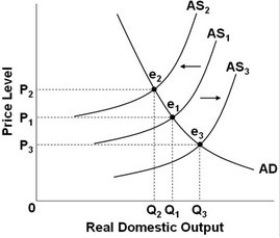 -Refer to the above diagram. Cost-push inflation can be illustrated by a:
(Multiple Choice)
4.7/5 (36)
Aggregate demand is a schedule that shows the various amounts of goods and services that only consumers and businesses desire to purchase at each possible price level.
(True/False)
4.8/5 (30)
Which of the following will lead to an increase in aggregate demand?
(Multiple Choice)
4.9/5 (39)
Filters
- Essay(0)
- Multiple Choice(0)
- Short Answer(0)
- True False(0)
- Matching(0)