Deck 3: Demand Estimation
Full screen (f)
Question
Question
Question
Question
Question
Question
Question
Question
Question
Just The Fax, Inc. (JTF) has hired you as a consultant to analyze the demand for its line of telecommunications devices in 35 different market areas. The available data set includes observations on the number of thousands of units sold by JTF per month (QX), the price per unit charged by JTF (PX), the average unit price of competing brands (PZ), monthly advertising expenditures by JTF (A), and average gross sales (in $1,000) of businesses in the market area (I). The results of a regression analysis (with standard errors in parenthesis) are given below.
 (i) Evaluate the statistical significance of the equation as a whole and of each of its coefficients.
(ii) The average values of the independent variables in the data set used to estimate the equation are PX = $195, PZ = $225, A = $11,000, and I = $200,000. Calculate a point estimate of JTF's average sales and a 95% interval estimate of sales based on these values.
(i) Evaluate the statistical significance of the equation as a whole and of each of its coefficients.(ii) The average values of the independent variables in the data set used to estimate the equation are PX = $195, PZ = $225, A = $11,000, and I = $200,000. Calculate a point estimate of JTF's average sales and a 95% interval estimate of sales based on these values.
Question
The Drag Net Fishing Company (DNF) has hired you as a consultant to analyze the demand by local restaurants for fresh fish. The available data set includes monthly observations collected over the past five years on the number of hundreds of pounds of fish purchased by local restaurants per month (Q), the price per pound of fish (P), the average cost of a meal at a local restaurant (M), a seasonal variable (S) that is equal to one during the tourist season and zero otherwise, and average household income (in $1,000) in the area. The results of a regression analysis (with standard errors in parenthesis) are given below.
 (i) Evaluate the statistical significance of the equation as a whole and of each of its coefficients.
(ii) The average values of independent variables in the data set that was used to estimate the equation are P = $8, M = $14, and I = $40,000. Calculate a point estimate of the restaurant demand for fish and a 95% interval estimate when it is tourist season. Also, calculate a point estimate of the restaurant demand for fish and a 95% interval estimate when it is not tourist season.
(i) Evaluate the statistical significance of the equation as a whole and of each of its coefficients.(ii) The average values of independent variables in the data set that was used to estimate the equation are P = $8, M = $14, and I = $40,000. Calculate a point estimate of the restaurant demand for fish and a 95% interval estimate when it is tourist season. Also, calculate a point estimate of the restaurant demand for fish and a 95% interval estimate when it is not tourist season.
Question
Question

Unlock Deck
Sign up to unlock the cards in this deck!
Unlock Deck
Unlock Deck
1/12
Play
Full screen (f)
Deck 3: Demand Estimation
1
regression equation is equal to 3.614 and the critical values of the t distribution at the 1% and 5% levels of significance, respectively, are 3.499 and 2.365, then the slope is
A) not significantly different from zero.
B) significantly different from zero at both the 1% and the 5% levels.
C) significantly different from zero at the 1% level but not at the 5% level.
D) significantly different from zero at the 5% level but not at the 1% level.
A) not significantly different from zero.
B) significantly different from zero at both the 1% and the 5% levels.
C) significantly different from zero at the 1% level but not at the 5% level.
D) significantly different from zero at the 5% level but not at the 1% level.
significantly different from zero at both the 1% and the 5% levels.
2
If the t ratio for the slope of a simple linear regression equation is equal to 1.614 and the critical values of the t distribution at the 1% and 5% levels of significance, respectively, are 3.499 and 2.365, then the slope is
A) not significantly different from zero.
B) significantly different from zero at both the 1% and the 5% levels.
C) significantly different from zero at the 1% level but not at the 5% level.
D) significantly different from zero at the 5% level but not at the 1% level.
A) not significantly different from zero.
B) significantly different from zero at both the 1% and the 5% levels.
C) significantly different from zero at the 1% level but not at the 5% level.
D) significantly different from zero at the 5% level but not at the 1% level.
not significantly different from zero.
3
If the t ratio for the slope of a simple coefficient of a simple linear regression equation is -2.48 and the critical values of the t distribution at the 1% and 5% levels, respectively, are 3.499 and 2.365, then the slope is
A) not significantly different from zero.
B) significantly different from zero at both the 1% and the 5% levels.
C) significantly different from zero at the 1% level but not at the 5% level.
D) significantly different from zero at the 5% level but not at the 1% level.
A) not significantly different from zero.
B) significantly different from zero at both the 1% and the 5% levels.
C) significantly different from zero at the 1% level but not at the 5% level.
D) significantly different from zero at the 5% level but not at the 1% level.
significantly different from zero at the 5% level but not at the 1% level.
4
Ordinary least squares is used to estimate a linear relationship between a firm's quantity sold per month and its total promotional expenditures, and the slope of the linear function is found to be positive and significantly different from zero. Assuming that all other variables, including product price, were constant during the period covered by the data set, this result implies that
A) the firm should spend more on promotional expenditures.
B) the firm should spend less on promotional expenditures.
C) promotional expenditures influence demand.
D) promotional expenditures have no influence on demand.
A) the firm should spend more on promotional expenditures.
B) the firm should spend less on promotional expenditures.
C) promotional expenditures influence demand.
D) promotional expenditures have no influence on demand.
Unlock Deck
Unlock for access to all 12 flashcards in this deck.
Unlock Deck
k this deck
5
Ordinary least squares is used to estimate a linear relationship between a firm's total revenue per week (in $1,000s) and the average percentage discount from list price allowed to customers by salespersons. A 95% confidence interval on the slope is calculated from the regression output. The interval ranges from 1.05 to 2.38. Based on this result, the researcher
A) can conclude that the slope is significantly different from zero at the 5% level of significance.
B) can be 95% confident that the effect of a 1% increase in the average price discount will increase weekly total revenue by between $1,050 and $2,380.
C) has one chance in twenty of incorrectly concluding that the slope is within the estimated confidence interval.
D) All of the above are correct.
Unlock Deck
Unlock for access to all 12 flashcards in this deck.
Unlock Deck
k this deck
6
The adjusted value of the coefficient of determination
A) will always increase if additional independent variables are added to the regression model.
B) is equal to the proportion of the sum of the squared deviations of the dependent variable from its mean that is explained by the regression model.
C) is always greater than the proportion of the sum of the squared deviations of the dependent variable from its mean that is explained by the regression model.
D) is always less than the proportion of the sum of the squared deviations of the dependent variable from its mean that is explained by the regression model.
Unlock Deck
Unlock for access to all 12 flashcards in this deck.
Unlock Deck
k this deck
7
The Durbin-Watson statistic is used to test the significance of the standard error of the regression.
Unlock Deck
Unlock for access to all 12 flashcards in this deck.
Unlock Deck
k this deck
8
If the observed values of the dependent and independent variables are transformed into their natural logarithms, then each estimated slope coefficient is equal to the elasticity of the dependent variable with respect to the corresponding independent variable.
Unlock Deck
Unlock for access to all 12 flashcards in this deck.
Unlock Deck
k this deck
9
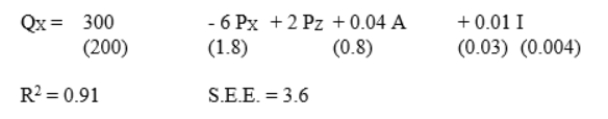
Just The Fax, Inc. (JTF) has hired you as a consultant to analyze the demand for its line of telecommunications devices in 35 different market areas. The available data set includes observations on the number of thousands of units sold by JTF per month (QX), the price per unit charged by JTF (PX), the average unit price of competing brands (PZ), monthly advertising expenditures by JTF (A), and average gross sales (in $1,000) of businesses in the market area (I). The results of a regression analysis (with standard errors in parenthesis) are given below.
(i) Evaluate the statistical significance of the equation as a whole and of each of its coefficients.
(ii) The average values of the independent variables in the data set used to estimate the equation are PX = $195, PZ = $225, A = $11,000, and I = $200,000. Calculate a point estimate of JTF's average sales and a 95% interval estimate of sales based on these values.
(i) Evaluate the statistical significance of the equation as a whole and of each of its coefficients.(ii) The average values of the independent variables in the data set used to estimate the equation are PX = $195, PZ = $225, A = $11,000, and I = $200,000. Calculate a point estimate of JTF's average sales and a 95% interval estimate of sales based on these values.
Unlock Deck
Unlock for access to all 12 flashcards in this deck.
Unlock Deck
k this deck
10
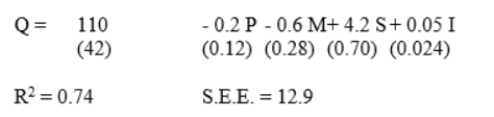
The Drag Net Fishing Company (DNF) has hired you as a consultant to analyze the demand by local restaurants for fresh fish. The available data set includes monthly observations collected over the past five years on the number of hundreds of pounds of fish purchased by local restaurants per month (Q), the price per pound of fish (P), the average cost of a meal at a local restaurant (M), a seasonal variable (S) that is equal to one during the tourist season and zero otherwise, and average household income (in $1,000) in the area. The results of a regression analysis (with standard errors in parenthesis) are given below.
(i) Evaluate the statistical significance of the equation as a whole and of each of its coefficients.
(ii) The average values of independent variables in the data set that was used to estimate the equation are P = $8, M = $14, and I = $40,000. Calculate a point estimate of the restaurant demand for fish and a 95% interval estimate when it is tourist season. Also, calculate a point estimate of the restaurant demand for fish and a 95% interval estimate when it is not tourist season.
(i) Evaluate the statistical significance of the equation as a whole and of each of its coefficients.(ii) The average values of independent variables in the data set that was used to estimate the equation are P = $8, M = $14, and I = $40,000. Calculate a point estimate of the restaurant demand for fish and a 95% interval estimate when it is tourist season. Also, calculate a point estimate of the restaurant demand for fish and a 95% interval estimate when it is not tourist season.
Unlock Deck
Unlock for access to all 12 flashcards in this deck.
Unlock Deck
k this deck
11
Florid Technologies is a manufacturer of exercise machines. Their best selling device, a mechanical swimming simulator, has been on the market for several years. The demand function for the simulator was estimated in log-linear form using time-series data. The results are presented below.
QX = 110 PX-0.20 PY0.30 PZ-0.10 A0.10 I0.01
The number of simulators sold per week (QX) was found to depend on the price charged for a simulator (PX), the average monthly cost of membership at a health club (PY), the cost of an accessory package designed for use with the simulator (PZ), monthly advertising expenditures (A) in thousands, and average annual household income (I) in thousands.
(i) If PX = $595, PY = $45, PZ = $99.85, A = $11,000, and I = $44,000, how many simulators can Florid Industries expect to sell in a week?
(ii) Interpret the price elasticity, cross-price elasticities, advertising elasticity, and income elasticity of demand for simulators.
(iii) The president of Florid Technologies plans to increase the simulator's price by 10% and to increase advertising expenditures by 5%. By what percentage can sales of simulators be expected to change? Will total revenue increase, decrease, or remain the same? Explain your answer.
(iv) If the price of a simulator is increased by 10% and the cost of an accessory package is reduced by 20%, what effect will this have on simulator sales?
Unlock Deck
Unlock for access to all 12 flashcards in this deck.
Unlock Deck
k this deck
12
The log-linear demand function for Beckler's Frozen Pizzas is:
lnQX = 4 - 3.80 ln PX + 0.30 ln PY + 0.15 ln S + ln A + 1.50 ln I
The number of pizzas sold per week (QX) depends on the price charged for a pizza (PX), the price charged for a competitor's brand of pizza (PY), the percentage of single parent families (S), monthly advertising expenditures (A) in thousands, and average annual household income (I) in thousands.
(i) If PX = $4.00, PY = $3.50, S = 40%, A = $5,000, and I = $40,000, how many pizzas can Beckler's expect to sell in a week?
(ii) Interpret the price elasticity, cross-price elasticity, family structure elasticity, advertising elasticity, and income elasticity of demand for pizzas.
(iii) The president of Beckler's plans to increase the price of their pizzas by 25% and to increase advertising expenditures by 10%. By what percentage can the number of pizzas sold by Beckler's be expected to change? Will total revenue increase, decrease, or remain the same? Explain your answer.
(iv) If Beckler's lowers the price of its pizzas by 5% and increases advertising expenditures by 10% while Beckler's competitor lowers the price of its pizza by 20%, what effect will this have on the number of Beckler's pizzas sold per week?
Unlock Deck
Unlock for access to all 12 flashcards in this deck.
Unlock Deck
k this deck
Unlock Deck
Unlock for access to all 12 flashcards in this deck.


