Deck 6: Inference for Means and Proportions
Full screen (f)
Question
Question
Question
Question
Question
Question
Question
Question
Question
Question
Question
Question
Question
Question
Question
Question
Question
Question
Question
Question
Question
Question
Question
Question
Question
Question
Question
Question
Question
Question
Question
Question
Question
Question
Question
Question
Question
Question
Question
Question
Question
Question
Question
Question
Question
Question
Question
Question
Use the following information to answer the confidence interval for a population proportion p in the questions below.
-0.655 to 0.685
What is the best estimate of p?
A) 0.685
B) 0.03
C) 0.655
D) 0.67
-0.655 to 0.685
What
is the best estimate of p?A) 0.685
B) 0.03
C) 0.655
D) 0.67
Question
Question
Question
Question
Question
Use the following to answer the questions below:
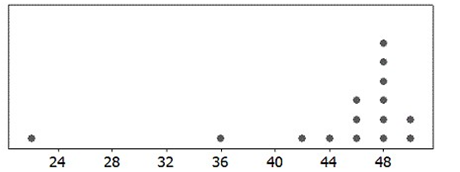
An Internet provider contacts a random sample of 300 customers and asks how many hours per week the customers use the Internet. The responses are summarized in the provided dotplot. The average amount of time spent on the Internet per week was 7.2 hours, with a standard deviation of 7.9 hours.
?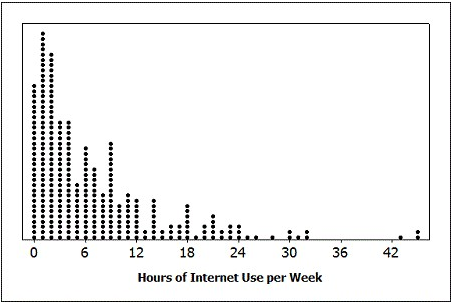
-Is it reasonable to use the t-distribution to construct a confidence interval for the average amount of time customers of this Internet provider spend on the Internet each week?
Question
Use the following to answer the questions below:
An Internet provider contacts a random sample of 300 customers and asks how many hours per week the customers use the Internet. The responses are summarized in the provided dotplot. The average amount of time spent on the Internet per week was 7.2 hours, with a standard deviation of 7.9 hours.
?
-Construct a 95% confidence interval for the average amount of time customers of this Internet provider spend on the Internet each week. Round the margin of error to one decimal place.
A) 6.3 to 8.1 hours
B) 6.0 to 8.4 hours
C) 5.7 to 8.7 hours
D) 5.5 to 8.9 hours
Question
Use the following to answer the questions below:
An Internet provider contacts a random sample of 300 customers and asks how many hours per week the customers use the Internet. The responses are summarized in the provided dotplot. The average amount of time spent on the Internet per week was 7.2 hours, with a standard deviation of 7.9 hours.
-Construct a 95% confidence interval for the average amount of time customers of this Internet provider spend on the Internet each week. Provide an interpretation of your interval in the context of this data situation.
Question
Use the following to answer the questions below:
An Internet provider contacts a random sample of 300 customers and asks how many hours per week the customers use the Internet. The responses are summarized in the provided dotplot. The average amount of time spent on the Internet per week was 7.2 hours, with a standard deviation of 7.9 hours.
?
-If we want a margin of error of 0.5 hours, how large of a sample would we need?
A) 960 people
B) 953 people
C) 952 people
D) 944 people
Question
Question
Question
Use the following to answer the questions below:
For each of the following, assume that the sample is a random sample from a distribution that is reasonably normally distributed and that we are doing inference for a population mean.
-Find endpoints of a t-distribution with 2.5% beyond them in each tail if the sample has size
A) -2.145 and 2.145
B) -1.533 and 1.533
C) -1.918 and 1.918
D) -2.328 and 2.328
Question
Use the following to answer the questions below:
For each of the following, assume that the sample is a random sample from a distribution that is reasonably normally distributed and that we are doing inference for a population mean.
-Find endpoints of a t-distribution with 10% beyond them in each tail if the sample has size
A) -1.533 and 1.533
B) -2.145 and 2.145
C) -1.918 and 1.918
D) -2.328 and 2.328
Question
Use the following to answer the questions below:
For each of the following, assume that the sample is a random sample from a distribution that is reasonably normally distributed and that we are doing inference for a population mean.
-Find endpoints of a t-distribution with 3% beyond them in each tail if the sample has size
A) -1.918 and 1.918
B) -2.145 and 2.145
C) -1.533 and 1.533
D) -2.328 and 2.328
Question
Question
Use the following to answer the questions below:
For each of the following, assume that the sample is a random sample from a distribution that is reasonably normally distributed and that we are doing inference for a population mean.
-Find the area in a t-distribution to the right of 2.6 if the sample has size
For each of the following, assume that the sample is a random sample from a distribution that is reasonably normally distributed and that we are doing inference for a population mean.
-Find the area in a t-distribution to the right of 2.6 if the sample has size
Question
Use the following to answer the questions below:
For each of the following, assume that the sample is a random sample from a distribution that is reasonably normally distributed and that we are doing inference for a population mean.
-Find the area in a t-distribution to the right of 1.75 if the sample has size
For each of the following, assume that the sample is a random sample from a distribution that is reasonably normally distributed and that we are doing inference for a population mean.
-Find the area in a t-distribution to the right of 1.75 if the sample has size
Question
Use the following to answer the questions below:
For each of the following, assume that the sample is a random sample from a distribution that is reasonably normally distributed and that we are doing inference for a population mean.
-Find the area in a t-distribution to the left of -2.7 if the sample has size
For each of the following, assume that the sample is a random sample from a distribution that is reasonably normally distributed and that we are doing inference for a population mean.
-Find the area in a t-distribution to the left of -2.7 if the sample has size
Question
Use the following to answer the questions below:
For each of the following, assume that the sample is a random sample from a distribution that is reasonably normally distributed and that we are doing inference for a population mean.
-Find the area in a t-distribution to the left of -0.68 if the sample has size
For each of the following, assume that the sample is a random sample from a distribution that is reasonably normally distributed and that we are doing inference for a population mean.
-Find the area in a t-distribution to the left of -0.68 if the sample has size
Question
Question
Question
Question
Question
Use the following to answer the questions below:
A dotplot and the summary statistics for a sample are provided. In each case, indicate whether or not it is appropriate to use the t-distribution.
-n = 12; = 4.75; s = 1.603
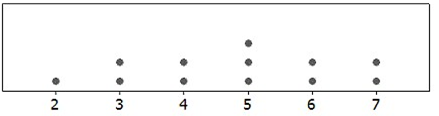
A dotplot and the summary statistics for a sample are provided. In each case, indicate whether or not it is appropriate to use the t-distribution.
-n = 12;
= 4.75; s = 1.603 Question
Use the following to answer the questions below:
A dotplot and the summary statistics for a sample are provided. In each case, indicate whether or not it is appropriate to use the t-distribution.
-n = 10; = 7.80; s = 9.28
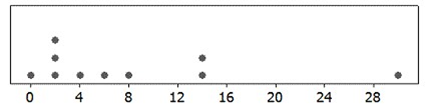
A dotplot and the summary statistics for a sample are provided. In each case, indicate whether or not it is appropriate to use the t-distribution.
-n = 10;
= 7.80; s = 9.28 Question
Use the following to answer the questions below:
A dotplot and the summary statistics for a sample are provided. In each case, indicate whether or not it is appropriate to use the t-distribution.
-n = 100; = 9.93; s = 9.247
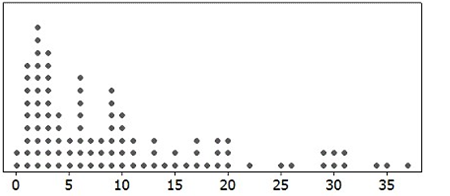
A dotplot and the summary statistics for a sample are provided. In each case, indicate whether or not it is appropriate to use the t-distribution.
-n = 100;
= 9.93; s = 9.247 Question
Use the following to answer the questions below:
A dotplot and the summary statistics for a sample are provided. In each case, indicate whether or not it is appropriate to use the t-distribution.
-n = 15; = 44; s = 7.32
A dotplot and the summary statistics for a sample are provided. In each case, indicate whether or not it is appropriate to use the t-distribution.
-n = 15;
= 44; s = 7.32 Question
Use the following to answer the questions below:
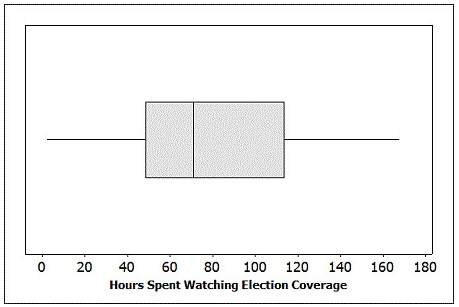
Many major television networks air coverage of the incoming election results during primetime hours. The provided boxplot displays the amount of time (in minutes) spent watching election coverage for a random sample of 25 U.S. adults. In this sample, the average time spent watching election coverage was 80.44 minutes with standard deviation of 43.99 minutes.
-Is it reasonable to use the t-distribution to construct a confidence interval for the average amount of time spent watching election coverage by U.S. adults?
Question
Question
Question
Question
Use the following to answer the questions below:
Turkey is a staple at most traditional Thanksgiving dinners. A random sample of 12 grocery store customers were asked about the size of the turkey they were purchasing for Thanksgiving. The average weight was 13.9 pounds with a standard deviation of 2.2 pounds. The boxplot displays the distribution of the sample turkey weights.
?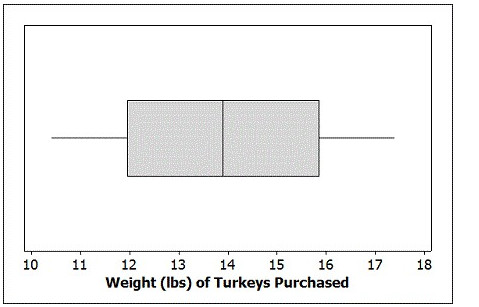
-Is it reasonable to use the t-distribution to construct a confidence interval for the average weight of turkeys purchased at this store?
Question
Use the following to answer the questions below:
Turkey is a staple at most traditional Thanksgiving dinners. A random sample of 12 grocery store customers were asked about the size of the turkey they were purchasing for Thanksgiving. The average weight was 13.9 pounds with a standard deviation of 2.2 pounds. The boxplot displays the distribution of the sample turkey weights.
?
-Construct a 99% confidence interval for the average weight of turkeys purchased at this store. Round your margin of error to two decimal places.
A) 11.93 to 15.87 pounds
B) 13.33 to 14.47 pounds
C) 12.57 to 15.23 pounds
D) 10.80 to 17.01 pounds

Unlock Deck
Sign up to unlock the cards in this deck!
Unlock Deck
Unlock Deck
1/166
Play
Full screen (f)
Deck 6: Inference for Means and Proportions
1
Use the following to answer the questions below:
Consider taking samples of size 100 from a population with proportion 0.33.
-Find the mean of the distribution of sample proportions.
A) 0.0033
B) 0.033
C) 0.33
D) 33
Consider taking samples of size 100 from a population with proportion 0.33.
-Find the mean of the distribution of sample proportions.
A) 0.0033
B) 0.033
C) 0.33
D) 33
0.33
2
Use the following to answer the questions below:
Consider taking samples of size 100 from a population with proportion 0.33.
-Find the standard error of the distribution of sample proportions.
A) 0.002211
B) 0.0033
C) 0.047
D) 0.33
Consider taking samples of size 100 from a population with proportion 0.33.
-Find the standard error of the distribution of sample proportions.
A) 0.002211
B) 0.0033
C) 0.047
D) 0.33
0.047
3
Use the following to answer the questions below:
Consider taking samples of size 100 from a population with proportion 0.33.
-Is the sample size large enough for the Central Limit Theorem to apply so that the sample proportions follow a normal distribution?
Consider taking samples of size 100 from a population with proportion 0.33.
-Is the sample size large enough for the Central Limit Theorem to apply so that the sample proportions follow a normal distribution?
True
4
Use the following to answer the questions below:
Consider taking samples of size 25 from a population with proportion 0.65.
-Find the mean of the distribution of sample proportions.
A) 0.026
B) 0.65
C) 0.13
D) 16.25
Consider taking samples of size 25 from a population with proportion 0.65.
-Find the mean of the distribution of sample proportions.
A) 0.026
B) 0.65
C) 0.13
D) 16.25
Unlock Deck
Unlock for access to all 166 flashcards in this deck.
Unlock Deck
k this deck
5
Use the following to answer the questions below:
Consider taking samples of size 25 from a population with proportion 0.65.
-Find the standard error of the distribution of sample proportions.
A) 0.0954
B) 0.0091
C) 0.0455
D) 0.0191
Consider taking samples of size 25 from a population with proportion 0.65.
-Find the standard error of the distribution of sample proportions.
A) 0.0954
B) 0.0091
C) 0.0455
D) 0.0191
Unlock Deck
Unlock for access to all 166 flashcards in this deck.
Unlock Deck
k this deck
6
Use the following to answer the questions below:
Consider taking samples of size 25 from a population with proportion 0.65.
-Is the sample size large enough for the Central Limit Theorem to apply so that the sample proportions follow a normal distribution?
Consider taking samples of size 25 from a population with proportion 0.65.
-Is the sample size large enough for the Central Limit Theorem to apply so that the sample proportions follow a normal distribution?
Unlock Deck
Unlock for access to all 166 flashcards in this deck.
Unlock Deck
k this deck
7
Use the following to answer the questions below:
Suppose that the makers of M&M's claim that 24% of their Milk Chocolate M&M's are blue.
-Assume that Fun-Size bags of Milk Chocolate M&M's hold 20 candies. Find the standard error of the distribution of sample proportions of blue candies for Fun-Size bags (i.e., samples of size 20). Use four decimal places when reporting the standard error.
Unlock Deck
Unlock for access to all 166 flashcards in this deck.
Unlock Deck
k this deck
8
Use the following to answer the questions below:
Suppose that the makers of M&M's claim that 24% of their Milk Chocolate M&M's are blue.
-Assume that the bags of Milk Chocolate M&M's sold in vending machines have 55 candies. Find the standard error of the distribution of sample proportions of blue candies for vending machine bags (i.e., samples of size 55). Use four decimal places when reporting the standard error.
Unlock Deck
Unlock for access to all 166 flashcards in this deck.
Unlock Deck
k this deck
9
Use the following to answer the questions below:
Suppose that the makers of M&M's claim that 24% of their Milk Chocolate M&M's are blue.
-Assume that bags of Milk Chocolate M&M's labeled as "Medium"
size contain 415 candies. Find the standard error of the distribution of sample proportions of blue candies for Medium bags (i.e., samples of size 415). Use four decimal places when reporting the standard error.
Unlock Deck
Unlock for access to all 166 flashcards in this deck.
Unlock Deck
k this deck
10
Use the following to answer the questions below:
Suppose that the makers of M&M's claim that 24% of their Milk Chocolate M&M's are blue.
-Would you expect using bags of Milk Chocolate M&M's labeled as "Large" size, which contain more candies than the "Medium"
Size bags, to result in a larger or smaller standard error?
A) Larger
B) Smaller
Suppose that the makers of M&M's claim that 24% of their Milk Chocolate M&M's are blue.
-Would you expect using bags of Milk Chocolate M&M's labeled as "Large" size, which contain more candies than the "Medium"
Size bags, to result in a larger or smaller standard error?
A) Larger
B) Smaller
Unlock Deck
Unlock for access to all 166 flashcards in this deck.
Unlock Deck
k this deck
11
Use the following to answer the questions below:
Suppose that the makers of M&M's claim that 24% of their Milk Chocolate M&M's are blue.
-For which sample sizes (Fun-Size with 20, Vending Machine with 55, or Medium with 415) would the Central Limit Theorem apply?
A) Vending Machine and Medium size bags
B) Fun-Size bags
C) Medium size bags
D) Fun-size and Vending Machine size bags
Unlock Deck
Unlock for access to all 166 flashcards in this deck.
Unlock Deck
k this deck
12
Use the following to answer the questions below:
Suppose that the makers of M&M's claim that 24% of their Milk Chocolate M&M's are blue.
-Suppose you purchase a bag of Milk Chocolate M&M's from a vending machine and only 8 of your 55 candies are blue. Assuming that the sample proportions are normally distributed, what percent of vending machine bags (i.e., samples of size 55) will have a sample proportion smaller than 0.145? Use two decimal places when reporting your answer.
Unlock Deck
Unlock for access to all 166 flashcards in this deck.
Unlock Deck
k this deck
13
Use the following to answer the questions below:
Admissions records at a small university indicates that 6.7% of the students enrolled are international students.
-Find the mean and standard error of the sample proportion of international students in random samples of size 50. Use four decimal places when reporting the standard error.
Admissions records at a small university indicates that 6.7% of the students enrolled are international students.
-Find the mean and standard error of the sample proportion of international students in random samples of size 50. Use four decimal places when reporting the standard error.
Unlock Deck
Unlock for access to all 166 flashcards in this deck.
Unlock Deck
k this deck
14
Use the following to answer the questions below:
Admissions records at a small university indicates that 6.7% of the students enrolled are international students.
-Find the mean and standard error of the sample proportion of international students in random samples of size 100. Use four decimal places when reporting the standard error.
Admissions records at a small university indicates that 6.7% of the students enrolled are international students.
-Find the mean and standard error of the sample proportion of international students in random samples of size 100. Use four decimal places when reporting the standard error.
Unlock Deck
Unlock for access to all 166 flashcards in this deck.
Unlock Deck
k this deck
15
Use the following to answer the questions below:
Admissions records at a small university indicates that 6.7% of the students enrolled are international students.
-Find the mean and standard error of the sample proportion of international students in random samples of size 200. Use four decimal places when reporting the standard error.
Admissions records at a small university indicates that 6.7% of the students enrolled are international students.
-Find the mean and standard error of the sample proportion of international students in random samples of size 200. Use four decimal places when reporting the standard error.
Unlock Deck
Unlock for access to all 166 flashcards in this deck.
Unlock Deck
k this deck
16
Use the following to answer the questions below:
Admissions records at a small university indicates that 6.7% of the students enrolled are international students.
-For which sample sizes (n = 50, n = 100, and n = 200) would the Central Limit Theorem apply?
A) n = 200
B) n = 50 and n = 100
C) n = 100 and n = 200
D) all three sample sizes
Admissions records at a small university indicates that 6.7% of the students enrolled are international students.
-For which sample sizes (n = 50, n = 100, and n = 200) would the Central Limit Theorem apply?
A) n = 200
B) n = 50 and n = 100
C) n = 100 and n = 200
D) all three sample sizes
Unlock Deck
Unlock for access to all 166 flashcards in this deck.
Unlock Deck
k this deck
17
Use the following to answer the questions below:
Admissions records at a small university indicates that 6.7% of the students enrolled are international students.
-What proportion of samples of 200 randomly selected students will have at least 8% international students? Use three decimal places when reporting your answer.
Admissions records at a small university indicates that 6.7% of the students enrolled are international students.
-What proportion of samples of 200 randomly selected students will have at least 8% international students? Use three decimal places when reporting your answer.
Unlock Deck
Unlock for access to all 166 flashcards in this deck.
Unlock Deck
k this deck
18
Use the following to answer the questions below:
A study to investigate the dominant paws in cats was described in the scientific journal Animal Behaviour. The researchers used a random sample of 42 domestic cats. In this study, each cat was shown a treat (5 grams of tuna), and while the cat watched, the food was placed inside a jar. The opening of the jar was small enough that the cat could not stick its head inside to remove the treat. The researcher recorded the paw that was first used by the cat to try to retrieve the treat. This was repeated 100 times for each cat (over a span of several days). The paw used most often was deemed the dominant paw (note that one cat used both paws equally and was classified as "ambidextrous"). Of the 42 cats studied, 20 were classified as "left-pawed."
-Verify that the sample is large enough to use the normal formula to find a confidence interval for the proportion of domestic cats that are "left-pawed."
Unlock Deck
Unlock for access to all 166 flashcards in this deck.
Unlock Deck
k this deck
19
Use the following to answer the questions below:
A study to investigate the dominant paws in cats was described in the scientific journal Animal Behaviour. The researchers used a random sample of 42 domestic cats. In this study, each cat was shown a treat (5 grams of tuna), and while the cat watched, the food was placed inside a jar. The opening of the jar was small enough that the cat could not stick its head inside to remove the treat. The researcher recorded the paw that was first used by the cat to try to retrieve the treat. This was repeated 100 times for each cat (over a span of several days). The paw used most often was deemed the dominant paw (note that one cat used both paws equally and was classified as "ambidextrous"). Of the 42 cats studied, 20 were classified as "left-pawed."
-Construct a 95% confidence interval for the proportion of domestic cats that are "left-pawed."
Use three decimal places in your margin of error.
Unlock Deck
Unlock for access to all 166 flashcards in this deck.
Unlock Deck
k this deck
20
Use the following to answer the questions below:
A study to investigate the dominant paws in cats was described in the scientific journal Animal Behaviour. The researchers used a random sample of 42 domestic cats. In this study, each cat was shown a treat (5 grams of tuna), and while the cat watched, the food was placed inside a jar. The opening of the jar was small enough that the cat could not stick its head inside to remove the treat. The researcher recorded the paw that was first used by the cat to try to retrieve the treat. This was repeated 100 times for each cat (over a span of several days). The paw used most often was deemed the dominant paw (note that one cat used both paws equally and was classified as "ambidextrous"). Of the 42 cats studied, 20 were classified as "left-pawed."
-Construct a 95% confidence interval for the proportion of domestic cats that are "left-pawed."
Provide an interpretation of your interval in the context of this data situation.
Unlock Deck
Unlock for access to all 166 flashcards in this deck.
Unlock Deck
k this deck
21
Use the following to answer the questions below:
A study to investigate the dominant paws in cats was described in the scientific journal Animal Behaviour. The researchers used a random sample of 42 domestic cats. In this study, each cat was shown a treat (5 grams of tuna), and while the cat watched, the food was placed inside a jar. The opening of the jar was small enough that the cat could not stick its head inside to remove the treat. The researcher recorded the paw that was first used by the cat to try to retrieve the treat. This was repeated 100 times for each cat (over a span of several days). The paw used most often was deemed the dominant paw (note that one cat used both paws equally and was classified as "ambidextrous"). Of the 42 cats studied, 20 were classified as "left-pawed."
-Another researcher wants to conduct a similar study to more precisely estimate the proportion of cats that are "left-pawed." They want to construct a 95% confidence interval that has a margin of error of 6%. How many cats does she need to use in her sample?
A) 267 cats
B) 266 cats
C) 268 cats
D) 269 cats
Unlock Deck
Unlock for access to all 166 flashcards in this deck.
Unlock Deck
k this deck
22
Use the following to answer questions 18-21:
In a survey of 7,786 randomly selected adults living in Germany, 5,840 said they exercised for at least 30 minutes three or more times per week.
-Verify that the sample is large enough to use the normal formula to find a confidence interval for the proportion of Germans who exercises for 30 minutes three or more times a week.
Unlock Deck
Unlock for access to all 166 flashcards in this deck.
Unlock Deck
k this deck
23
Use the following to answer questions 18-21:
In a survey of 7,786 randomly selected adults living in Germany, 5,840 said they exercised for at least 30 minutes three or more times per week.
-Construct a 99% confidence interval for the proportion of Germans who exercise for 30 minutes three or more times a week. Use three decimal places in your margin of error.
A) 0.737 to 0.763
B) 0.733 to 0.767
C) 0.722 to 0.778
D) 0.749 to 0.751
Unlock Deck
Unlock for access to all 166 flashcards in this deck.
Unlock Deck
k this deck
24
Use the following to answer questions 18-21:
In a survey of 7,786 randomly selected adults living in Germany, 5,840 said they exercised for at least 30 minutes three or more times per week.
-Construct a 99% confidence interval for the proportion of Germans who exercise for 30 minutes three or more times a week. Provide an interpretation of your interval in the context of this data situation.
Unlock Deck
Unlock for access to all 166 flashcards in this deck.
Unlock Deck
k this deck
25
Use the following to answer questions 18-21:
In a survey of 7,786 randomly selected adults living in Germany, 5,840 said they exercised for at least 30 minutes three or more times per week.
-Suppose an exercise scientist wants to estimate the proportion of American adults who exercise for 30 minutes three or more times per week. He wants to construct a 90% confidence interval with a margin of error of 1%. Note that Americans are typically thought to not be as active as individuals in other countries, and thus the estimate from Germany is likely not a good estimate for Americans. What sample size does he need?
A) 6,766 people
B) 13,532 people
C) 27,060 people
D) 41 people
Unlock Deck
Unlock for access to all 166 flashcards in this deck.
Unlock Deck
k this deck
26
Use the following to answer the questions below:
In a Gallup survey of 1,012 randomly selected U.S. adults (age 18 and over), 53% said that they were dissatisfied with the quality of education students receive in kindergarten through grade 12.
-Verify that the sample is large enough to use the normal formula to find a confidence interval for the proportion of Americans who are dissatisfied with the quality of education students receive in kindergarten through grade 12.
Unlock Deck
Unlock for access to all 166 flashcards in this deck.
Unlock Deck
k this deck
27
Use the following to answer the questions below:
In a Gallup survey of 1,012 randomly selected U.S. adults (age 18 and over), 53% said that they were dissatisfied with the quality of education students receive in kindergarten through grade 12.
-Construct a 90% confidence interval for the proportion of U.S. adults who are dissatisfied with the quality of education students receive in kindergarten through grade 12. Use three decimal places in your margin of error.
A) 0.504 to 0.556
B) 0.509 to 0.551
C) 0.512 to 0.548
D) 0.497 to 0.563
Unlock Deck
Unlock for access to all 166 flashcards in this deck.
Unlock Deck
k this deck
28
Use the following to answer the questions below:
In a Gallup survey of 1,012 randomly selected U.S. adults (age 18 and over), 53% said that they were dissatisfied with the quality of education students receive in kindergarten through grade 12.
-Construct a 90% confidence interval for the proportion of U.S. adults who are dissatisfied with the quality of education students receive in kindergarten through grade 12. Provide an interpretation of your interval in the context of this data situation.
Unlock Deck
Unlock for access to all 166 flashcards in this deck.
Unlock Deck
k this deck
29
Use the following to answer the questions below:
In a Gallup survey of 1,012 randomly selected U.S. adults (age 18 and over), 53% said that they were dissatisfied with the quality of education students receive in kindergarten through grade 12.
-Suppose you want to estimate the proportion of local adults who are dissatisfied with the education students receive in kindergarten through grade 12 with 95% confidence and a 5% margin of error. If you suspect that local adults won't differ drastically from those Gallup used, how many people should you sample?
A) You should sample 383 local adults.
B) You should sample 369 local adults.
C) You should sample 343 local adults.
D) You should sample 358 local adults.
Unlock Deck
Unlock for access to all 166 flashcards in this deck.
Unlock Deck
k this deck
30
Use the following to answer the questions below:
In a Gallup survey of 1,012 randomly selected U.S. adults (age 18 and over), 53% said that they were dissatisfied with the quality of education students receive in kindergarten through grade 12.
-Test, at the 5% level, if this sample provides evidence that the proportion of Americans who are dissatisfied with education in kindergarten through grade 12 differs significantly from 50%. Be sure to verify that it is appropriate to use a normal distribution to compute the p-value and include all of the details of the test.
Unlock Deck
Unlock for access to all 166 flashcards in this deck.
Unlock Deck
k this deck
31
Use the following to answer the questions below:
In a recent study, the Centers for Disease Control and Prevention reported that in a sample of 4,349 African Americans 31% were Vitamin D deficient. Overall, it is believed that Vitamin D deficiency affects 8% of all U.S. adults.
-Verify that the sample size is large enough to use a normal distribution to conduct a test comparing the population proportion of African Americans with Vitamin D deficiency to the overall rate of 8%.
Unlock Deck
Unlock for access to all 166 flashcards in this deck.
Unlock Deck
k this deck
32
Use the following to answer the questions below:
In a recent study, the Centers for Disease Control and Prevention reported that in a sample of 4,349 African Americans 31% were Vitamin D deficient. Overall, it is believed that Vitamin D deficiency affects 8% of all U.S. adults.
-Test, at the 1% significance level, if this sample provides evidence that the rate of Vitamin D deficiency among African Americans differs significantly from the overall rate of 8%. Include all of the details of the test.
Unlock Deck
Unlock for access to all 166 flashcards in this deck.
Unlock Deck
k this deck
33
Use the following to answer the questions below:
In a recent study, the Centers for Disease Control and Prevention reported that in a sample of 4,349 African Americans 31% were Vitamin D deficient. Overall, it is believed that Vitamin D deficiency affects 8% of all U.S. adults.
-Verify that the sample size is large enough to use the normal distribution to construct a confidence interval for the proportion of African Americans with Vitamin D deficiency.
Unlock Deck
Unlock for access to all 166 flashcards in this deck.
Unlock Deck
k this deck
34
Use the following to answer the questions below:
In a recent study, the Centers for Disease Control and Prevention reported that in a sample of 4,349 African Americans 31% were Vitamin D deficient. Overall, it is believed that Vitamin D deficiency affects 8% of all U.S. adults.
-Construct a 99% confidence interval for the proportion of African Americans with Vitamin D deficiency. Use three decimal places in your margin of error.
A) 0.292 to 0.328
B) 0.298 to 0.328
C) 0.296 to 0.324
D) 0.282 to 0.338
Unlock Deck
Unlock for access to all 166 flashcards in this deck.
Unlock Deck
k this deck
35
Use the following to answer the questions below:
The owner of a small pet supply store wants to open a second store in another city, but he only wants to do so if more than one-third of the city's households have pets (otherwise there won't be enough business). He selects a random sample of 150 households and finds that 64 have pets.
-Verify that the sample size is large enough to perform a test to compare the population proportion of households in the city with pets to the target.
Unlock Deck
Unlock for access to all 166 flashcards in this deck.
Unlock Deck
k this deck
36
Use the following to answer the questions below:
The owner of a small pet supply store wants to open a second store in another city, but he only wants to do so if more than one-third of the city's households have pets (otherwise there won't be enough business). He selects a random sample of 150 households and finds that 64 have pets.
-Test, at the 5% level, if this sample provides evidence that significantly more than one-third of the city's households have a pet. Include all of the details of the test.
Unlock Deck
Unlock for access to all 166 flashcards in this deck.
Unlock Deck
k this deck
37
Use the following to answer the questions below:
The owner of a small pet supply store wants to open a second store in another city, but he only wants to do so if more than one-third of the city's households have pets (otherwise there won't be enough business). He selects a random sample of 150 households and finds that 64 have pets.
-Verify that the sample size is large enough to use the normal distribution to construct a confidence interval for the proportion of the city's households that own pets.
Unlock Deck
Unlock for access to all 166 flashcards in this deck.
Unlock Deck
k this deck
38
Use the following to answer the questions below:
The owner of a small pet supply store wants to open a second store in another city, but he only wants to do so if more than one-third of the city's households have pets (otherwise there won't be enough business). He selects a random sample of 150 households and finds that 64 have pets.
-Construct a 95% confidence interval for the proportion of the city's households that own pets. Round the sample proportion and margin of error to three decimal places.
A) 0.348 to 0.506
B) 0.361 to 0.493
C) 0.323 to 0.531
D) 0.331 to 0.523
Unlock Deck
Unlock for access to all 166 flashcards in this deck.
Unlock Deck
k this deck
39
Use the following to answer the questions below:
In May 2012 President Obama made history by revealing his support of gay marriage. Around that time the Gallup Organization polled 1,024 U.S. adults about their opinions on gay/lesbian relations and gay marriage. They found that 54% of those sampled viewed gay/lesbian relations as "morally acceptable."
-Verify that the sample size is large enough to use the normal distribution to construct a confidence interval for the proportion of U.S. adults who consider gay and lesbian relations to be "morally acceptable."
Unlock Deck
Unlock for access to all 166 flashcards in this deck.
Unlock Deck
k this deck
40
Use the following to answer the questions below:
In May 2012 President Obama made history by revealing his support of gay marriage. Around that time the Gallup Organization polled 1,024 U.S. adults about their opinions on gay/lesbian relations and gay marriage. They found that 54% of those sampled viewed gay/lesbian relations as "morally acceptable."
-Construct a 90% confidence interval for the proportion of U.S. adults who find gay/lesbian relations to be "morally acceptable." Round the margin of error to three decimal places.
A) 0.514 to 0.566
B) 0.509 to 0.571
C) 0.500 to 0.580
D) 0.495 to 0.585
Unlock Deck
Unlock for access to all 166 flashcards in this deck.
Unlock Deck
k this deck
41
Use the following to answer the questions below:
In May 2012 President Obama made history by revealing his support of gay marriage. Around that time the Gallup Organization polled 1,024 U.S. adults about their opinions on gay/lesbian relations and gay marriage. They found that 54% of those sampled viewed gay/lesbian relations as "morally acceptable."
-What sample size would we need to reduce the margin of error to ± 1.5%?
A) 2,988 U.S. adults
B) 2,905 U.S. adults
C) 2,887 U.S. adults
D) 2,876 U.S. adults
Unlock Deck
Unlock for access to all 166 flashcards in this deck.
Unlock Deck
k this deck
42
Use the following to answer the questions below:
In May 2012 President Obama made history by revealing his support of gay marriage. Around that time the Gallup Organization polled 1,024 U.S. adults about their opinions on gay/lesbian relations and gay marriage. They found that 54% of those sampled viewed gay/lesbian relations as "morally acceptable."
-Does this sample provide evidence that the majority of U.S. adults (i.e., more than half) believe that gay/lesbian relations are "morally acceptable"? Use a 5% significance level. Verify that the sample size is large enough to use the normal distribution to compute the p-value for this test and include all of the details of the test.
Unlock Deck
Unlock for access to all 166 flashcards in this deck.
Unlock Deck
k this deck
43
Use the following to answer the questions below:
In a survey conducted by the Gallup organization, 1,017 adults were asked "In general, how much trust and confidence do you have in the mass media - such as newspapers, TV, and radio - when it comes to reporting the news fully, accurately, and fairly?" Of the 1,017 respondents, 214 said they had "no confidence at all."
-Test, at the 5% level, if this sample provides evidence that the proportion of U.S. adults who have no confidence in the media differs significantly from 25%. Verify that the sample size is large enough to use the normal distribution to compute the p-value for this test and include all of the details of the test.
Unlock Deck
Unlock for access to all 166 flashcards in this deck.
Unlock Deck
k this deck
44
Use the following to answer the questions below:
In a survey conducted by the Gallup organization, 1,017 adults were asked "In general, how much trust and confidence do you have in the mass media - such as newspapers, TV, and radio - when it comes to reporting the news fully, accurately, and fairly?" Of the 1,017 respondents, 214 said they had "no confidence at all."
-Verify that the sample size is large enough to use the normal distribution to construct a confidence interval for the proportion of U.S. adults who have no confidence in the media.
Unlock Deck
Unlock for access to all 166 flashcards in this deck.
Unlock Deck
k this deck
45
Use the following to answer the questions below:
In a survey conducted by the Gallup organization, 1,017 adults were asked "In general, how much trust and confidence do you have in the mass media - such as newspapers, TV, and radio - when it comes to reporting the news fully, accurately, and fairly?" Of the 1,017 respondents, 214 said they had "no confidence at all."
-Construct a 90% confidence interval for the proportion of U.S. adults who have no confidence in the media. Round the margin of error to three decimal places.
A) 0.189 to 0.231
B) 0.185 to 0.235
C) 0.177 to 0.243
D) 0.171 to 0.249
Unlock Deck
Unlock for access to all 166 flashcards in this deck.
Unlock Deck
k this deck
46
Use the following to answer the questions below:
In a survey conducted by the Gallup organization, 1,017 adults were asked "In general, how much trust and confidence do you have in the mass media - such as newspapers, TV, and radio - when it comes to reporting the news fully, accurately, and fairly?" Of the 1,017 respondents, 214 said they had "no confidence at all."
-What sample size is needed to reduce the margin of error to 1%?
A) 4,490 U.S. adults
B) 4,553 U.S. adults
C) 4,567 U.S. adults
D) 4,598 U.S. adults
Unlock Deck
Unlock for access to all 166 flashcards in this deck.
Unlock Deck
k this deck
47
Use the following information to answer the confidence interval for a population proportion p in the questions below.
-0.645 to 0.700
What is the margin of error?
A) 0.055
B) 0.0275
C) 0.01375
D) 0.6725
-0.645 to 0.700
What is the margin of error?
A) 0.055
B) 0.0275
C) 0.01375
D) 0.6725
Unlock Deck
Unlock for access to all 166 flashcards in this deck.
Unlock Deck
k this deck
48
Use the following information to answer the confidence interval for a population proportion p in the questions below.
-0.655 to 0.685
What is the best estimate of p?
A) 0.685
B) 0.03
C) 0.655
D) 0.67
-0.655 to 0.685
What
is the best estimate of p?A) 0.685
B) 0.03
C) 0.655
D) 0.67
Unlock Deck
Unlock for access to all 166 flashcards in this deck.
Unlock Deck
k this deck
49
Use the following to answer the questions below:
A sample of 148 college students at a large university reports getting an average of 6.85 hours of sleep last night with a standard deviation of 2.12 hours.
-Is it reasonable to use the t-distribution to construct a confidence interval for the average amount of sleep students at this university got last night?
Unlock Deck
Unlock for access to all 166 flashcards in this deck.
Unlock Deck
k this deck
50
Use the following to answer the questions below:
A sample of 148 college students at a large university reports getting an average of 6.85 hours of sleep last night with a standard deviation of 2.12 hours.
-Construct a 98% confidence interval for the average amount of sleep students at this university got last night. Use two decimal places in your margin of error.
A) 6.44 to 7.26 hours
B) 6.49 to 7.21 hours
C) 6.53 to 7.17 hours
D) 6.38 to 7.32 hours
Unlock Deck
Unlock for access to all 166 flashcards in this deck.
Unlock Deck
k this deck
51
Use the following to answer the questions below:
A sample of 148 college students at a large university reports getting an average of 6.85 hours of sleep last night with a standard deviation of 2.12 hours.
-Construct a 98% confidence interval for the average amount of sleep students at this university got last night. Provide an interpretation of your interval in the context of this data situation.
Unlock Deck
Unlock for access to all 166 flashcards in this deck.
Unlock Deck
k this deck
52
Use the following to answer the questions below:
A sample of 148 college students at a large university reports getting an average of 6.85 hours of sleep last night with a standard deviation of 2.12 hours.
-Suppose you want to conduct a similar study at your university. Assuming that the standard deviation of this sample is a reasonable estimate of the standard deviation of sleep time at your university, how many students do you need to survey to estimate the mean sleep time of students at your university with 95% confidence and a margin of error of 0.5 hours?
A) 70 students
B) 69 students
C) 88 students
D) 89 students
Unlock Deck
Unlock for access to all 166 flashcards in this deck.
Unlock Deck
k this deck
53
Use the following to answer the questions below:
An Internet provider contacts a random sample of 300 customers and asks how many hours per week the customers use the Internet. The responses are summarized in the provided dotplot. The average amount of time spent on the Internet per week was 7.2 hours, with a standard deviation of 7.9 hours.
?
-Is it reasonable to use the t-distribution to construct a confidence interval for the average amount of time customers of this Internet provider spend on the Internet each week?
Unlock Deck
Unlock for access to all 166 flashcards in this deck.
Unlock Deck
k this deck
54
Use the following to answer the questions below:
An Internet provider contacts a random sample of 300 customers and asks how many hours per week the customers use the Internet. The responses are summarized in the provided dotplot. The average amount of time spent on the Internet per week was 7.2 hours, with a standard deviation of 7.9 hours.
?
-Construct a 95% confidence interval for the average amount of time customers of this Internet provider spend on the Internet each week. Round the margin of error to one decimal place.
A) 6.3 to 8.1 hours
B) 6.0 to 8.4 hours
C) 5.7 to 8.7 hours
D) 5.5 to 8.9 hours
Unlock Deck
Unlock for access to all 166 flashcards in this deck.
Unlock Deck
k this deck
55
Use the following to answer the questions below:
An Internet provider contacts a random sample of 300 customers and asks how many hours per week the customers use the Internet. The responses are summarized in the provided dotplot. The average amount of time spent on the Internet per week was 7.2 hours, with a standard deviation of 7.9 hours.
-Construct a 95% confidence interval for the average amount of time customers of this Internet provider spend on the Internet each week. Provide an interpretation of your interval in the context of this data situation.
Unlock Deck
Unlock for access to all 166 flashcards in this deck.
Unlock Deck
k this deck
56
Use the following to answer the questions below:
An Internet provider contacts a random sample of 300 customers and asks how many hours per week the customers use the Internet. The responses are summarized in the provided dotplot. The average amount of time spent on the Internet per week was 7.2 hours, with a standard deviation of 7.9 hours.
?
-If we want a margin of error of 0.5 hours, how large of a sample would we need?
A) 960 people
B) 953 people
C) 952 people
D) 944 people
Unlock Deck
Unlock for access to all 166 flashcards in this deck.
Unlock Deck
k this deck
57
Use the following to answer the questions below:
According to a National Science Foundation study, individuals who graduated with a doctoral degree had an average of $14,115 graduate debt. Assume that the standard deviation of graduate debt is $26,400. If we take lots of samples of individuals who graduated with a doctoral degree, what would you expect the standard error of the distribution of sample mean graduate debt amounts to be in each case? In each case, use two decimal places when reporting your standard error.
-n = 200 individuals
Unlock Deck
Unlock for access to all 166 flashcards in this deck.
Unlock Deck
k this deck
58
Use the following to answer the questions below:
According to a National Science Foundation study, individuals who graduated with a doctoral degree had an average of $14,115 graduate debt. Assume that the standard deviation of graduate debt is $26,400. If we take lots of samples of individuals who graduated with a doctoral degree, what would you expect the standard error of the distribution of sample mean graduate debt amounts to be in each case? In each case, use two decimal places when reporting your standard error.
-n = 500 individuals
Unlock Deck
Unlock for access to all 166 flashcards in this deck.
Unlock Deck
k this deck
59
Use the following to answer the questions below:
For each of the following, assume that the sample is a random sample from a distribution that is reasonably normally distributed and that we are doing inference for a population mean.
-Find endpoints of a t-distribution with 2.5% beyond them in each tail if the sample has size
A) -2.145 and 2.145
B) -1.533 and 1.533
C) -1.918 and 1.918
D) -2.328 and 2.328
Unlock Deck
Unlock for access to all 166 flashcards in this deck.
Unlock Deck
k this deck
60
Use the following to answer the questions below:
For each of the following, assume that the sample is a random sample from a distribution that is reasonably normally distributed and that we are doing inference for a population mean.
-Find endpoints of a t-distribution with 10% beyond them in each tail if the sample has size
A) -1.533 and 1.533
B) -2.145 and 2.145
C) -1.918 and 1.918
D) -2.328 and 2.328
Unlock Deck
Unlock for access to all 166 flashcards in this deck.
Unlock Deck
k this deck
61
Use the following to answer the questions below:
For each of the following, assume that the sample is a random sample from a distribution that is reasonably normally distributed and that we are doing inference for a population mean.
-Find endpoints of a t-distribution with 3% beyond them in each tail if the sample has size
A) -1.918 and 1.918
B) -2.145 and 2.145
C) -1.533 and 1.533
D) -2.328 and 2.328
Unlock Deck
Unlock for access to all 166 flashcards in this deck.
Unlock Deck
k this deck
62
Use the following to answer the questions below:
For each of the following, assume that the sample is a random sample from a distribution that is reasonably normally distributed and that we are doing inference for a population mean.
-Find endpoints of a t-distribution with 1.5% beyond them in each tail if the sample has size 22.
A) -2.328 and 2.328
B) -2.145 and 2.145
C) -1.533 and 1.533
D) -1.918 and 1.918
Unlock Deck
Unlock for access to all 166 flashcards in this deck.
Unlock Deck
k this deck
63
Use the following to answer the questions below:
For each of the following, assume that the sample is a random sample from a distribution that is reasonably normally distributed and that we are doing inference for a population mean.
-Find the area in a t-distribution to the right of 2.6 if the sample has size
For each of the following, assume that the sample is a random sample from a distribution that is reasonably normally distributed and that we are doing inference for a population mean.
-Find the area in a t-distribution to the right of 2.6 if the sample has size
Unlock Deck
Unlock for access to all 166 flashcards in this deck.
Unlock Deck
k this deck
64
Use the following to answer the questions below:
For each of the following, assume that the sample is a random sample from a distribution that is reasonably normally distributed and that we are doing inference for a population mean.
-Find the area in a t-distribution to the right of 1.75 if the sample has size
For each of the following, assume that the sample is a random sample from a distribution that is reasonably normally distributed and that we are doing inference for a population mean.
-Find the area in a t-distribution to the right of 1.75 if the sample has size
Unlock Deck
Unlock for access to all 166 flashcards in this deck.
Unlock Deck
k this deck
65
Use the following to answer the questions below:
For each of the following, assume that the sample is a random sample from a distribution that is reasonably normally distributed and that we are doing inference for a population mean.
-Find the area in a t-distribution to the left of -2.7 if the sample has size
For each of the following, assume that the sample is a random sample from a distribution that is reasonably normally distributed and that we are doing inference for a population mean.
-Find the area in a t-distribution to the left of -2.7 if the sample has size
Unlock Deck
Unlock for access to all 166 flashcards in this deck.
Unlock Deck
k this deck
66
Use the following to answer the questions below:
For each of the following, assume that the sample is a random sample from a distribution that is reasonably normally distributed and that we are doing inference for a population mean.
-Find the area in a t-distribution to the left of -0.68 if the sample has size
For each of the following, assume that the sample is a random sample from a distribution that is reasonably normally distributed and that we are doing inference for a population mean.
-Find the area in a t-distribution to the left of -0.68 if the sample has size
Unlock Deck
Unlock for access to all 166 flashcards in this deck.
Unlock Deck
k this deck
67
Use the following to answer the questions below:
For each of the following, find the standard error of the distribution of sample means. Use two decimal places when reporting your standard error.
-Samples of size 15 from a population with mean 25 and standard deviation 4.
For each of the following, find the standard error of the distribution of sample means. Use two decimal places when reporting your standard error.
-Samples of size 15 from a population with mean 25 and standard deviation 4.
Unlock Deck
Unlock for access to all 166 flashcards in this deck.
Unlock Deck
k this deck
68
Use the following to answer the questions below:
For each of the following, find the standard error of the distribution of sample means. Use two decimal places when reporting your standard error.
-Samples of size 50 from a population with mean 450 and standard deviation 75.
For each of the following, find the standard error of the distribution of sample means. Use two decimal places when reporting your standard error.
-Samples of size 50 from a population with mean 450 and standard deviation 75.
Unlock Deck
Unlock for access to all 166 flashcards in this deck.
Unlock Deck
k this deck
69
Use the following to answer the questions below:
For each of the following, find the standard error of the distribution of sample means. Use two decimal places when reporting your standard error.
-Samples of size 25 from a population with mean 10 and standard deviation 2.
For each of the following, find the standard error of the distribution of sample means. Use two decimal places when reporting your standard error.
-Samples of size 25 from a population with mean 10 and standard deviation 2.
Unlock Deck
Unlock for access to all 166 flashcards in this deck.
Unlock Deck
k this deck
70
Use the following to answer the questions below:
For each of the following, find the standard error of the distribution of sample means. Use two decimal places when reporting your standard error.
-Samples of size 250 from a population with mean 80 and standard deviation of 15.
For each of the following, find the standard error of the distribution of sample means. Use two decimal places when reporting your standard error.
-Samples of size 250 from a population with mean 80 and standard deviation of 15.
Unlock Deck
Unlock for access to all 166 flashcards in this deck.
Unlock Deck
k this deck
71
Use the following to answer the questions below:
A dotplot and the summary statistics for a sample are provided. In each case, indicate whether or not it is appropriate to use the t-distribution.
-n = 12; = 4.75; s = 1.603
A dotplot and the summary statistics for a sample are provided. In each case, indicate whether or not it is appropriate to use the t-distribution.
-n = 12;
= 4.75; s = 1.603 Unlock Deck
Unlock for access to all 166 flashcards in this deck.
Unlock Deck
k this deck
72
Use the following to answer the questions below:
A dotplot and the summary statistics for a sample are provided. In each case, indicate whether or not it is appropriate to use the t-distribution.
-n = 10; = 7.80; s = 9.28
A dotplot and the summary statistics for a sample are provided. In each case, indicate whether or not it is appropriate to use the t-distribution.
-n = 10;
= 7.80; s = 9.28 Unlock Deck
Unlock for access to all 166 flashcards in this deck.
Unlock Deck
k this deck
73
Use the following to answer the questions below:
A dotplot and the summary statistics for a sample are provided. In each case, indicate whether or not it is appropriate to use the t-distribution.
-n = 100; = 9.93; s = 9.247
A dotplot and the summary statistics for a sample are provided. In each case, indicate whether or not it is appropriate to use the t-distribution.
-n = 100;
= 9.93; s = 9.247 Unlock Deck
Unlock for access to all 166 flashcards in this deck.
Unlock Deck
k this deck
74
Use the following to answer the questions below:
A dotplot and the summary statistics for a sample are provided. In each case, indicate whether or not it is appropriate to use the t-distribution.
-n = 15; = 44; s = 7.32
A dotplot and the summary statistics for a sample are provided. In each case, indicate whether or not it is appropriate to use the t-distribution.
-n = 15;
= 44; s = 7.32 Unlock Deck
Unlock for access to all 166 flashcards in this deck.
Unlock Deck
k this deck
75
Use the following to answer the questions below:
Many major television networks air coverage of the incoming election results during primetime hours. The provided boxplot displays the amount of time (in minutes) spent watching election coverage for a random sample of 25 U.S. adults. In this sample, the average time spent watching election coverage was 80.44 minutes with standard deviation of 43.99 minutes.
-Is it reasonable to use the t-distribution to construct a confidence interval for the average amount of time spent watching election coverage by U.S. adults?
Unlock Deck
Unlock for access to all 166 flashcards in this deck.
Unlock Deck
k this deck
76
Use the following to answer the questions below:
Many major television networks air coverage of the incoming election results during primetime hours. The provided boxplot displays the amount of time (in minutes) spent watching election coverage for a random sample of 25 U.S. adults. In this sample, the average time spent watching election coverage was 80.44 minutes with standard deviation of 43.99 minutes.
-Construct a 90% confidence interval for the average amount of time U.S. adults spent watching election coverage. Use two decimal places in your margin of error.
A) 65.39 to 95.49 hours
B) 66.24 to 94.64 hours
C) 68.14 to 92.74 hours
D) 71.33 to 89.55 hours
Unlock Deck
Unlock for access to all 166 flashcards in this deck.
Unlock Deck
k this deck
77
Use the following to answer the questions below:
Many major television networks air coverage of the incoming election results during primetime hours. The provided boxplot displays the amount of time (in minutes) spent watching election coverage for a random sample of 25 U.S. adults. In this sample, the average time spent watching election coverage was 80.44 minutes with standard deviation of 43.99 minutes.
-Construct a 90% confidence interval for the average amount of time U.S. adults spent watching election coverage. Provide an interpretation of your interval in the context of this data situation.
Unlock Deck
Unlock for access to all 166 flashcards in this deck.
Unlock Deck
k this deck
78
Use the following to answer the questions below:
Many major television networks air coverage of the incoming election results during primetime hours. The provided boxplot displays the amount of time (in minutes) spent watching election coverage for a random sample of 25 U.S. adults. In this sample, the average time spent watching election coverage was 80.44 minutes with standard deviation of 43.99 minutes.
-What sample size would we need to estimate the average amount of time U.S. adults watching election coverage with 99% confidence and a margin of error of ± 5 hours?
A) 514 U.S. adults
B) 23 U.S. adults
C) 22 U.S. adults
D) 513 U.S. adults
Unlock Deck
Unlock for access to all 166 flashcards in this deck.
Unlock Deck
k this deck
79
Use the following to answer the questions below:
Turkey is a staple at most traditional Thanksgiving dinners. A random sample of 12 grocery store customers were asked about the size of the turkey they were purchasing for Thanksgiving. The average weight was 13.9 pounds with a standard deviation of 2.2 pounds. The boxplot displays the distribution of the sample turkey weights.
?
-Is it reasonable to use the t-distribution to construct a confidence interval for the average weight of turkeys purchased at this store?
Unlock Deck
Unlock for access to all 166 flashcards in this deck.
Unlock Deck
k this deck
80
Use the following to answer the questions below:
Turkey is a staple at most traditional Thanksgiving dinners. A random sample of 12 grocery store customers were asked about the size of the turkey they were purchasing for Thanksgiving. The average weight was 13.9 pounds with a standard deviation of 2.2 pounds. The boxplot displays the distribution of the sample turkey weights.
?
-Construct a 99% confidence interval for the average weight of turkeys purchased at this store. Round your margin of error to two decimal places.
A) 11.93 to 15.87 pounds
B) 13.33 to 14.47 pounds
C) 12.57 to 15.23 pounds
D) 10.80 to 17.01 pounds
Unlock Deck
Unlock for access to all 166 flashcards in this deck.
Unlock Deck
k this deck
Unlock Deck
Unlock for access to all 166 flashcards in this deck.


