Exam 6: Inference for Means and Proportions
Exam 1: Collecting Data68 Questions
Exam 2: Describing Data127 Questions
Exam 3: Confidence Intervals149 Questions
Exam 4: Hypothesis Tests117 Questions
Exam 5: Approximating With a Distribution74 Questions
Exam 6: Inference for Means and Proportions166 Questions
Exam 7: CHI-Square Tests for Categorical Variables45 Questions
Exam 8: Anova to Compare Means53 Questions
Exam 9: Inference for Regression123 Questions
Exam 10: Multiple Regression72 Questions
Select questions type
 -What value is closest to the p-value for this test?
Free
(Multiple Choice)
4.8/5  (39)
(39)
Correct Answer: Verified
D
Use the following to answer questions 18-21:
In a survey of 7,786 randomly selected adults living in Germany, 5,840 said they exercised for at least 30 minutes three or more times per week.
-Verify that the sample is large enough to use the normal formula to find a confidence interval for the proportion of Germans who exercises for 30 minutes three or more times a week.
Free
(Essay)
4.7/5 (27)
Correct Answer:Verified
 = 5,840/7,786 =0.75
n  = 5,840 > 10, n (1 -
  ) = 1,946 > 10 <- Yes, we can use the normal formula.
Use the following to answer the questions below:
Consider taking random samples of size 30 from Population A with proportion 0.84 and random samples of size 60 from Population B with proportion 0.9.
-Find the mean of the distribution of differences in sample proportions,  -
-  .
.
Free
(Multiple Choice)
4.8/5 (46)
Correct Answer:Verified
C
Use the following to answer the questions below:
In a Gallup survey of 1,012 randomly selected U.S. adults (age 18 and over), 53% said that they were dissatisfied with the quality of education students receive in kindergarten through grade 12.
-Construct a 90% confidence interval for the proportion of U.S. adults who are dissatisfied with the quality of education students receive in kindergarten through grade 12. Provide an interpretation of your interval in the context of this data situation.
(Essay)
4.7/5 (32)
Use the following to answer the questions below:
Every year since the 1957-58 academic year, the National Science Foundation (NSF) conducts its Survey of Earned Doctorates (SED) of all individuals receiving research doctoral degrees from accredited U.S. institutions. The results from the 2010 survey published on the NSF website indicate that 78.2% of individuals earning their doctorate in the physical sciences have no graduate debt while 48.3% of those earning their doctorate in the social sciences have no graduate debt. Of the 48,069 research doctorates granted in 2010, 93% completed the SED, thus the information collected by the NSF can be good approximations of the population parameters.
-Suppose we take random samples of 50 individuals who earned a doctorate in the physical sciences (in 2010) and 25 individuals who earned a doctorate in the social sciences (in 2010). Find the mean and standard error (using four decimal places) of the distribution of differences in sample proportions
 and indicate if the sample sizes are large enough to use the Central Limit Theorem.
(Essay)
4.9/5 (35)
Use the following to answer the questions below:
In a survey conducted by the Gallup organization, 1,017 adults were asked "In general, how much trust and confidence do you have in the mass media - such as newspapers, TV, and radio - when it comes to reporting the news fully, accurately, and fairly?" Of the 1,017 respondents, 214 said they had "no confidence at all."
-What sample size is needed to reduce the margin of error to 1%?
(Multiple Choice)
4.7/5 (36)
Use the following to answer the questions below:
For each of the following, find the standard error of the distribution of sample means. Use two decimal places when reporting your standard error.
-Samples of size 250 from a population with mean 80 and standard deviation of 15.
(Short Answer)
4.9/5 (32)
Use the following to answer the questions below:
Admissions records at a small university indicates that 6.7% of the students enrolled are international students.
-For which sample sizes (n = 50, n = 100, and n = 200) would the Central Limit Theorem apply?
(Multiple Choice)
4.7/5 (25)
Use the following to answer the questions below:
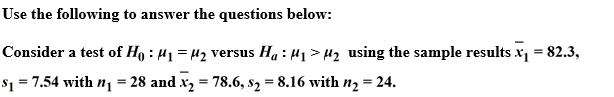
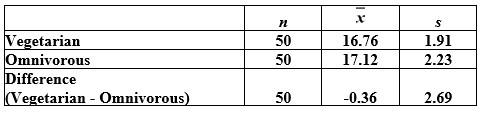
A 1997 study described in the European Journal of Clinical Nutrition compares the growth of vegetarian and omnivorous children, ages 7 - 11, in Northwest England. In the study, each of the 50 vegetarian children in the study was matched with an omnivorous child of the same age with similar demographic characteristics. One of the aspects on which the children were compared was their body mass index (BMI). The differences in BMI for each pair of children (one vegetarian and one omnivore) was computed as vegetarian BMI minus omnivore BMI.
 -Construct a 95% confidence interval for the difference in mean BMI between vegetarian and omnivorous children. Use three decimal places in your margin of error.
(Multiple Choice)
4.8/5 (26)
Use the following to answer the questions below:
The owner of a small pet supply store wants to open a second store in another city, but he only wants to do so if more than one-third of the city's households have pets (otherwise there won't be enough business). He selects a random sample of 150 households and finds that 64 have pets.
-Verify that the sample size is large enough to perform a test to compare the population proportion of households in the city with pets to the target.
(Essay)
4.8/5 (39)
Use the following to answer the questions below:
Consider taking random samples of size 50 from Population A with mean 15 and standard deviation 3 and random samples of size 75 from Population B with mean 10 and standard deviation 5.
-Find the standard error of the distribution of differences in sample means, 
(Multiple Choice)
4.8/5 (42)
Use the following to answer the questions below:
In a recent study, the Centers for Disease Control and Prevention reported that in a sample of 4,349 African Americans 31% were Vitamin D deficient. Overall, it is believed that Vitamin D deficiency affects 8% of all U.S. adults.
-Construct a 99% confidence interval for the proportion of African Americans with Vitamin D deficiency. Use three decimal places in your margin of error.
(Multiple Choice)
4.8/5 (33)
Use the following to answer the questions below:
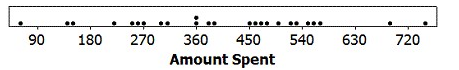
"Black Friday," which occurs annually the day after Thanksgiving, is one of the biggest shopping days of the year. During the holiday season, many stores created controversy by starting their mega-sales on Thanksgiving itself. In a random sample of 25 individuals who shopped during the Black Friday four-day weekend (Thursday - Sunday), the average amount spent was $399.40 with standard deviation $171.10. The data are displayed in the provided dotplot.
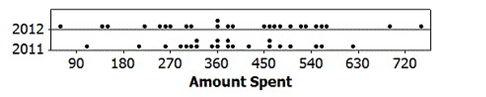
 -Suppose we know that in a random sample of n = 22 individuals who shopped over Black Friday weekend in 2011 the average amount spent was $381.30 with standard deviation $119.80. Recall that for the 2012 sample of 25 individuals, the average amount spent was $399.40 with standard deviation $171.10. Dotplots of both samples are provided.
(Essay)
4.8/5 (36)
Use the following to answer the questions below:
A 1997 study described in the European Journal of Clinical Nutrition compares the growth of vegetarian and omnivorous children, ages 7 - 11, in Northwest England. In the study, each of the 50 vegetarian children in the study was matched with an omnivorous child of the same age with similar demographic characteristics. One of the aspects on which the children were compared was their body mass index (BMI). The differences in BMI for each pair of children (one vegetarian and one omnivore) was computed as vegetarian BMI minus omnivore BMI.
-Which data analysis method is more appropriate in this situation: paired data difference in means or difference in means with two separate groups?
(Multiple Choice)
4.8/5 (34)
Use the following to answer the questions below:
Situations comparing two proportions are described. In each case, determine whether the situation involves comparing proportions for two groups or comparing two proportions from the same group.
-Comparing the proportion of milk chocolate M&M's that are blue to the proportion of dark chocolate M&M's that are blue.
(Multiple Choice)
4.8/5 (40)
Use the following to answer the questions below:
February 12, 2009 marked the anniversary of Charles Darwin's birth. To celebrate, Gallup, a national polling organization, surveyed 1,018 randomly selected American adults about their education level and their beliefs about the theory of evolution. In their sample, 325 of their respondents had some college education and 228 were college graduates. Among the 325 respondents with some college education, 133 said that they believed in the theory of evolution. Among the 228 respondents who were college graduates, 121 said that they believed in the theory of evolution.
-Construct a 90% confidence interval for the difference between the proportions of college graduates and individuals with some college who believe in the theory of evolution. Round your sample proportions and margin of error to three decimal places.
(Multiple Choice)
4.8/5 (43)
Use the following to answer the questions below:
Suppose that the makers of M&M's claim that 24% of their Milk Chocolate M&M's are blue.
-Assume that the bags of Milk Chocolate M&M's sold in vending machines have 55 candies. Find the standard error of the distribution of sample proportions of blue candies for vending machine bags (i.e., samples of size 55). Use four decimal places when reporting the standard error.
(Short Answer)
4.9/5 (30)
Use the following to answer the questions below:
A small university is trying to monitor its electricity usage. For a random sample of 30 weekend days (Saturdays and Sundays), the student center used an average of 94.26 kilowatt hours (kWh) with standard deviation 43.29. For a random sample of 60 weekdays, (Monday - Friday), the student center used an average of 112.63 kWh with standard deviation 32.07.
-Test, at the 5% level, if significantly more electricity is used at the student center, on average, on weekdays than weekend days. Include all details of the test.
(Essay)
4.8/5 (28)
Filters
- Essay(0)
- Multiple Choice(0)
- Short Answer(0)
- True False(0)
- Matching(0)