Deck 4: Hypothesis Tests
Full screen (f)
Question
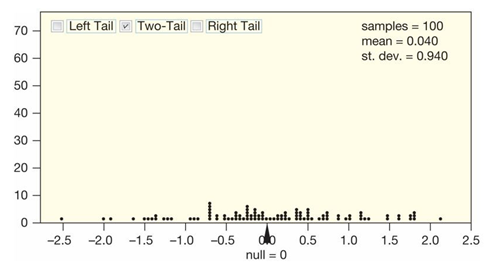
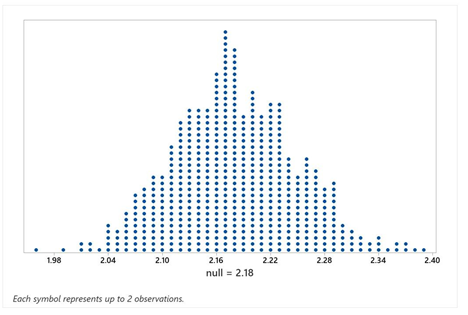
The following figure shows a randomization distribution for the hypotheses  versus
  The statistic used for each sample is
  Which of the two possible sample results provides the most evidence against
  ?
?
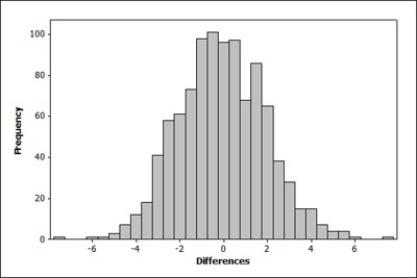
A) = 56.5;
  = 51.3
B) = 50.2;
  = 53.1
versus The statistic used for each sample is Which of the two possible sample results provides the most evidence against ?A)
= 56.5; = 51.3B)
= 50.2; = 53.1 Question
The average SAT-Critical Reading score for college bound students taking the exam in the 2018-2019 academic year was 501 531. A highly selective university wants to know if their 2020 incoming class had an average SAT-Critical Reading score that was higher than the national average. Which of the following possible samples provides the most evidence for this claim?
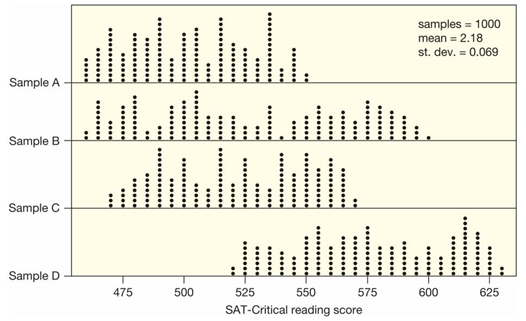
A) Sample A
B) Sample B
C) Sample C
D) Sample D
A) Sample A
B) Sample B
C) Sample C
D) Sample D
Question
Question
Identify the error in the following hypotheses:  versus
versus Question
Identify the error in the following hypotheses: of  versus
versus Question
Identify the error in the following hypotheses:  versus
versus Question
Which of the following samples provides the most evidence that the amount of time spent studying for an exam and the grade on the exam are positively correlated?
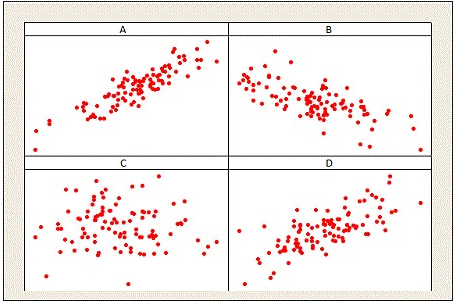
A) Sample A
B) Sample B
C) Sample C
D) Sample D
A) Sample A
B) Sample B
C) Sample C
D) Sample D
Question
Question
Of the two p-values, which provides more evidence against  ?
?
A) p-value = 0.49
B) p-value = 0.007
?A) p-value = 0.49
B) p-value = 0.007
Question
- p-value = 0.72
A)
 0.42
0.42B)
 0.38
0.38C)
 0.51
0.51D)
 0.46
0.46 Question
- p-value = 0.293
A)
 0.42
0.42B)
 0.38
0.38C)
 0.51
0.51D)
 0.46
0.46 Question
- p-value = 0.138
A)
 0.42
0.42B)
 0.38
0.38C)
 0.51
0.51D)
 0.46
0.46 Question
- p-value = 0.019
A)
 0.42
0.42B)
 0.38
0.38C)
 0.51
0.51D)
 0.46
0.46 Question
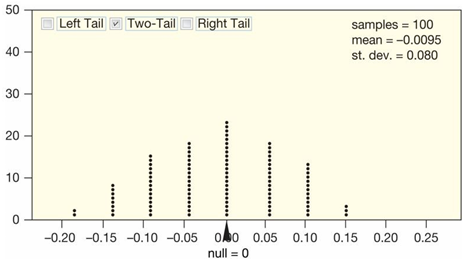
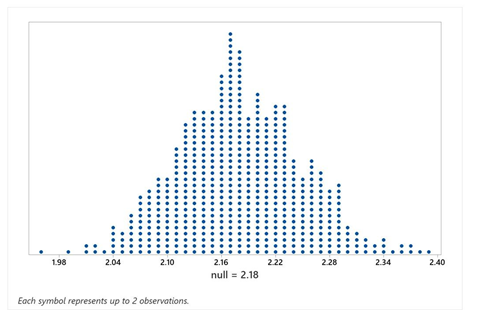
The randomization distribution for testing the hypotheses  versus
  is provided. The sample statistic is
  Use the provided randomization distribution (based on 100 samples) to estimate the p-value for this test.
versus is provided. The sample statistic is Use the provided randomization distribution (based on 100 samples) to estimate the p-value for this test. Question
The provided figure displays the randomization distribution for testing  versus
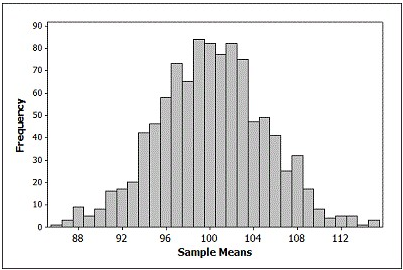
The p-value for the sample mean = 112 is closest to
A) 0.01
B) 0.25
versus The p-value for the sample mean
= 112 is closest toA) 0.01
B) 0.25
Question
Question
Question
Question
Using a significance level of 5%, the appropriate conclusion for a test with a p-value of 0.0421 would be:
A) Reject
B) Do not reject
A) Reject
B) Do not reject
Question
Question
Question
Question
Question
Question
Question
Question
Question
It is of interest to test the hypotheses  : p = 0.8 versus
  The sample outcome, based on
  observations, is
  and the randomization statistic to be calculated is
  . The p-value for this test was found to be 0.322. If the test was performed correctly, where should the randomization distribution be centered?
A) 0.7
B) 10
C) 0.8
D) 0.322
: p = 0.8 versus The sample outcome, based on observations, is and the randomization statistic to be calculated is . The p-value for this test was found to be 0.322. If the test was performed correctly, where should the randomization distribution be centered?A) 0.7
B) 10
C) 0.8
D) 0.322
Question
Question
Question
The null and alternative hypotheses for a test are  vs.
vs.  Give the notation for a sample statistic we might record for each simulated sample to create the randomization distribution.
A)
B) p
C)
D)
vs. Give the notation for a sample statistic we might record for each simulated sample to create the randomization distribution.A)
B) p
C)
D)
Question
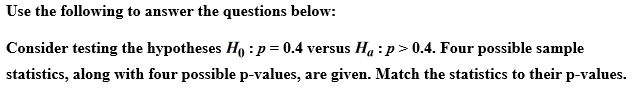
Use the following to answer the questions below:
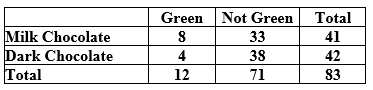
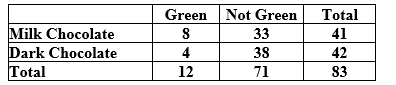
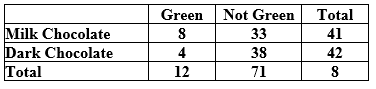
A student in an introductory statistics course investigated if there is evidence that the proportion of milk chocolate M&M's that are green differs from the proportion of dark chocolate M&M's that are green. She purchased a bag of each variety, and her data are summarized in the following table.
-Describe how you would generate a single randomization sample in this situation, and identify (using the appropriate notation) the sample statistic you would record for each sample.
Question
Use the following to answer the questions below:
A student in an introductory statistics course investigated if there is evidence that the proportion of milk chocolate M&M's that are green differs from the proportion of dark chocolate M&M's that are green. She purchased a bag of each variety, and her data are summarized in the following table.
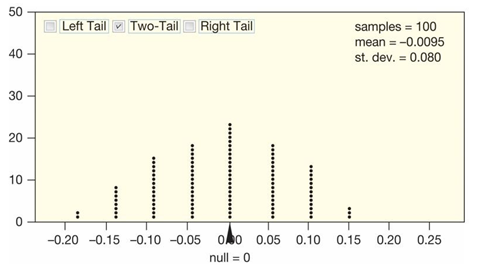
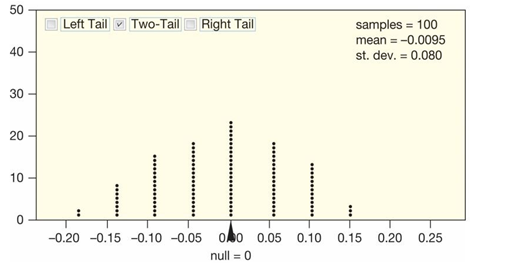
-Use the provided randomization distribution (based on 100 samples) to test if this sample provides evidence that the proportion of candies that are green differs for the two types of M&M's. Include an assessment of the strength of your evidence.
A student in an introductory statistics course investigated if there is evidence that the proportion of milk chocolate M&M's that are green differs from the proportion of dark chocolate M&M's that are green. She purchased a bag of each variety, and her data are summarized in the following table.
-Use the provided randomization distribution (based on 100 samples) to test if this sample provides evidence that the proportion of candies that are green differs for the two types of M&M's. Include an assessment of the strength of your evidence.
Question
Use the following to answer the questions below:
A student in an introductory statistics course investigated if there is evidence that the proportion of milk chocolate M&M's that are green differs from the proportion of dark chocolate M&M's that are green. She purchased a bag of each variety, and her data are summarized in the following table.
-Use technology and the provided data to test if this sample provides evidence that the proportion of candies that are green differs for the two types of M&M's. Include an assessment of the strength of your evidence.
Question
Use the following to answer the questions below:
A student in an introductory statistics course investigated if there is evidence that the proportion of milk chocolate M&M's that are green differs from the proportion of dark chocolate M&M's that are green. She purchased a bag of each variety, and her data are summarized in the following table.
-Define the appropriate parameter(s) and state the hypotheses for testing if the proportion of green M&M's differs for milk chocolate and dark chocolate M&M's.
Question
Use the following to answer the questions below:
A student in an introductory statistics course investigated if there is evidence that the proportion of milk chocolate M&M's that are green differs from the proportion of dark chocolate M&M's that are green. She purchased a bag of each variety, and her data are summarized in the following table.
-Describe how you would generate a single randomization sample in this situation, and identify (using the appropriate notation) the sample statistic you would record for each sample.
Question
Use the following to answer the questions below:
A student in an introductory statistics course investigated if there is evidence that the proportion of milk chocolate M&M's that are green differs from the proportion of dark chocolate M&M's that are green. She purchased a bag of each variety, and her data are summarized in the following table.
-Use technology to create a randomization distribution with at least 1,000 values for testing these hypotheses. Use your randomization distribution to estimate the p-value for this sample.
Question
Use the following to answer the questions below:
A student in an introductory statistics course investigated if there is evidence that the proportion of milk chocolate M&M's that are green differs from the proportion of dark chocolate M&M's that are green. She purchased a bag of each variety, and her data are summarized in the following table.
-Use technology to create a randomization distribution with at least 1,000 values for testing these hypotheses and estimate the p-value. Use your p-value to make a decision about these hypotheses. Be sure to word your decision in the context of the problem. Include an assessment of the strength of your evidence.
Question
Use the following to answer the questions below
A student in an introductory statistics course investigated if there is evidence that the proportion of milk chocolate M&M's that are green differs from the proportion of dark chocolate M&M's that are green. She purchased a bag of each variety, and her data are summarized in the following table.
-Define the appropriate parameter(s) and state the hypotheses for testing if the proportion of green M&M's differs for milk chocolate and dark chocolate M&M's.
Question
Use the following to answer the questions below
A student in an introductory statistics course investigated if there is evidence that the proportion of milk chocolate M&M's that are green differs from the proportion of dark chocolate M&M's that are green. She purchased a bag of each variety, and her data are summarized in the following table.
-Describe how you would generate a single randomization sample in this situation, and identify (using the appropriate notation) the sample statistic you would record for each sample.
Question
Use the following to answer the questions below
A student in an introductory statistics course investigated if there is evidence that the proportion of milk chocolate M&M's that are green differs from the proportion of dark chocolate M&M's that are green. She purchased a bag of each variety, and her data are summarized in the following table.
-Use the provided randomization distribution (based on 100 samples) to estimate the p-value for this sample.
Question
Use the following to answer the questions below
A student in an introductory statistics course investigated if there is evidence that the proportion of milk chocolate M&M's that are green differs from the proportion of dark chocolate M&M's that are green. She purchased a bag of each variety, and her data are summarized in the following table.
-Use the provided randomization distribution (based on 100 samples) to estimate the p-value for this sample. Use your p-value to make a decision about these hypotheses. Be sure to word your decision in the context of the problem. Include an assessment of the strength of your evidence.
Question
Use the following to answer the questions below:
-Describe how you could generate a single randomization sample in this situation, and identify (using the appropriate notation) the sample statistic you would record for each sample.
-Describe how you could generate a single randomization sample in this situation, and identify (using the appropriate notation) the sample statistic you would record for each sample.
Question
Use the following to answer the questions below:
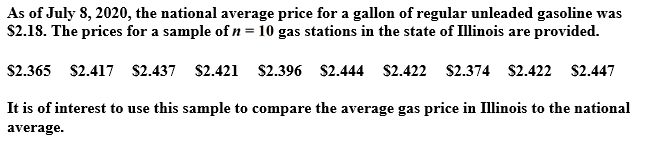
-Use the provided randomization distribution (based on 1,000 samples) to test if this sample provides evidence that the average gas price in Illinois exceeds the national average. Include an assessment of the strength of your evidence.
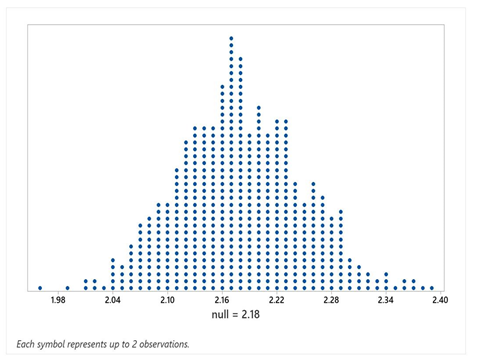
-Use the provided randomization distribution (based on 1,000 samples) to test if this sample provides evidence that the average gas price in Illinois exceeds the national average. Include an assessment of the strength of your evidence.
Question
Use the following to answer the questions below:
-Use technology and the provided data to test if this sample provides evidence that the average gas price in Illinois exceeds the national average. Include an assessment of the strength of your evidence.
-Use technology and the provided data to test if this sample provides evidence that the average gas price in Illinois exceeds the national average. Include an assessment of the strength of your evidence.
Question
Use the following to answer the questions below:
-Define the appropriate parameter(s) and state the hypotheses for testing if this sample provides evidence that the average gas price in Illinois exceeds the national average.
A)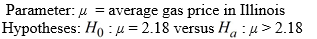
B)
C)
D)
-Define the appropriate parameter(s) and state the hypotheses for testing if this sample provides evidence that the average gas price in Illinois exceeds the national average.
A)
B)
C)
D)
Question
Use the following to answer the questions below:
-Describe how you would generate a single randomization sample in this situation, and identify (using the appropriate notation) the sample statistic you would record for each sample.
-Describe how you would generate a single randomization sample in this situation, and identify (using the appropriate notation) the sample statistic you would record for each sample.
Question
Use the following to answer the questions below:
-Use technology to create a randomization distribution with at least 1,000 values for testing these hypotheses. Use your randomization distribution to estimate the p-value for this sample.
-Use technology to create a randomization distribution with at least 1,000 values for testing these hypotheses. Use your randomization distribution to estimate the p-value for this sample.
Question
Use the following to answer the questions below:
-Use technology to create a randomization distribution with at least 1,000 values for testing these hypotheses and estimate the p-value. Use your p-value to make a decision about these hypotheses. Be sure to word your decision in the context of the problem. Include an assessment of the strength of your evidence.
-Use technology to create a randomization distribution with at least 1,000 values for testing these hypotheses and estimate the p-value. Use your p-value to make a decision about these hypotheses. Be sure to word your decision in the context of the problem. Include an assessment of the strength of your evidence.
Question
Use the following to answer the questions below:
-Define the appropriate parameter(s) and state the hypotheses for testing if this sample provides evidence that the average gas price in Illinois exceeds the national average.
A)
B)
C)
D)
-Define the appropriate parameter(s) and state the hypotheses for testing if this sample provides evidence that the average gas price in Illinois exceeds the national average.
A)
B)
C)
D)
Question
Use the following to answer the questions below:
-Describe how you would generate a single randomization sample in this situation, and identify (using the appropriate notation) the sample statistic you would record for each sample.
-Describe how you would generate a single randomization sample in this situation, and identify (using the appropriate notation) the sample statistic you would record for each sample.
Question
Use the following to answer the questions below:
-Use the provided randomization distribution (based on 1,000 samples) to estimate the p-value for this sample.
-Use the provided randomization distribution (based on 1,000 samples) to estimate the p-value for this sample.
Question
Use the following to answer the questions below:
-Use the provided randomization distribution (based on 1,000 samples) to estimate the p-value for this sample. Use your p-value to make a decision about these hypotheses. Be sure to word your decision in the context of the problem. Include an assessment of the strength of your evidence.
-Use the provided randomization distribution (based on 1,000 samples) to estimate the p-value for this sample. Use your p-value to make a decision about these hypotheses. Be sure to word your decision in the context of the problem. Include an assessment of the strength of your evidence.
Question
Use the following to answer the questions below:
-The provided histogram displays the prices (in thousands of dollars) of 25 homes sold in 2019 in a Midwestern city.
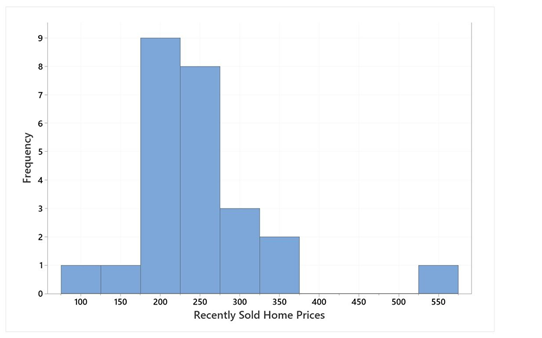
In general, this shape, right skewed with some unusually high values, is common for describing home values in many cities. For this reason, the median home value for a city is a useful parameter. This sample of recently sold homes had a median price (value) of $232,500. Someone considering moving to this city is interested in knowing if the median home value is more than $200,000.
Describe how you would generate a single randomization sample in this situation, and identify the statistic you would calculate from the sample.
-The provided histogram displays the prices (in thousands of dollars) of 25 homes sold in 2019 in a Midwestern city.
In general, this shape, right skewed with some unusually high values, is common for describing home values in many cities. For this reason, the median home value for a city is a useful parameter. This sample of recently sold homes had a median price (value) of $232,500. Someone considering moving to this city is interested in knowing if the median home value is more than $200,000.
Describe how you would generate a single randomization sample in this situation, and identify the statistic you would calculate from the sample.
Question
Question
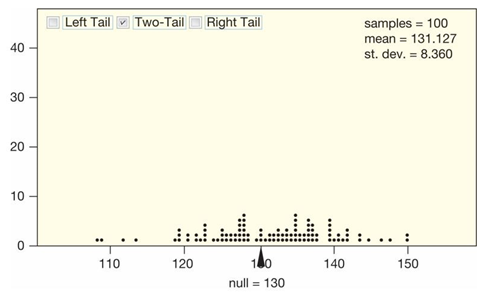
Use the following to answer the questions below:
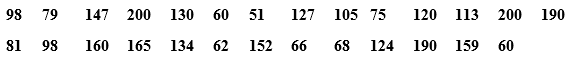
A certain species of tree has an average life span of 130 years. A researcher has noticed a large number of trees of this species washing up along a beach as driftwood. She takes core samples from 27 of those trees to count the number of rings and measure the widths of the rings. Counting the rings allows the researcher to determine the age of each tree. The average age of the trees in the sample is about 120 years. One of her interests is determining if this sample provides evidence that the average age of the driftwood is less than the 130 year life span expected for this type of tree. If the average age is less than 130 years it might suggest that the trees have died from unusual causes, such as invasive beetles or logging.
-Use the provided randomization distribution (based on 100 samples) to determine if this sample provides evidence that the average age of the driftwood along this beach is less than 130 years. Use a 5% significance level to make your conclusion.
Question
Use the following to answer the questions below:
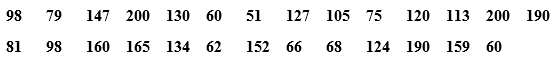
A certain species of tree has an average life span of 130 years. A researcher has noticed a large number of trees of this species washing up along a beach as driftwood. She takes core samples from 27 of those trees to count the number of rings and measure the widths of the rings. Counting the rings allows the researcher to determine the age of each tree. Her data are displayed in the provided table. One of her interests is determining if this sample provides evidence that the average age of the driftwood is less than the 130 year life span expected for this type of tree. If the average age is less than 130 years it might suggest that the trees have died from unusual causes, such as invasive beetles or logging.
-Describe how you would generate a single randomization sample in this situation, and identify the statistic you would calculate for each sample.
Question
Use the following to answer the questions below:
A certain species of tree has an average life span of 130 years. A researcher has noticed a large number of trees of this species washing up along a beach as driftwood. She takes core samples from 27 of those trees to count the number of rings and measure the widths of the rings. Counting the rings allows the researcher to determine the age of each tree. Her data are displayed in the provided table. One of her interests is determining if this sample provides evidence that the average age of the driftwood is less than the 130 year life span expected for this type of tree. If the average age is less than 130 years it might suggest that the trees have died from unusual causes, such as invasive beetles or logging.
-Use technology and the provided data to determine if this sample provides evidence that the average age of the driftwood along this beach is less than 130 years. Use a 5% significance level to make your conclusion.
Question
Use the following to answer the questions below:
A certain species of tree has an average life span of 130 years. A researcher has noticed a large number of trees of this species washing up along a beach as driftwood. She takes core samples from 27 of those trees to count the number of rings and measure the widths of the rings. Counting the rings allows the researcher to determine the age of each tree. The average age of the trees in the sample is approximately 120 years. One of her interests is determining if this sample provides evidence that the average age of the driftwood is less than the 130 year life span expected for this type of tree. If the average age is less than 130 years it might suggest that the trees have died from unusual causes, such as invasive beetles or logging.
-Define the appropriate parameter(s) and state the hypotheses for testing if this sample provides evidence that the average age of the driftwood along this beach is less than 130 years.
A)
B)
C)
D)
Question
Question
Use the following to answer the questions below:
A certain species of tree has an average life span of 130 years. A researcher has noticed a large number of trees of this species washing up along a beach as driftwood. She takes core samples from 27 of those trees to count the number of rings and measure the widths of the rings. Counting the rings allows the researcher to determine the age of each tree. The average age of the trees in the sample is approximately 120 years. One of her interests is determining if this sample provides evidence that the average age of the driftwood is less than the 130 year life span expected for this type of tree. If the average age is less than 130 years it might suggest that the trees have died from unusual causes, such as invasive beetles or logging.
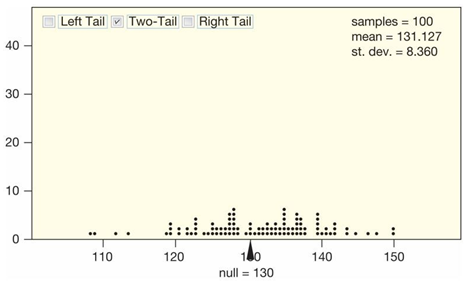
-Use the provided randomization distribution (based on 100 samples) to estimate the p-value for this sample.

A certain species of tree has an average life span of 130 years. A researcher has noticed a large number of trees of this species washing up along a beach as driftwood. She takes core samples from 27 of those trees to count the number of rings and measure the widths of the rings. Counting the rings allows the researcher to determine the age of each tree. The average age of the trees in the sample is approximately 120 years. One of her interests is determining if this sample provides evidence that the average age of the driftwood is less than the 130 year life span expected for this type of tree. If the average age is less than 130 years it might suggest that the trees have died from unusual causes, such as invasive beetles or logging.
-Use the provided randomization distribution (based on 100 samples) to estimate the p-value for this sample.
Question
Use the following to answer the questions below:
A certain species of tree has an average life span of 130 years. A researcher has noticed a large number of trees of this species washing up along a beach as driftwood. She takes core samples from 27 of those trees to count the number of rings and measure the widths of the rings. Counting the rings allows the researcher to determine the age of each tree. The average age of the trees in the sample is approximately 120 years. One of her interests is determining if this sample provides evidence that the average age of the driftwood is less than the 130 year life span expected for this type of tree. If the average age is less than 130 years it might suggest that the trees have died from unusual causes, such as invasive beetles or logging.
-Use the provided randomization distribution (based on 100 samples) to estimate the p-value for this sample. Use your p-value and a 5% significance level to make a decision about these hypotheses. Be sure to word your decision in the context of the problem.
Question
Use the following to answer the questions below:
A certain species of tree has an average life span of 130 years. A researcher has noticed a large number of trees of this species washing up along a beach as driftwood. She takes core samples from 27 of those trees to count the number of rings and measure the widths of the rings. Counting the rings allows the researcher to determine the age of each tree. The average age of the trees in the sample is approximately 120 years. One of her interests is determining if this sample provides evidence that the average age of the driftwood is less than the 130 year life span expected for this type of tree. If the average age is less than 130 years it might suggest that the trees have died from unusual causes, such as invasive beetles or logging.
-Use the provided randomization distribution (based on 100 samples) to estimate the p-value for this sample. What conclusion would you make at the 10% significance level?
Question
Use the following to answer the questions below:
A certain species of tree has an average life span of 130 years. A researcher has noticed a large number of trees of this species washing up along a beach as driftwood. She takes core samples from 27 of those trees to count the number of rings and measure the widths of the rings. Counting the rings allows the researcher to determine the age of each tree. Her data are displayed in the provided table. One of her interests is determining if this sample provides evidence that the average age of the driftwood is less than the 130 year life span expected for this type of tree. If the average age is less than 130 years it might suggest that the trees have died from unusual causes, such as invasive beetles or logging.
-Define the appropriate parameter(s) and state the hypotheses for testing if this sample provides evidence that the average age of the driftwood along this beach is less than 130 years.
A)
B)
C)
D)
Question
Use the following to answer the questions below:
A certain species of tree has an average life span of 130 years. A researcher has noticed a large number of trees of this species washing up along a beach as driftwood. She takes core samples from 27 of those trees to count the number of rings and measure the widths of the rings. Counting the rings allows the researcher to determine the age of each tree. Her data are displayed in the provided table. One of her interests is determining if this sample provides evidence that the average age of the driftwood is less than the 130 year life span expected for this type of tree. If the average age is less than 130 years it might suggest that the trees have died from unusual causes, such as invasive beetles or logging.
-Describe how you would generate a single randomization sample in this situation, and identify (using the appropriate notation) the sample statistic you would record for each sample.
Question
Use the following to answer the questions below:
A certain species of tree has an average life span of 130 years. A researcher has noticed a large number of trees of this species washing up along a beach as driftwood. She takes core samples from 27 of those trees to count the number of rings and measure the widths of the rings. Counting the rings allows the researcher to determine the age of each tree. Her data are displayed in the provided table. One of her interests is determining if this sample provides evidence that the average age of the driftwood is less than the 130 year life span expected for this type of tree. If the average age is less than 130 years it might suggest that the trees have died from unusual causes, such as invasive beetles or logging.
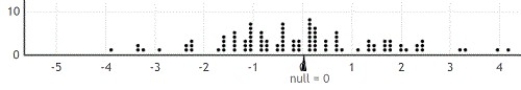
-Use technology to create a randomization distribution with at least 1,000 values for testing these hypotheses. Use your randomization distribution to estimate the p-value for this sample.
A certain species of tree has an average life span of 130 years. A researcher has noticed a large number of trees of this species washing up along a beach as driftwood. She takes core samples from 27 of those trees to count the number of rings and measure the widths of the rings. Counting the rings allows the researcher to determine the age of each tree. Her data are displayed in the provided table. One of her interests is determining if this sample provides evidence that the average age of the driftwood is less than the 130 year life span expected for this type of tree. If the average age is less than 130 years it might suggest that the trees have died from unusual causes, such as invasive beetles or logging.
-Use technology to create a randomization distribution with at least 1,000 values for testing these hypotheses. Use your randomization distribution to estimate the p-value for this sample.
Question
Use the following to answer the questions below:
A certain species of tree has an average life span of 130 years. A researcher has noticed a large number of trees of this species washing up along a beach as driftwood. She takes core samples from 27 of those trees to count the number of rings and measure the widths of the rings. Counting the rings allows the researcher to determine the age of each tree. Her data are displayed in the provided table. One of her interests is determining if this sample provides evidence that the average age of the driftwood is less than the 130 year life span expected for this type of tree. If the average age is less than 130 years it might suggest that the trees have died from unusual causes, such as invasive beetles or logging.
-Use technology to create a randomization distribution with at least 1,000 values for testing these hypotheses and estimate the p-value. Use your p-value and a 5% significance level to make a decision about these hypotheses. Be sure to word your decision in the context of the problem.
Question
Use the following to answer the questions below:
A certain species of tree has an average life span of 130 years. A researcher has noticed a large number of trees of this species washing up along a beach as driftwood. She takes core samples from 27 of those trees to count the number of rings and measure the widths of the rings. Counting the rings allows the researcher to determine the age of each tree. Her data are displayed in the provided table. One of her interests is determining if this sample provides evidence that the average age of the driftwood is less than the 130 year life span expected for this type of tree. If the average age is less than 130 years it might suggest that the trees have died from unusual causes, such as invasive beetles or logging.
-Use technology to create a randomization distribution with at least 1,000 values for testing these hypotheses and estimate the p-value. What conclusion would you make at the 10% significance level?
Question
Use the following to answer the questions below:
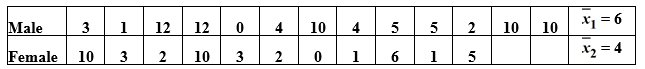
There are 24 students enrolled in an introductory statistics class at a small university. As an in-class exercise the students were asked how many hours of television they watch each week. Their responses, broken down by gender, are summarized in the provided table. Assume that the students enrolled in the statistics class are representative of all students at the university.

-Does this sample provide evidence that, on average, male students watch more television than female students at this university? Describe how you could generate a single randomization sample in this situation, and identify the statistic that you would calculate for each sample.
There are 24 students enrolled in an introductory statistics class at a small university. As an in-class exercise the students were asked how many hours of television they watch each week. Their responses, broken down by gender, are summarized in the provided table. Assume that the students enrolled in the statistics class are representative of all students at the university.
-Does this sample provide evidence that, on average, male students watch more television than female students at this university? Describe how you could generate a single randomization sample in this situation, and identify the statistic that you would calculate for each sample.
Question
Use the following to answer the questions below:
There are 24 students enrolled in an introductory statistics class at a small university. As an in-class exercise the students were asked how many hours of television they watch each week. Their responses, broken down by gender, are summarized in the provided table. Assume that the students enrolled in the statistics class are representative of all students at the university.
-Use technology to determine if this sample provides evidence that, on average, male students watch more television than female students at this university. Include an assessment of the strength of the evidence.
Question
Use the following to answer the questions below:
There are 24 students enrolled in an introductory statistics class at a small university. As an in-class exercise the students were asked how many hours of television they watch each week. Their responses, broken down by gender, are summarized in the provided table. Assume that the students enrolled in the statistics class are representative of all students at the university.
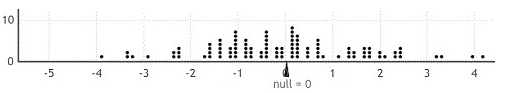
-Use the provided randomization distribution (based on 100 samples) to determine if this sample provides evidence that, on average, male students watch more television than female students at this university. Include an assessment of the strength of the evidence.
There are 24 students enrolled in an introductory statistics class at a small university. As an in-class exercise the students were asked how many hours of television they watch each week. Their responses, broken down by gender, are summarized in the provided table. Assume that the students enrolled in the statistics class are representative of all students at the university.
-Use the provided randomization distribution (based on 100 samples) to determine if this sample provides evidence that, on average, male students watch more television than female students at this university. Include an assessment of the strength of the evidence.
Question
Use the following to answer the questions below:
There are 24 students enrolled in an introductory statistics class at a small university. As an in-class exercise the students were asked how many hours of television they watch each week. Their responses, broken down by gender, are summarized in the provided table. Assume that the students enrolled in the statistics class are representative of all students at the university.
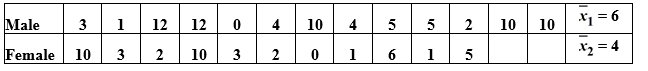
-Define the appropriate parameter(s) and state the hypotheses for testing if this sample provides evidence that, on average, male students watch more television than female students at this university.
A)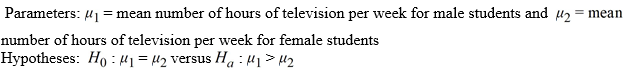
B)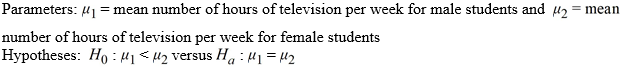
C)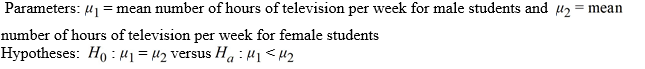
D)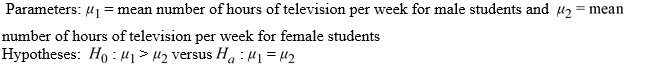
There are 24 students enrolled in an introductory statistics class at a small university. As an in-class exercise the students were asked how many hours of television they watch each week. Their responses, broken down by gender, are summarized in the provided table. Assume that the students enrolled in the statistics class are representative of all students at the university.
-Define the appropriate parameter(s) and state the hypotheses for testing if this sample provides evidence that, on average, male students watch more television than female students at this university.
A)
B)
C)
D)
Question
Use the following to answer the questions below:
There are 24 students enrolled in an introductory statistics class at a small university. As an in-class exercise the students were asked how many hours of television they watch each week. Their responses, broken down by gender, are summarized in the provided table. Assume that the students enrolled in the statistics class are representative of all students at the university.
-Describe how you would generate a single randomization sample in this situation, and identify (using the appropriate notation) the sample statistic you would record for each sample.
Question
Use the following to answer the questions below:
There are 24 students enrolled in an introductory statistics class at a small university. As an in-class exercise the students were asked how many hours of television they watch each week. Their responses, broken down by gender, are summarized in the provided table. Assume that the students enrolled in the statistics class are representative of all students at the university.
-Use the provided randomization distribution (based on 100 samples) to estimate the p-value for this sample.
Question
Use the following to answer the questions below:
There are 24 students enrolled in an introductory statistics class at a small university. As an in-class exercise the students were asked how many hours of television they watch each week. Their responses, broken down by gender, are summarized in the provided table. Assume that the students enrolled in the statistics class are representative of all students at the university.
-Use the provided randomization distribution (based on 100 samples) to estimate the p-value for this sample. Use your p-value to make a decision about these hypotheses. Be sure to word your decision in the context of the problem.
A) This sample provides no evidence that male students watch more television each week than female students at this university.
B) This sample provides strong evidence that male students watch more television each week than female students at this university.
Question
Use the following to answer the questions below:
There are 24 students enrolled in an introductory statistics class at a small university. As an in-class exercise the students were asked how many hours of television they watch each week. Their responses, broken down by gender, are summarized in the provided table. Assume that the students enrolled in the statistics class are representative of all students at the university.
-Define the appropriate parameter(s) and state the hypotheses for testing if this sample provides evidence that, on average, male students watch more television than female students at this university.
Question
Use the following to answer the questions below:
There are 24 students enrolled in an introductory statistics class at a small university. As an in-class exercise the students were asked how many hours of television they watch each week. Their responses, broken down by gender, are summarized in the provided table. Assume that the students enrolled in the statistics class are representative of all students at the university.
-Describe how you would generate a single randomization sample in this situation, and identify (using the appropriate notation) the sample statistic you would record for each sample.
Question
Use the following to answer the questions below:
There are 24 students enrolled in an introductory statistics class at a small university. As an in-class exercise the students were asked how many hours of television they watch each week. Their responses, broken down by gender, are summarized in the provided table. Assume that the students enrolled in the statistics class are representative of all students at the university.
-Use technology to create a randomization distribution with at least 1,000 values for testing these hypotheses. Use your randomization distribution to estimate the p-value for this sample.
Question
Use the following to answer the questions below:
There are 24 students enrolled in an introductory statistics class at a small university. As an in-class exercise the students were asked how many hours of television they watch each week. Their responses, broken down by gender, are summarized in the provided table. Assume that the students enrolled in the statistics class are representative of all students at the university.
-Use technology to create a randomization distribution with at least 1,000 values for testing these hypotheses and estimate the p-value. Use your p-value to make a decision about these hypotheses. Be sure to word your decision in the context of the problem.
A) This sample provides no evidence that male students watch more television each week than female students at this university.
B) This sample provides strong evidence that male students watch more television each week than female students at this university.
Question

Unlock Deck
Sign up to unlock the cards in this deck!
Unlock Deck
Unlock Deck
1/117
Play
Full screen (f)
Deck 4: Hypothesis Tests
1
The following figure shows a randomization distribution for the hypotheses versus The statistic used for each sample is Which of the two possible sample results provides the most evidence against ?
A) = 56.5; = 51.3
B) = 50.2; = 53.1
versus The statistic used for each sample is Which of the two possible sample results provides the most evidence against ?A)
= 56.5; = 51.3B)
= 50.2; = 53.1 = 56.5; = 51.3 2
The average SAT-Critical Reading score for college bound students taking the exam in the 2018-2019 academic year was 501 531. A highly selective university wants to know if their 2020 incoming class had an average SAT-Critical Reading score that was higher than the national average. Which of the following possible samples provides the most evidence for this claim?
A) Sample A
B) Sample B
C) Sample C
D) Sample D
A) Sample A
B) Sample B
C) Sample C
D) Sample D
Sample D
3
A statistical test uses data from a sample to assess a claim about a population.
True
4
Identify the error in the following hypotheses: versus
versus Unlock Deck
Unlock for access to all 117 flashcards in this deck.
Unlock Deck
k this deck
5
Identify the error in the following hypotheses: of versus
versus Unlock Deck
Unlock for access to all 117 flashcards in this deck.
Unlock Deck
k this deck
6
Identify the error in the following hypotheses: versus
versus Unlock Deck
Unlock for access to all 117 flashcards in this deck.
Unlock Deck
k this deck
7
Which of the following samples provides the most evidence that the amount of time spent studying for an exam and the grade on the exam are positively correlated?
A) Sample A
B) Sample B
C) Sample C
D) Sample D
A) Sample A
B) Sample B
C) Sample C
D) Sample D
Unlock Deck
Unlock for access to all 117 flashcards in this deck.
Unlock Deck
k this deck
8
Use the following to answer the questions below:
A study described in Attention, Perception, and Psychophysics investigated the impacts of multi-tasking on people who play video games and those who don't. Participants in the study were asked to perform three visually demanding tasks with (dual-task) and without (single-task) answering unrelated questions over the phone. One of the tasks involved tracking multiple circles moving around on a computer monitor. At the 5% significance level, the authors of the study concluded "tracking accuracy was significantly worse in the dual-task condition" for both people who play video games and those who do not.
-What does the phrase "significantly worse" mean in this context?
Unlock Deck
Unlock for access to all 117 flashcards in this deck.
Unlock Deck
k this deck
9
Of the two p-values, which provides more evidence against ?
A) p-value = 0.49
B) p-value = 0.007
?A) p-value = 0.49
B) p-value = 0.007
Unlock Deck
Unlock for access to all 117 flashcards in this deck.
Unlock Deck
k this deck
10
- p-value = 0.72
A)
0.42B)
0.38C)
0.51D)
0.46 Unlock Deck
Unlock for access to all 117 flashcards in this deck.
Unlock Deck
k this deck
11
- p-value = 0.293
A)
0.42B)
0.38C)
0.51D)
0.46 Unlock Deck
Unlock for access to all 117 flashcards in this deck.
Unlock Deck
k this deck
12
- p-value = 0.138
A)
0.42B)
0.38C)
0.51D)
0.46 Unlock Deck
Unlock for access to all 117 flashcards in this deck.
Unlock Deck
k this deck
13
- p-value = 0.019
A)
0.42B)
0.38C)
0.51D)
0.46 Unlock Deck
Unlock for access to all 117 flashcards in this deck.
Unlock Deck
k this deck
14
The randomization distribution for testing the hypotheses versus is provided. The sample statistic is Use the provided randomization distribution (based on 100 samples) to estimate the p-value for this test.
versus is provided. The sample statistic is Use the provided randomization distribution (based on 100 samples) to estimate the p-value for this test. Unlock Deck
Unlock for access to all 117 flashcards in this deck.
Unlock Deck
k this deck
15
The provided figure displays the randomization distribution for testing versus
The p-value for the sample mean = 112 is closest to
A) 0.01
B) 0.25
versus The p-value for the sample mean
= 112 is closest toA) 0.01
B) 0.25
Unlock Deck
Unlock for access to all 117 flashcards in this deck.
Unlock Deck
k this deck
16
Decreasing the significance level of a hypothesis test (say, from 5% to 1%) will cause the p-value of an observed test statistic to
A) increase.
B) decrease.
C) stay the same.
A) increase.
B) decrease.
C) stay the same.
Unlock Deck
Unlock for access to all 117 flashcards in this deck.
Unlock Deck
k this deck
17
Using the definition of a p-value, explain why the area in the tail of a randomization distribution is used to compute a p-value.
Unlock Deck
Unlock for access to all 117 flashcards in this deck.
Unlock Deck
k this deck
18
A Type I error occurs by
A) rejecting the null hypothesis when the null hypothesis is false.
B) not rejecting the null hypothesis when the null hypothesis is false.
C) rejecting the null hypothesis when the null hypothesis is true.
D) not rejecting the null hypothesis when the null hypothesis is true.
A) rejecting the null hypothesis when the null hypothesis is false.
B) not rejecting the null hypothesis when the null hypothesis is false.
C) rejecting the null hypothesis when the null hypothesis is true.
D) not rejecting the null hypothesis when the null hypothesis is true.
Unlock Deck
Unlock for access to all 117 flashcards in this deck.
Unlock Deck
k this deck
19
Using a significance level of 5%, the appropriate conclusion for a test with a p-value of 0.0421 would be:
A) Reject
B) Do not reject
A) Reject
B) Do not reject
Unlock Deck
Unlock for access to all 117 flashcards in this deck.
Unlock Deck
k this deck
20
The significance level, ?, represents the tolerable probability of making a Type II error.
Unlock Deck
Unlock for access to all 117 flashcards in this deck.
Unlock Deck
k this deck
21
Use the following to answer the questions below:
Match each p-value to the most appropriate conclusion.
- "The evidence against the null and in favor of the alternative is very strong."
A) 0.0001
B) 0.0735
C) 0.6082
D) 0.0361
Match each p-value to the most appropriate conclusion.
- "The evidence against the null and in favor of the alternative is very strong."
A) 0.0001
B) 0.0735
C) 0.6082
D) 0.0361
Unlock Deck
Unlock for access to all 117 flashcards in this deck.
Unlock Deck
k this deck
22
Use the following to answer the questions below:
Match each p-value to the most appropriate conclusion.
- "The result is significant at the 5% level but not at a 1% level."
A) 0.0001
B) 0.0735
C) 0.6082
D) 0.0361
Match each p-value to the most appropriate conclusion.
- "The result is significant at the 5% level but not at a 1% level."
A) 0.0001
B) 0.0735
C) 0.6082
D) 0.0361
Unlock Deck
Unlock for access to all 117 flashcards in this deck.
Unlock Deck
k this deck
23
Use the following to answer the questions below:
Match each p-value to the most appropriate conclusion.
- "There is really no evidence supporting the alternative hypothesis."
A) 0.0001
B) 0.0735
C) 0.6082
D) 0.0361
Match each p-value to the most appropriate conclusion.
- "There is really no evidence supporting the alternative hypothesis."
A) 0.0001
B) 0.0735
C) 0.6082
D) 0.0361
Unlock Deck
Unlock for access to all 117 flashcards in this deck.
Unlock Deck
k this deck
24
Use the following to answer the questions below:
Match each p-value to the most appropriate conclusion.
- "The evidence against the null is significant, but only at the 10% level."
A) 0.0001
B) 0.0735
C) 0.6082
D) 0.0361
Match each p-value to the most appropriate conclusion.
- "The evidence against the null is significant, but only at the 10% level."
A) 0.0001
B) 0.0735
C) 0.6082
D) 0.0361
Unlock Deck
Unlock for access to all 117 flashcards in this deck.
Unlock Deck
k this deck
25
Use the following to answer the questions below:
A study described in Attention, Perception, and Psychophysics investigated the impacts of multi-tasking on people who play video games and those who don't. Participants in the study were asked to perform three visually demanding tasks with (dual-task) and without (single-task) answering unrelated questions over the phone. One of the tasks involved tracking multiple circles moving around on a computer monitor. At the 5% significance level, the authors of the study concluded "tracking accuracy was significantly worse in the dual-task condition" for both people who play video games and those who do not.
-What conclusion would the authors have made at the 10% significance level?
A) Tracking accuracy was significantly worse in the dual-task condition.
B) Tracking accuracy was not significantly worse in the dual-task condition.
C) Not enough information
Unlock Deck
Unlock for access to all 117 flashcards in this deck.
Unlock Deck
k this deck
26
Use the following to answer the questions below:
A study described in Attention, Perception, and Psychophysics investigated the impacts of multi-tasking on people who play video games and those who don't. Participants in the study were asked to perform three visually demanding tasks with (dual-task) and without (single-task) answering unrelated questions over the phone. One of the tasks involved tracking multiple circles moving around on a computer monitor. At the 5% significance level, the authors of the study concluded "tracking accuracy was significantly worse in the dual-task condition" for both people who play video games and those who do not.
-What conclusion would the authors have made at the 1% significance level?
A) Tracking accuracy was significantly worse in the dual-task condition.
B) Tracking accuracy was not significantly worse in the dual-task condition.
C) Not enough information
Unlock Deck
Unlock for access to all 117 flashcards in this deck.
Unlock Deck
k this deck
27
Use the following to answer the questions below:
A study described in Attention, Perception, and Psychophysics investigated the impacts of multi-tasking on people who play video games and those who don't. Participants in the study were asked to perform three visually demanding tasks with (dual-task) and without (single-task) answering unrelated questions over the phone. One of the tasks involved tracking multiple circles moving around on a computer monitor. At the 5% significance level, the authors of the study concluded "tracking accuracy was significantly worse in the dual-task condition" for both people who play video games and those who do not.
-Which type of error, Type I or Type II, could have occurred in this situation? Briefly justify your answer.
Unlock Deck
Unlock for access to all 117 flashcards in this deck.
Unlock Deck
k this deck
28
It is of interest to test the hypotheses : p = 0.8 versus The sample outcome, based on observations, is and the randomization statistic to be calculated is . The p-value for this test was found to be 0.322. If the test was performed correctly, where should the randomization distribution be centered?
A) 0.7
B) 10
C) 0.8
D) 0.322
: p = 0.8 versus The sample outcome, based on observations, is and the randomization statistic to be calculated is . The p-value for this test was found to be 0.322. If the test was performed correctly, where should the randomization distribution be centered?A) 0.7
B) 10
C) 0.8
D) 0.322
Unlock Deck
Unlock for access to all 117 flashcards in this deck.
Unlock Deck
k this deck
29
It is believed that about 37% of college students binge drink (5 or more drinks for men, and 4 or more drinks for women, in two hours). Administrators at a small university of 6,000 students want to do a study to determine if the proportion of their students who binge drink differs from 37%. They select a sample of 98 students enrolled at the university to survey about their drinking behavior. When generating the randomization distribution for this test, how large should each individual randomization sample be?
A) 98 because that is the size of the original sample
B) 1,000 to get an accurate randomization distribution
C) 6,000 because that is the size of the university
D) 2,220 because that is 37% of the students at the university
A) 98 because that is the size of the original sample
B) 1,000 to get an accurate randomization distribution
C) 6,000 because that is the size of the university
D) 2,220 because that is 37% of the students at the university
Unlock Deck
Unlock for access to all 117 flashcards in this deck.
Unlock Deck
k this deck
30
When generating a randomization sample, the sample should be consistent with the ________ hypothesis.
Unlock Deck
Unlock for access to all 117 flashcards in this deck.
Unlock Deck
k this deck
31
The null and alternative hypotheses for a test are vs. Give the notation for a sample statistic we might record for each simulated sample to create the randomization distribution.
A)
B) p
C)
D)
vs. Give the notation for a sample statistic we might record for each simulated sample to create the randomization distribution.A)
B) p
C)
D)
Unlock Deck
Unlock for access to all 117 flashcards in this deck.
Unlock Deck
k this deck
32
Use the following to answer the questions below:
A student in an introductory statistics course investigated if there is evidence that the proportion of milk chocolate M&M's that are green differs from the proportion of dark chocolate M&M's that are green. She purchased a bag of each variety, and her data are summarized in the following table.
-Describe how you would generate a single randomization sample in this situation, and identify (using the appropriate notation) the sample statistic you would record for each sample.
Unlock Deck
Unlock for access to all 117 flashcards in this deck.
Unlock Deck
k this deck
33
Use the following to answer the questions below:
A student in an introductory statistics course investigated if there is evidence that the proportion of milk chocolate M&M's that are green differs from the proportion of dark chocolate M&M's that are green. She purchased a bag of each variety, and her data are summarized in the following table.
-Use the provided randomization distribution (based on 100 samples) to test if this sample provides evidence that the proportion of candies that are green differs for the two types of M&M's. Include an assessment of the strength of your evidence.
Unlock Deck
Unlock for access to all 117 flashcards in this deck.
Unlock Deck
k this deck
34
Use the following to answer the questions below:
A student in an introductory statistics course investigated if there is evidence that the proportion of milk chocolate M&M's that are green differs from the proportion of dark chocolate M&M's that are green. She purchased a bag of each variety, and her data are summarized in the following table.
-Use technology and the provided data to test if this sample provides evidence that the proportion of candies that are green differs for the two types of M&M's. Include an assessment of the strength of your evidence.
Unlock Deck
Unlock for access to all 117 flashcards in this deck.
Unlock Deck
k this deck
35
Use the following to answer the questions below:
A student in an introductory statistics course investigated if there is evidence that the proportion of milk chocolate M&M's that are green differs from the proportion of dark chocolate M&M's that are green. She purchased a bag of each variety, and her data are summarized in the following table.
-Define the appropriate parameter(s) and state the hypotheses for testing if the proportion of green M&M's differs for milk chocolate and dark chocolate M&M's.
Unlock Deck
Unlock for access to all 117 flashcards in this deck.
Unlock Deck
k this deck
36
Use the following to answer the questions below:
A student in an introductory statistics course investigated if there is evidence that the proportion of milk chocolate M&M's that are green differs from the proportion of dark chocolate M&M's that are green. She purchased a bag of each variety, and her data are summarized in the following table.
-Describe how you would generate a single randomization sample in this situation, and identify (using the appropriate notation) the sample statistic you would record for each sample.
Unlock Deck
Unlock for access to all 117 flashcards in this deck.
Unlock Deck
k this deck
37
Use the following to answer the questions below:
A student in an introductory statistics course investigated if there is evidence that the proportion of milk chocolate M&M's that are green differs from the proportion of dark chocolate M&M's that are green. She purchased a bag of each variety, and her data are summarized in the following table.
-Use technology to create a randomization distribution with at least 1,000 values for testing these hypotheses. Use your randomization distribution to estimate the p-value for this sample.
Unlock Deck
Unlock for access to all 117 flashcards in this deck.
Unlock Deck
k this deck
38
Use the following to answer the questions below:
A student in an introductory statistics course investigated if there is evidence that the proportion of milk chocolate M&M's that are green differs from the proportion of dark chocolate M&M's that are green. She purchased a bag of each variety, and her data are summarized in the following table.
-Use technology to create a randomization distribution with at least 1,000 values for testing these hypotheses and estimate the p-value. Use your p-value to make a decision about these hypotheses. Be sure to word your decision in the context of the problem. Include an assessment of the strength of your evidence.
Unlock Deck
Unlock for access to all 117 flashcards in this deck.
Unlock Deck
k this deck
39
Use the following to answer the questions below
A student in an introductory statistics course investigated if there is evidence that the proportion of milk chocolate M&M's that are green differs from the proportion of dark chocolate M&M's that are green. She purchased a bag of each variety, and her data are summarized in the following table.
-Define the appropriate parameter(s) and state the hypotheses for testing if the proportion of green M&M's differs for milk chocolate and dark chocolate M&M's.
Unlock Deck
Unlock for access to all 117 flashcards in this deck.
Unlock Deck
k this deck
40
Use the following to answer the questions below
A student in an introductory statistics course investigated if there is evidence that the proportion of milk chocolate M&M's that are green differs from the proportion of dark chocolate M&M's that are green. She purchased a bag of each variety, and her data are summarized in the following table.
-Describe how you would generate a single randomization sample in this situation, and identify (using the appropriate notation) the sample statistic you would record for each sample.
Unlock Deck
Unlock for access to all 117 flashcards in this deck.
Unlock Deck
k this deck
41
Use the following to answer the questions below
A student in an introductory statistics course investigated if there is evidence that the proportion of milk chocolate M&M's that are green differs from the proportion of dark chocolate M&M's that are green. She purchased a bag of each variety, and her data are summarized in the following table.
-Use the provided randomization distribution (based on 100 samples) to estimate the p-value for this sample.
Unlock Deck
Unlock for access to all 117 flashcards in this deck.
Unlock Deck
k this deck
42
Use the following to answer the questions below
A student in an introductory statistics course investigated if there is evidence that the proportion of milk chocolate M&M's that are green differs from the proportion of dark chocolate M&M's that are green. She purchased a bag of each variety, and her data are summarized in the following table.
-Use the provided randomization distribution (based on 100 samples) to estimate the p-value for this sample. Use your p-value to make a decision about these hypotheses. Be sure to word your decision in the context of the problem. Include an assessment of the strength of your evidence.
Unlock Deck
Unlock for access to all 117 flashcards in this deck.
Unlock Deck
k this deck
43
Use the following to answer the questions below:
-Describe how you could generate a single randomization sample in this situation, and identify (using the appropriate notation) the sample statistic you would record for each sample.
-Describe how you could generate a single randomization sample in this situation, and identify (using the appropriate notation) the sample statistic you would record for each sample.
Unlock Deck
Unlock for access to all 117 flashcards in this deck.
Unlock Deck
k this deck
44
Use the following to answer the questions below:
-Use the provided randomization distribution (based on 1,000 samples) to test if this sample provides evidence that the average gas price in Illinois exceeds the national average. Include an assessment of the strength of your evidence.
-Use the provided randomization distribution (based on 1,000 samples) to test if this sample provides evidence that the average gas price in Illinois exceeds the national average. Include an assessment of the strength of your evidence.
Unlock Deck
Unlock for access to all 117 flashcards in this deck.
Unlock Deck
k this deck
45
Use the following to answer the questions below:
-Use technology and the provided data to test if this sample provides evidence that the average gas price in Illinois exceeds the national average. Include an assessment of the strength of your evidence.
-Use technology and the provided data to test if this sample provides evidence that the average gas price in Illinois exceeds the national average. Include an assessment of the strength of your evidence.
Unlock Deck
Unlock for access to all 117 flashcards in this deck.
Unlock Deck
k this deck
46
Use the following to answer the questions below:
-Define the appropriate parameter(s) and state the hypotheses for testing if this sample provides evidence that the average gas price in Illinois exceeds the national average.
A)
B)
C)
D)
-Define the appropriate parameter(s) and state the hypotheses for testing if this sample provides evidence that the average gas price in Illinois exceeds the national average.
A)
B)
C)
D)
Unlock Deck
Unlock for access to all 117 flashcards in this deck.
Unlock Deck
k this deck
47
Use the following to answer the questions below:
-Describe how you would generate a single randomization sample in this situation, and identify (using the appropriate notation) the sample statistic you would record for each sample.
-Describe how you would generate a single randomization sample in this situation, and identify (using the appropriate notation) the sample statistic you would record for each sample.
Unlock Deck
Unlock for access to all 117 flashcards in this deck.
Unlock Deck
k this deck
48
Use the following to answer the questions below:
-Use technology to create a randomization distribution with at least 1,000 values for testing these hypotheses. Use your randomization distribution to estimate the p-value for this sample.
-Use technology to create a randomization distribution with at least 1,000 values for testing these hypotheses. Use your randomization distribution to estimate the p-value for this sample.
Unlock Deck
Unlock for access to all 117 flashcards in this deck.
Unlock Deck
k this deck
49
Use the following to answer the questions below:
-Use technology to create a randomization distribution with at least 1,000 values for testing these hypotheses and estimate the p-value. Use your p-value to make a decision about these hypotheses. Be sure to word your decision in the context of the problem. Include an assessment of the strength of your evidence.
-Use technology to create a randomization distribution with at least 1,000 values for testing these hypotheses and estimate the p-value. Use your p-value to make a decision about these hypotheses. Be sure to word your decision in the context of the problem. Include an assessment of the strength of your evidence.
Unlock Deck
Unlock for access to all 117 flashcards in this deck.
Unlock Deck
k this deck
50
Use the following to answer the questions below:
-Define the appropriate parameter(s) and state the hypotheses for testing if this sample provides evidence that the average gas price in Illinois exceeds the national average.
A)
B)
C)
D)
-Define the appropriate parameter(s) and state the hypotheses for testing if this sample provides evidence that the average gas price in Illinois exceeds the national average.
A)
B)
C)
D)
Unlock Deck
Unlock for access to all 117 flashcards in this deck.
Unlock Deck
k this deck
51
Use the following to answer the questions below:
-Describe how you would generate a single randomization sample in this situation, and identify (using the appropriate notation) the sample statistic you would record for each sample.
-Describe how you would generate a single randomization sample in this situation, and identify (using the appropriate notation) the sample statistic you would record for each sample.
Unlock Deck
Unlock for access to all 117 flashcards in this deck.
Unlock Deck
k this deck
52
Use the following to answer the questions below:
-Use the provided randomization distribution (based on 1,000 samples) to estimate the p-value for this sample.
-Use the provided randomization distribution (based on 1,000 samples) to estimate the p-value for this sample.
Unlock Deck
Unlock for access to all 117 flashcards in this deck.
Unlock Deck
k this deck
53
Use the following to answer the questions below:
-Use the provided randomization distribution (based on 1,000 samples) to estimate the p-value for this sample. Use your p-value to make a decision about these hypotheses. Be sure to word your decision in the context of the problem. Include an assessment of the strength of your evidence.
-Use the provided randomization distribution (based on 1,000 samples) to estimate the p-value for this sample. Use your p-value to make a decision about these hypotheses. Be sure to word your decision in the context of the problem. Include an assessment of the strength of your evidence.
Unlock Deck
Unlock for access to all 117 flashcards in this deck.
Unlock Deck
k this deck
54
Use the following to answer the questions below:
-The provided histogram displays the prices (in thousands of dollars) of 25 homes sold in 2019 in a Midwestern city.
In general, this shape, right skewed with some unusually high values, is common for describing home values in many cities. For this reason, the median home value for a city is a useful parameter. This sample of recently sold homes had a median price (value) of $232,500. Someone considering moving to this city is interested in knowing if the median home value is more than $200,000.
Describe how you would generate a single randomization sample in this situation, and identify the statistic you would calculate from the sample.
Unlock Deck
Unlock for access to all 117 flashcards in this deck.
Unlock Deck
k this deck
55
Use the following to answer the questions below:
A certain species of tree has an average life span of 130 years. A researcher has noticed a large number of trees of this species washing up along a beach as driftwood. She takes core samples from 27 of those trees to count the number of rings and measure the widths of the rings. Counting the rings allows the researcher to determine the age of each tree. The average age of the trees in the sample is about 120 years. One of her interests is determining if this sample provides evidence that the average age of the driftwood is less than the 130 year life span expected for this type of tree. If the average age is less than 130 years it might suggest that the trees have died from unusual causes, such as invasive beetles or logging.
-Describe how you would generate a single randomization sample in this situation, and identify the statistic you would calculate for each sample.
Unlock Deck
Unlock for access to all 117 flashcards in this deck.
Unlock Deck
k this deck
56
Use the following to answer the questions below:
A certain species of tree has an average life span of 130 years. A researcher has noticed a large number of trees of this species washing up along a beach as driftwood. She takes core samples from 27 of those trees to count the number of rings and measure the widths of the rings. Counting the rings allows the researcher to determine the age of each tree. The average age of the trees in the sample is about 120 years. One of her interests is determining if this sample provides evidence that the average age of the driftwood is less than the 130 year life span expected for this type of tree. If the average age is less than 130 years it might suggest that the trees have died from unusual causes, such as invasive beetles or logging.
-Use the provided randomization distribution (based on 100 samples) to determine if this sample provides evidence that the average age of the driftwood along this beach is less than 130 years. Use a 5% significance level to make your conclusion.
Unlock Deck
Unlock for access to all 117 flashcards in this deck.
Unlock Deck
k this deck
57
Use the following to answer the questions below:
A certain species of tree has an average life span of 130 years. A researcher has noticed a large number of trees of this species washing up along a beach as driftwood. She takes core samples from 27 of those trees to count the number of rings and measure the widths of the rings. Counting the rings allows the researcher to determine the age of each tree. Her data are displayed in the provided table. One of her interests is determining if this sample provides evidence that the average age of the driftwood is less than the 130 year life span expected for this type of tree. If the average age is less than 130 years it might suggest that the trees have died from unusual causes, such as invasive beetles or logging.
-Describe how you would generate a single randomization sample in this situation, and identify the statistic you would calculate for each sample.
Unlock Deck
Unlock for access to all 117 flashcards in this deck.
Unlock Deck
k this deck
58
Use the following to answer the questions below:
A certain species of tree has an average life span of 130 years. A researcher has noticed a large number of trees of this species washing up along a beach as driftwood. She takes core samples from 27 of those trees to count the number of rings and measure the widths of the rings. Counting the rings allows the researcher to determine the age of each tree. Her data are displayed in the provided table. One of her interests is determining if this sample provides evidence that the average age of the driftwood is less than the 130 year life span expected for this type of tree. If the average age is less than 130 years it might suggest that the trees have died from unusual causes, such as invasive beetles or logging.
-Use technology and the provided data to determine if this sample provides evidence that the average age of the driftwood along this beach is less than 130 years. Use a 5% significance level to make your conclusion.
Unlock Deck
Unlock for access to all 117 flashcards in this deck.
Unlock Deck
k this deck
59
Use the following to answer the questions below:
A certain species of tree has an average life span of 130 years. A researcher has noticed a large number of trees of this species washing up along a beach as driftwood. She takes core samples from 27 of those trees to count the number of rings and measure the widths of the rings. Counting the rings allows the researcher to determine the age of each tree. The average age of the trees in the sample is approximately 120 years. One of her interests is determining if this sample provides evidence that the average age of the driftwood is less than the 130 year life span expected for this type of tree. If the average age is less than 130 years it might suggest that the trees have died from unusual causes, such as invasive beetles or logging.
-Define the appropriate parameter(s) and state the hypotheses for testing if this sample provides evidence that the average age of the driftwood along this beach is less than 130 years.
A)
B)
C)
D)
Unlock Deck
Unlock for access to all 117 flashcards in this deck.
Unlock Deck
k this deck
60
Use the following to answer the questions below:
A certain species of tree has an average life span of 130 years. A researcher has noticed a large number of trees of this species washing up along a beach as driftwood. She takes core samples from 27 of those trees to count the number of rings and measure the widths of the rings. Counting the rings allows the researcher to determine the age of each tree. The average age of the trees in the sample is approximately 120 years. One of her interests is determining if this sample provides evidence that the average age of the driftwood is less than the 130 year life span expected for this type of tree. If the average age is less than 130 years it might suggest that the trees have died from unusual causes, such as invasive beetles or logging.
-Describe how you would generate a single randomization sample in this situation, and identify the statistic you would calculate for each sample.
Unlock Deck
Unlock for access to all 117 flashcards in this deck.
Unlock Deck
k this deck
61
Use the following to answer the questions below:
A certain species of tree has an average life span of 130 years. A researcher has noticed a large number of trees of this species washing up along a beach as driftwood. She takes core samples from 27 of those trees to count the number of rings and measure the widths of the rings. Counting the rings allows the researcher to determine the age of each tree. The average age of the trees in the sample is approximately 120 years. One of her interests is determining if this sample provides evidence that the average age of the driftwood is less than the 130 year life span expected for this type of tree. If the average age is less than 130 years it might suggest that the trees have died from unusual causes, such as invasive beetles or logging.
-Use the provided randomization distribution (based on 100 samples) to estimate the p-value for this sample.
Unlock Deck
Unlock for access to all 117 flashcards in this deck.
Unlock Deck
k this deck
62
Use the following to answer the questions below:
A certain species of tree has an average life span of 130 years. A researcher has noticed a large number of trees of this species washing up along a beach as driftwood. She takes core samples from 27 of those trees to count the number of rings and measure the widths of the rings. Counting the rings allows the researcher to determine the age of each tree. The average age of the trees in the sample is approximately 120 years. One of her interests is determining if this sample provides evidence that the average age of the driftwood is less than the 130 year life span expected for this type of tree. If the average age is less than 130 years it might suggest that the trees have died from unusual causes, such as invasive beetles or logging.
-Use the provided randomization distribution (based on 100 samples) to estimate the p-value for this sample. Use your p-value and a 5% significance level to make a decision about these hypotheses. Be sure to word your decision in the context of the problem.
Unlock Deck
Unlock for access to all 117 flashcards in this deck.
Unlock Deck
k this deck
63
Use the following to answer the questions below:
A certain species of tree has an average life span of 130 years. A researcher has noticed a large number of trees of this species washing up along a beach as driftwood. She takes core samples from 27 of those trees to count the number of rings and measure the widths of the rings. Counting the rings allows the researcher to determine the age of each tree. The average age of the trees in the sample is approximately 120 years. One of her interests is determining if this sample provides evidence that the average age of the driftwood is less than the 130 year life span expected for this type of tree. If the average age is less than 130 years it might suggest that the trees have died from unusual causes, such as invasive beetles or logging.
-Use the provided randomization distribution (based on 100 samples) to estimate the p-value for this sample. What conclusion would you make at the 10% significance level?
Unlock Deck
Unlock for access to all 117 flashcards in this deck.
Unlock Deck
k this deck
64
Use the following to answer the questions below:
A certain species of tree has an average life span of 130 years. A researcher has noticed a large number of trees of this species washing up along a beach as driftwood. She takes core samples from 27 of those trees to count the number of rings and measure the widths of the rings. Counting the rings allows the researcher to determine the age of each tree. Her data are displayed in the provided table. One of her interests is determining if this sample provides evidence that the average age of the driftwood is less than the 130 year life span expected for this type of tree. If the average age is less than 130 years it might suggest that the trees have died from unusual causes, such as invasive beetles or logging.
-Define the appropriate parameter(s) and state the hypotheses for testing if this sample provides evidence that the average age of the driftwood along this beach is less than 130 years.
A)
B)
C)
D)
Unlock Deck
Unlock for access to all 117 flashcards in this deck.
Unlock Deck
k this deck
65
Use the following to answer the questions below:
A certain species of tree has an average life span of 130 years. A researcher has noticed a large number of trees of this species washing up along a beach as driftwood. She takes core samples from 27 of those trees to count the number of rings and measure the widths of the rings. Counting the rings allows the researcher to determine the age of each tree. Her data are displayed in the provided table. One of her interests is determining if this sample provides evidence that the average age of the driftwood is less than the 130 year life span expected for this type of tree. If the average age is less than 130 years it might suggest that the trees have died from unusual causes, such as invasive beetles or logging.
-Describe how you would generate a single randomization sample in this situation, and identify (using the appropriate notation) the sample statistic you would record for each sample.
Unlock Deck
Unlock for access to all 117 flashcards in this deck.
Unlock Deck
k this deck
66
Use the following to answer the questions below:
A certain species of tree has an average life span of 130 years. A researcher has noticed a large number of trees of this species washing up along a beach as driftwood. She takes core samples from 27 of those trees to count the number of rings and measure the widths of the rings. Counting the rings allows the researcher to determine the age of each tree. Her data are displayed in the provided table. One of her interests is determining if this sample provides evidence that the average age of the driftwood is less than the 130 year life span expected for this type of tree. If the average age is less than 130 years it might suggest that the trees have died from unusual causes, such as invasive beetles or logging.
-Use technology to create a randomization distribution with at least 1,000 values for testing these hypotheses. Use your randomization distribution to estimate the p-value for this sample.
Unlock Deck
Unlock for access to all 117 flashcards in this deck.
Unlock Deck
k this deck
67
Use the following to answer the questions below:
A certain species of tree has an average life span of 130 years. A researcher has noticed a large number of trees of this species washing up along a beach as driftwood. She takes core samples from 27 of those trees to count the number of rings and measure the widths of the rings. Counting the rings allows the researcher to determine the age of each tree. Her data are displayed in the provided table. One of her interests is determining if this sample provides evidence that the average age of the driftwood is less than the 130 year life span expected for this type of tree. If the average age is less than 130 years it might suggest that the trees have died from unusual causes, such as invasive beetles or logging.
-Use technology to create a randomization distribution with at least 1,000 values for testing these hypotheses and estimate the p-value. Use your p-value and a 5% significance level to make a decision about these hypotheses. Be sure to word your decision in the context of the problem.
Unlock Deck
Unlock for access to all 117 flashcards in this deck.
Unlock Deck
k this deck
68
Use the following to answer the questions below:
A certain species of tree has an average life span of 130 years. A researcher has noticed a large number of trees of this species washing up along a beach as driftwood. She takes core samples from 27 of those trees to count the number of rings and measure the widths of the rings. Counting the rings allows the researcher to determine the age of each tree. Her data are displayed in the provided table. One of her interests is determining if this sample provides evidence that the average age of the driftwood is less than the 130 year life span expected for this type of tree. If the average age is less than 130 years it might suggest that the trees have died from unusual causes, such as invasive beetles or logging.
-Use technology to create a randomization distribution with at least 1,000 values for testing these hypotheses and estimate the p-value. What conclusion would you make at the 10% significance level?
Unlock Deck
Unlock for access to all 117 flashcards in this deck.
Unlock Deck
k this deck
69
Use the following to answer the questions below:
There are 24 students enrolled in an introductory statistics class at a small university. As an in-class exercise the students were asked how many hours of television they watch each week. Their responses, broken down by gender, are summarized in the provided table. Assume that the students enrolled in the statistics class are representative of all students at the university.
-Does this sample provide evidence that, on average, male students watch more television than female students at this university? Describe how you could generate a single randomization sample in this situation, and identify the statistic that you would calculate for each sample.
Unlock Deck
Unlock for access to all 117 flashcards in this deck.
Unlock Deck
k this deck
70
Use the following to answer the questions below:
There are 24 students enrolled in an introductory statistics class at a small university. As an in-class exercise the students were asked how many hours of television they watch each week. Their responses, broken down by gender, are summarized in the provided table. Assume that the students enrolled in the statistics class are representative of all students at the university.
-Use technology to determine if this sample provides evidence that, on average, male students watch more television than female students at this university. Include an assessment of the strength of the evidence.
Unlock Deck
Unlock for access to all 117 flashcards in this deck.
Unlock Deck
k this deck
71
Use the following to answer the questions below:
There are 24 students enrolled in an introductory statistics class at a small university. As an in-class exercise the students were asked how many hours of television they watch each week. Their responses, broken down by gender, are summarized in the provided table. Assume that the students enrolled in the statistics class are representative of all students at the university.
-Use the provided randomization distribution (based on 100 samples) to determine if this sample provides evidence that, on average, male students watch more television than female students at this university. Include an assessment of the strength of the evidence.
Unlock Deck
Unlock for access to all 117 flashcards in this deck.
Unlock Deck
k this deck
72
Use the following to answer the questions below:
There are 24 students enrolled in an introductory statistics class at a small university. As an in-class exercise the students were asked how many hours of television they watch each week. Their responses, broken down by gender, are summarized in the provided table. Assume that the students enrolled in the statistics class are representative of all students at the university.
-Define the appropriate parameter(s) and state the hypotheses for testing if this sample provides evidence that, on average, male students watch more television than female students at this university.
A)
B)
C)
D)
Unlock Deck
Unlock for access to all 117 flashcards in this deck.
Unlock Deck
k this deck
73
Use the following to answer the questions below:
There are 24 students enrolled in an introductory statistics class at a small university. As an in-class exercise the students were asked how many hours of television they watch each week. Their responses, broken down by gender, are summarized in the provided table. Assume that the students enrolled in the statistics class are representative of all students at the university.
-Describe how you would generate a single randomization sample in this situation, and identify (using the appropriate notation) the sample statistic you would record for each sample.
Unlock Deck
Unlock for access to all 117 flashcards in this deck.
Unlock Deck
k this deck
74
Use the following to answer the questions below:
There are 24 students enrolled in an introductory statistics class at a small university. As an in-class exercise the students were asked how many hours of television they watch each week. Their responses, broken down by gender, are summarized in the provided table. Assume that the students enrolled in the statistics class are representative of all students at the university.
-Use the provided randomization distribution (based on 100 samples) to estimate the p-value for this sample.
Unlock Deck
Unlock for access to all 117 flashcards in this deck.
Unlock Deck
k this deck
75
Use the following to answer the questions below:
There are 24 students enrolled in an introductory statistics class at a small university. As an in-class exercise the students were asked how many hours of television they watch each week. Their responses, broken down by gender, are summarized in the provided table. Assume that the students enrolled in the statistics class are representative of all students at the university.
-Use the provided randomization distribution (based on 100 samples) to estimate the p-value for this sample. Use your p-value to make a decision about these hypotheses. Be sure to word your decision in the context of the problem.
A) This sample provides no evidence that male students watch more television each week than female students at this university.
B) This sample provides strong evidence that male students watch more television each week than female students at this university.
Unlock Deck
Unlock for access to all 117 flashcards in this deck.
Unlock Deck
k this deck
76
Use the following to answer the questions below:
There are 24 students enrolled in an introductory statistics class at a small university. As an in-class exercise the students were asked how many hours of television they watch each week. Their responses, broken down by gender, are summarized in the provided table. Assume that the students enrolled in the statistics class are representative of all students at the university.
-Define the appropriate parameter(s) and state the hypotheses for testing if this sample provides evidence that, on average, male students watch more television than female students at this university.
Unlock Deck
Unlock for access to all 117 flashcards in this deck.
Unlock Deck
k this deck
77
Use the following to answer the questions below:
There are 24 students enrolled in an introductory statistics class at a small university. As an in-class exercise the students were asked how many hours of television they watch each week. Their responses, broken down by gender, are summarized in the provided table. Assume that the students enrolled in the statistics class are representative of all students at the university.
-Describe how you would generate a single randomization sample in this situation, and identify (using the appropriate notation) the sample statistic you would record for each sample.
Unlock Deck
Unlock for access to all 117 flashcards in this deck.
Unlock Deck
k this deck
78
Use the following to answer the questions below:
There are 24 students enrolled in an introductory statistics class at a small university. As an in-class exercise the students were asked how many hours of television they watch each week. Their responses, broken down by gender, are summarized in the provided table. Assume that the students enrolled in the statistics class are representative of all students at the university.
-Use technology to create a randomization distribution with at least 1,000 values for testing these hypotheses. Use your randomization distribution to estimate the p-value for this sample.
Unlock Deck
Unlock for access to all 117 flashcards in this deck.
Unlock Deck
k this deck
79
Use the following to answer the questions below:
There are 24 students enrolled in an introductory statistics class at a small university. As an in-class exercise the students were asked how many hours of television they watch each week. Their responses, broken down by gender, are summarized in the provided table. Assume that the students enrolled in the statistics class are representative of all students at the university.
-Use technology to create a randomization distribution with at least 1,000 values for testing these hypotheses and estimate the p-value. Use your p-value to make a decision about these hypotheses. Be sure to word your decision in the context of the problem.
A) This sample provides no evidence that male students watch more television each week than female students at this university.
B) This sample provides strong evidence that male students watch more television each week than female students at this university.
Unlock Deck
Unlock for access to all 117 flashcards in this deck.
Unlock Deck
k this deck
80
Use the following to answer the questions below:
The owner of a small pet supply store wants to open a second store in another city, but he only wants to do so if more than one-third of the city's households have pets (otherwise there won't be enough business). He samples 150 of the households and finds that 64 have pets.
-Describe how you could generate a single randomization sample in this situation, and identify the statistic that you would calculate for each sample.
Unlock Deck
Unlock for access to all 117 flashcards in this deck.
Unlock Deck
k this deck
Unlock Deck
Unlock for access to all 117 flashcards in this deck.


