Exam 4: Hypothesis Tests
Use the following to answer the questions below:
The owner of a small pet supply store wants to open a second store in another city, but he only wants to do so if more than one-third of the city's households have pets (otherwise there won't be enough business). He samples 150 of the households and finds that 64 have pets.
-Define the appropriate parameter(s) and state the hypotheses for testing if this sample provides evidence that more than one-third of households in this city own pets.
A
Use the following to answer the questions below:
 -The provided histogram displays the prices (in thousands of dollars) of 25 homes sold in 2019 in a Midwestern city.
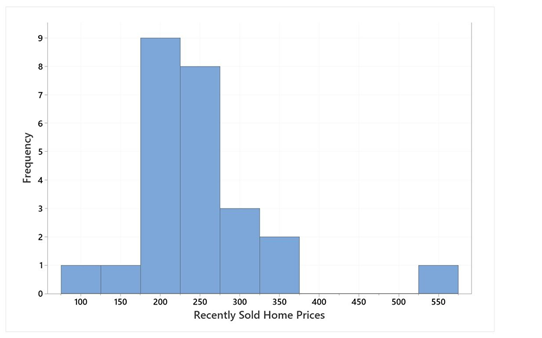 In general, this shape, right skewed with some unusually high values, is common for describing home values in many cities. For this reason, the median home value for a city is a useful parameter. This sample of recently sold homes had a median price (value) of $232,500. Someone considering moving to this city is interested in knowing if the median home value is more than $200,000.
Describe how you would generate a single randomization sample in this situation, and identify the statistic you would calculate from the sample.
In general, this shape, right skewed with some unusually high values, is common for describing home values in many cities. For this reason, the median home value for a city is a useful parameter. This sample of recently sold homes had a median price (value) of $232,500. Someone considering moving to this city is interested in knowing if the median home value is more than $200,000.
Describe how you would generate a single randomization sample in this situation, and identify the statistic you would calculate from the sample.
The current sample first needs to be shifted so that it is consistent with the null hypothesis. Since the median of the original sample is $23,500 more than the hypothesized value, all of the observations in the original sample should be reduced by $23,500. This creates a sample that still has the same general structure as the original sample but is now consistent with the null hypothesis. To generate a single randomization sample, we could write the 26 modified prices (those consistent with the null hypotheses) on index cards, shuffle them, draw one, record the value, replace that card in the deck, and repeat (sampling with replacement) until we've obtained a sample of 26 prices. The median of this sample would be the statistic we calculate.
Use the following to answer the questions below:
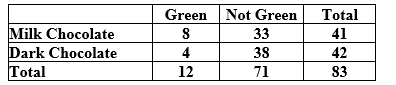
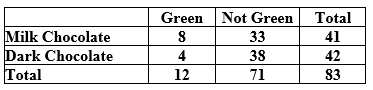
A student in an introductory statistics course investigated if there is evidence that the proportion of milk chocolate M&M's that are green differs from the proportion of dark chocolate M&M's that are green. She purchased a bag of each variety, and her data are summarized in the following table.
 -Use technology to create a randomization distribution with at least 1,000 values for testing these hypotheses and estimate the p-value. Use your p-value to make a decision about these hypotheses. Be sure to word your decision in the context of the problem. Include an assessment of the strength of your evidence.
Their conclusion should be consistent with their p-value (and either a formal decision based on a significance level or an informal statement of the strength of their evidence against the null). Though, most p-values should lead the students to fail to reject the null hypothesis and conclude that this sample does not provide evidence that the proportion of green candies differs for the two types of M&M's.
Use the following to answer the questions below:
The owner of a small pet supply store wants to open a second store in another city, but he only wants to do so if more than one-third of the city's households have pets (otherwise there won't be enough business). He samples 150 of the households and finds that 64 have pets.
-Define the appropriate parameter(s) and state the hypotheses for testing if this sample provides evidence that more than one-third of households in this city own pets.
Use the following to answer the questions below:
The owner of a small pet supply store wants to open a second store in another city, but he only wants to do so if more than one-third of the city's households have pets (otherwise there won't be enough business). He samples 150 of the households and finds that 64 have pets.
-Use technology to determine if this sample provides evidence that more than one-third of households in this city own pets. Use a 5% significance level.
Suppose that a 95% confidence interval for ? is (54.8, 60.8). Which of the following is most likely the p-value for the test of  versus
Use the following to answer the questions below:
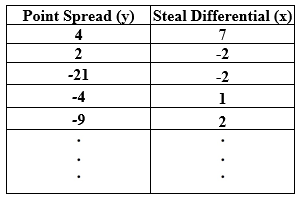
A Division III college men's basketball team is interested in identifying factors that impact the outcomes of their games. They plan to use "point spread" (their score minus their opponent's score) to quantify the outcome of each game this season; positive values indicate games that they won while negative values indicate games they lost. They want to determine if "steal differential" (the number of steals they have in the game minus the number of steals their opponent had) is related to point spread; positive values indicate games where they had more steals than their opponent. The data for the games they played this season displayed in the provided table.
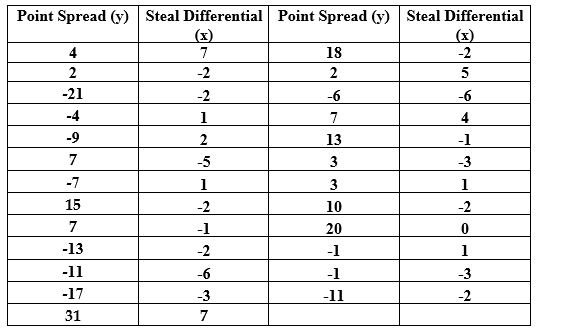 Assuming that this season was a typical season for the team, they want to know if steal differential is positively correlated with point spread.
-Use technology to determine if this sample provides evidence that point spread and steal differential are positively correlated. Be sure to include all of the steps of the test. Use a 10% significance level to make your conclusion.
Assuming that this season was a typical season for the team, they want to know if steal differential is positively correlated with point spread.
-Use technology to determine if this sample provides evidence that point spread and steal differential are positively correlated. Be sure to include all of the steps of the test. Use a 10% significance level to make your conclusion.
Use the following to answer the questions below:
Match each p-value to the most appropriate conclusion.
- "The evidence against the null is significant, but only at the 10% level."
Use the following to answer the questions below:
 -Describe how you would generate a single randomization sample in this situation, and identify (using the appropriate notation) the sample statistic you would record for each sample.
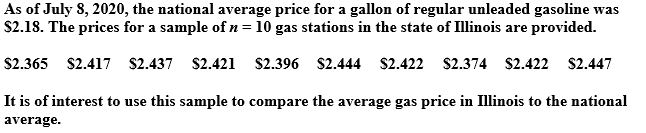
Which of the following samples provides the most evidence that the amount of time spent studying for an exam and the grade on the exam are positively correlated?
Use the following to answer the questions below:
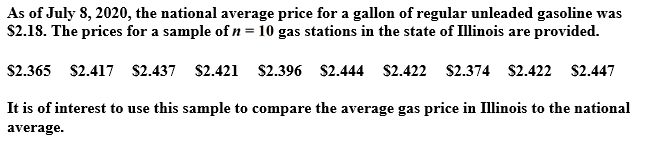
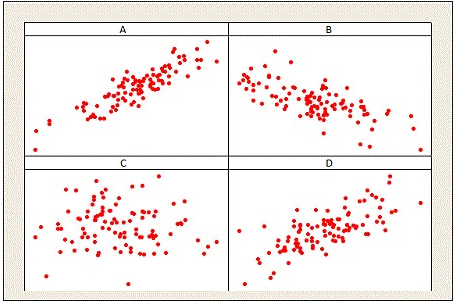
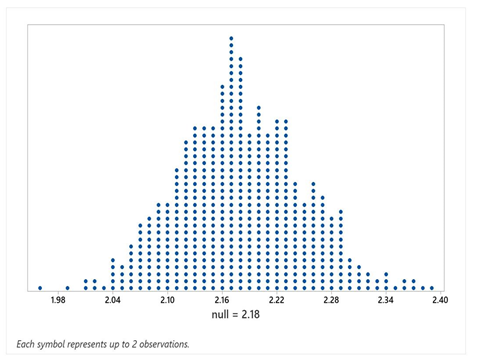
 -Use the provided randomization distribution (based on 1,000 samples) to test if this sample provides evidence that the average gas price in Illinois exceeds the national average. Include an assessment of the strength of your evidence.
Of the two p-values, which provides more evidence against  ?
?
Use the following to answer the questions below:
In May 2012, President Obama made history by revealing his support of gay marriage. Around that time, the Gallup Organization polled 1,024 U.S. adults about their opinions on gay/lesbian relations and gay marriage. They found that 54% of those sampled viewed gay/lesbian relations as "morally acceptable" and that 50% felt that gay marriage should be legal.
-Does this sample provide evidence that the majority of Americans find gay/lesbian relations "morally acceptable"? Describe how you could generate a single randomization sample in this situation, and identify the statistic that you would calculate for each sample.
Use the following to answer the questions below:
A student in an introductory statistics course investigated if there is evidence that the proportion of milk chocolate M&M's that are green differs from the proportion of dark chocolate M&M's that are green. She purchased a bag of each variety, and her data are summarized in the following table.
 -Describe how you would generate a single randomization sample in this situation, and identify (using the appropriate notation) the sample statistic you would record for each sample.
Use the following to answer the questions below:
A Division III college men's basketball team is interested in identifying factors that impact the outcomes of their games. They plan to use "point spread" (their score minus their opponent's score) to quantify the outcome of each game this season; positive values indicate games that they won while negative values indicate games they lost. They want to determine if "steal differential" (the number of steals they have in the game minus the number of steals their opponent had) is related to point spread; positive values indicate games where they had more steals than their opponent. The data for the first five games are in the provided table as an example.
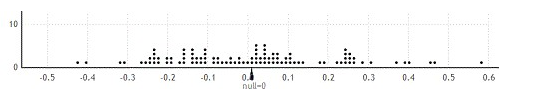
 The correlation between point spread and steal differential for the games they played this season is about Assuming that this season was a typical season for the team, they want to test if this sample provides evidence that steal differential is positively correlated with point spread.
-Use the provided randomization distribution (based on 100 samples) to estimate the p-value for this sample.
The correlation between point spread and steal differential for the games they played this season is about Assuming that this season was a typical season for the team, they want to test if this sample provides evidence that steal differential is positively correlated with point spread.
-Use the provided randomization distribution (based on 100 samples) to estimate the p-value for this sample.
Use the following to answer the questions below:
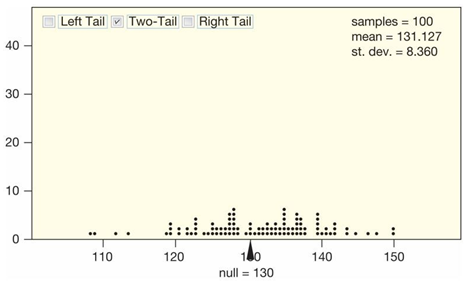
A certain species of tree has an average life span of 130 years. A researcher has noticed a large number of trees of this species washing up along a beach as driftwood. She takes core samples from 27 of those trees to count the number of rings and measure the widths of the rings. Counting the rings allows the researcher to determine the age of each tree. The average age of the trees in the sample is approximately 120 years. One of her interests is determining if this sample provides evidence that the average age of the driftwood is less than the 130 year life span expected for this type of tree. If the average age is less than 130 years it might suggest that the trees have died from unusual causes, such as invasive beetles or logging.
-Use the provided randomization distribution (based on 100 samples) to estimate the p-value for this sample. Use your p-value and a 5% significance level to make a decision about these hypotheses. Be sure to word your decision in the context of the problem.
Use the following to answer the questions below:
In May 2012, President Obama made history by revealing his support of gay marriage. Around that time, the Gallup Organization polled 1,024 U.S. adults about their opinions on gay/lesbian relations and gay marriage. They found that 54% of those sampled viewed gay/lesbian relations as "morally acceptable" and that 50% felt that gay marriage should be legal.
-Define the appropriate parameter and state the hypotheses for testing if this sample provides evidence that the proportion of American adults who support gay marriage differs from 50%.
Decreasing the significance level of a hypothesis test (say, from 5% to 1%) will cause the p-value of an observed test statistic to
Use the following to answer the questions below:
A study conducted by the National Center of Health Statistics collects data on Vitamin D levels. In 2011-2014, in a sample of 3,929 non-Hispanic Blacks showed that 17.5% were Vitamin D deficient. A 95% confidence interval based on the sample is (0.152, 0.200).
-In a test of the hypotheses  :
:  =
=  versus
  :
:  ?
?  , the observed sample results in a p-value of 0.0256. Would you expect a 95% confidence interval for
  based on this sample to contain 0?
Filters
- Essay(0)
- Multiple Choice(0)
- Short Answer(0)
- True False(0)
- Matching(0)