Deck 3: Confidence Intervals
Full screen (f)
Question
Use the following to answer the questions below:
Identify each of the following as either a parameter or a statistic, and give the correct notation.
-Correlation between height and armspan (distance from fingertip to fingertip when arms are extended to the sides) for all players on the Chicago Bulls basketball team, using data from all players currently on the team
A) Parameter,
B) Parameter,
C) Statistic,
D) Statistic,
Question
Use the following to answer the questions below:
Identify each of the following as either a parameter or a statistic, and give the correct notation.
-Proportion of students at your university that smoke, based on data from your class.
A) Statistic,
B) Parameter,
C) Parameter,
D) Statistic,
Identify each of the following as either a parameter or a statistic, and give the correct notation.
-Proportion of students at your university that smoke, based on data from your class.
A) Statistic,
B) Parameter,
C) Parameter,
D) Statistic,
Question
Use the following to answer the questions below:
Identify each of the following as either a parameter or a statistic, and give the correct notation.
-Correlation between price of a textbook and the number of pages, based on 25 textbooks selected from the bookstore.
A) Statistic, r
B) Parameter,
C) Parameter,
D) Statistic,
Identify each of the following as either a parameter or a statistic, and give the correct notation.
-Correlation between price of a textbook and the number of pages, based on 25 textbooks selected from the bookstore.
A) Statistic, r
B) Parameter,
C) Parameter,
D) Statistic,
Question
Use the following to answer the questions below:
Identify each of the following as either a parameter or a statistic, and give the correct notation.
-Average commute time for employees at a small company, based on interviews with all employees.
A) Parameter,
B) Statistic, r
C) Parameter,
D) Statistic,
Identify each of the following as either a parameter or a statistic, and give the correct notation.
-Average commute time for employees at a small company, based on interviews with all employees.
A) Parameter,
B) Statistic, r
C) Parameter,
D) Statistic,
Question
Use the following to answer the questions below:
Identify each of the following as either a parameter or a statistic, and give the correct notation.
-Average gas price in Minnesota, based on prices at randomly selected gas stations throughout the state.
A) Statistic,
B) Statistic, r
C) Parameter,
D) Parameter,
Identify each of the following as either a parameter or a statistic, and give the correct notation.
-Average gas price in Minnesota, based on prices at randomly selected gas stations throughout the state.
A) Statistic,
B) Statistic, r
C) Parameter,
D) Parameter,
Question
Use the following to answer the questions below:
Identify each of the following as either a parameter or a statistic, and give the correct notation.
-Proportion of students at a university that are part-time, based on data on all students enrolled at the university.
A) Parameter,
B) Statistic, r
C) Parameter,
D) Statistic,
Identify each of the following as either a parameter or a statistic, and give the correct notation.
-Proportion of students at a university that are part-time, based on data on all students enrolled at the university.
A) Parameter,
B) Statistic, r
C) Parameter,
D) Statistic,
Question
Question
Use the following to answer the questions below:
The sampling distribution shows sample proportions from samples of size n = 35.
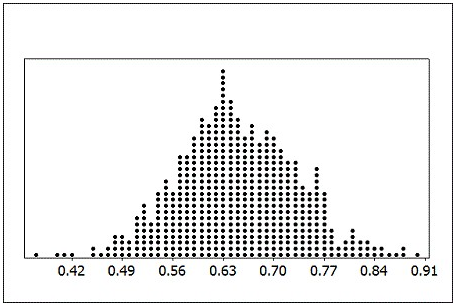
-What does one dot on the sampling distribution represent?
The sampling distribution shows sample proportions from samples of size n = 35.
-What does one dot on the sampling distribution represent?
Question
Use the following to answer the questions below:
The sampling distribution shows sample proportions from samples of size n = 35.
?
-Estimate the population proportion from the dotplot.
A) 0.56
B) 0.63
C) 0.70
D) 0.91
The sampling distribution shows sample proportions from samples of size n = 35.
?
-Estimate the population proportion from the dotplot.
A) 0.56
B) 0.63
C) 0.70
D) 0.91
Question
Use the following to answer the questions below:
The sampling distribution shows sample proportions from samples of size n = 35.
?
-Estimate the standard error of the sample proportions.
A) 0.07
B) 0.63
C) 0.14
D) 0.01
The sampling distribution shows sample proportions from samples of size n = 35.
?
-Estimate the standard error of the sample proportions.
A) 0.07
B) 0.63
C) 0.14
D) 0.01
Question
Use the following to answer the questions below:
The sampling distribution shows sample proportions from samples of size n = 35.
?
-Using the sampling distribution, how likely is =0.65
=0.65
A) Reasonably likely to occur from a sample of this size
B) Unusual but might occur occasionally
C) Extremely unlikely to ever occur
The sampling distribution shows sample proportions from samples of size n = 35.
?
-Using the sampling distribution, how likely is
=0.65A) Reasonably likely to occur from a sample of this size
B) Unusual but might occur occasionally
C) Extremely unlikely to ever occur
Question
Use the following to answer the questions below:
The sampling distribution shows sample proportions from samples of size n = 35.
?
-Using the sampling distribution, how likely is = 0.45?
A) Reasonably likely to occur from a sample of this size
B) Unusual but might occur occasionally
C) Extremely unlikely to ever occur
The sampling distribution shows sample proportions from samples of size n = 35.
?
-Using the sampling distribution, how likely is
= 0.45?A) Reasonably likely to occur from a sample of this size
B) Unusual but might occur occasionally
C) Extremely unlikely to ever occur
Question
Use the following to answer the questions below:
The sampling distribution shows sample proportions from samples of size n = 35.
?
-Using the sampling distribution, how likely is = 0.98?
A) Reasonably likely to occur from a sample of this size
B) Unusual but might occur occasionally
C) Extremely unlikely to ever occur
The sampling distribution shows sample proportions from samples of size n = 35.
?
-Using the sampling distribution, how likely is
= 0.98?A) Reasonably likely to occur from a sample of this size
B) Unusual but might occur occasionally
C) Extremely unlikely to ever occur
Question
Use the following to answer the questions below:
The sampling distribution shows sample proportions from samples of size n = 35.
?
-If samples of size n = 65 had been used instead of n = 35, which of the following would be true?
A) The sample statistics would be centered at a larger proportion.
B) The sample statistics would be centered at roughly the same proportion.
C) The sample statistics would be centered at a smaller proportion.
Question
Use the following to answer the questions below:
The sampling distribution shows sample proportions from samples of size n = 35.
?
-If samples of size n = 65 had been used instead of n = 35, which of the following would be true?
A) The sample statistics would have more variability.
B) The variability in the sample statistics would be about the same.
C) The sample statistics would have less variability.
Question
Use the following to answer the questions below:
The sampling distribution shows sample means from samples of size n = 50.
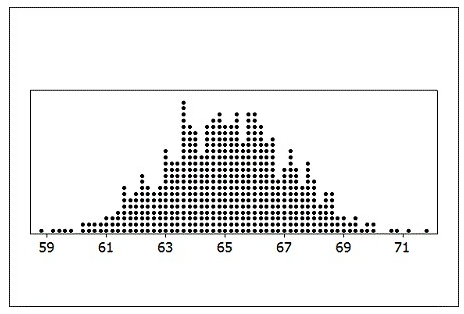
-What does one dot on the sampling distribution represent?
The sampling distribution shows sample means from samples of size n = 50.
-What does one dot on the sampling distribution represent?
Question
Use the following to answer the questions below:
The sampling distribution shows sample means from samples of size n = 50.
?
-Estimate the population mean from the dotplot.
A) 62
B) 63
C) 65
D) 67
The sampling distribution shows sample means from samples of size n = 50.
?
-Estimate the population mean from the dotplot.
A) 62
B) 63
C) 65
D) 67
Question
Use the following to answer the questions below:
The sampling distribution shows sample means from samples of size n = 50.
?
-Estimate the standard error of the sample means.
A) 1
B) 2
C) 3
D) 5
The sampling distribution shows sample means from samples of size n = 50.
?
-Estimate the standard error of the sample means.
A) 1
B) 2
C) 3
D) 5
Question
Use the following to answer the questions below:
The sampling distribution shows sample means from samples of size n = 50.
?
-Using the sampling distribution, how likely is = 55.6?
A) Reasonably likely to occur from a sample of this size
B) Unusual but might occur occasionally
C) Extremely unlikely to ever occur
The sampling distribution shows sample means from samples of size n = 50.
?
-Using the sampling distribution, how likely is
= 55.6?A) Reasonably likely to occur from a sample of this size
B) Unusual but might occur occasionally
C) Extremely unlikely to ever occur
Question
Use the following to answer the questions below:
The sampling distribution shows sample means from samples of size n = 50.
?
-Using the sampling distribution, how likely is = 64.2?
A) Reasonably likely to occur from a sample of this size
B) Unusual but might occur occasionally
C) Extremely unlikely to ever occur
The sampling distribution shows sample means from samples of size n = 50.
?
-Using the sampling distribution, how likely is
= 64.2?A) Reasonably likely to occur from a sample of this size
B) Unusual but might occur occasionally
C) Extremely unlikely to ever occur
Question
Use the following to answer the questions below:
The sampling distribution shows sample means from samples of size n = 50.
?
-Using the sampling distribution, how likely is = 68.7?
A) Reasonably likely to occur from a sample of this size
B) Unusual but might occur occasionally
C) Extremely unlikely to ever occur
The sampling distribution shows sample means from samples of size n = 50.
?
-Using the sampling distribution, how likely is
= 68.7?A) Reasonably likely to occur from a sample of this size
B) Unusual but might occur occasionally
C) Extremely unlikely to ever occur
Question
Use the following to answer the questions below:
The sampling distribution shows sample means from samples of size n = 50.
?
-If samples of size n = 30 had been used instead of n = 50, which of the following would be true?
A) The sample means would be centered at a larger value.
B) The sample means would be centered at the same value.
C) The sample means would be centered at a smaller value.
Question
Use the following to answer the questions below:
The sampling distribution shows sample means from samples of size n = 50.
?
-If samples of size n = 30 had been used instead of n = 50, which of the following would be true?
A) The sample means would have more variability.
B) The variability in the sample statistics would be about the same.
C) The sample means would have less variability.
Question
Use the following to answer the questions below:
In a survey of 7,786 randomly selected adults living in Germany, 5,840 said they exercised for at least 30 minutes three or more times per week.
-Identify, with the proper notation, the quantity being estimated.
A) p = proportion of German adults who exercise for 30 minutes three or more times per week.
B) = proportion number of German adults who exercise for 30 minutes three or more times per week.
C) p = the number of German adults who exercise for 30 minutes three or more times per week.
D) = the number of German adults who exercise for 30 minutes three or more times per week.
In a survey of 7,786 randomly selected adults living in Germany, 5,840 said they exercised for at least 30 minutes three or more times per week.
-Identify, with the proper notation, the quantity being estimated.
A) p = proportion of German adults who exercise for 30 minutes three or more times per week.
B)
= proportion number of German adults who exercise for 30 minutes three or more times per week.C) p = the number of German adults who exercise for 30 minutes three or more times per week.
D)
= the number of German adults who exercise for 30 minutes three or more times per week. Question
Question
Use the following to answer the questions below:
According to U.S. Census data, 71.6% of Americans are age 21 and over. The provided figure shows possible sampling distributions for the proportion of a sample age 21 and over, for samples of size n = 50, n = 125, and n = 250.
?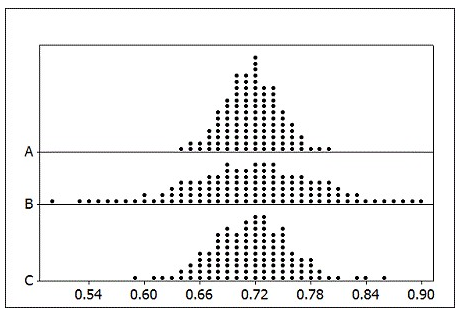
Match the sample sizes (n = 50, n = 125, and n = 250) to their sampling distribution.
-Sample A: n = ________
Question
Use the following to answer the questions below:
According to U.S. Census data, 71.6% of Americans are age 21 and over. The provided figure shows possible sampling distributions for the proportion of a sample age 21 and over, for samples of size n = 50, n = 125, and n = 250.
?
Match the sample sizes (n = 50, n = 125, and n = 250) to their sampling distribution.
-Sample B: n = ________
Question
Use the following to answer the questions below:
According to U.S. Census data, 71.6% of Americans are age 21 and over. The provided figure shows possible sampling distributions for the proportion of a sample age 21 and over, for samples of size n = 50, n = 125, and n = 250.
?
Match the sample sizes (n = 50, n = 125, and n = 250) to their sampling distribution.
-Sample C: n = ________
Question
Question
Question
Use the following to answer the questions below:
According to ESPN.com, the average number of yards per game for all NFL running backs with at least 50 attempts in the 2011 season was 49 yards/game. A sample of 20 running backs from the 2011 season averaged 46.54 yards/game.
-Two boxplots are shown. One boxplot corresponds to the yards/game for a random sample of
running backs. The other boxplot represents the values in a sampling distribution of 1,000 means of yards/game for samples of size n = 20.
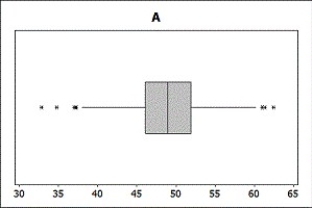
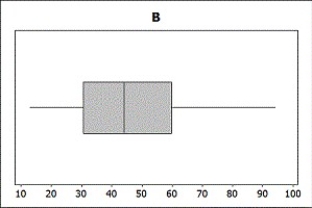
Which boxplot represents the sample? Which boxplot represents the sampling distribution?
A) Boxplot A is the sampling distribution while Boxplot B is a single sample.
B) Boxplot B is the sampling distribution while Boxplot A is a single sample.
According to ESPN.com, the average number of yards per game for all NFL running backs with at least 50 attempts in the 2011 season was 49 yards/game. A sample of 20 running backs from the 2011 season averaged 46.54 yards/game.
-Two boxplots are shown. One boxplot corresponds to the yards/game for a random sample of
running backs. The other boxplot represents the values in a sampling distribution of 1,000 means of yards/game for samples of size n = 20.
Which boxplot represents the sample? Which boxplot represents the sampling distribution?
A) Boxplot A is the sampling distribution while Boxplot B is a single sample.
B) Boxplot B is the sampling distribution while Boxplot A is a single sample.
Question
Question
Question
Question
Question
Question
Question
Use the following to answer the questions below:
In a recent Gallup survey of 1,012 randomly selected U.S. adults (age 18 and over), 53% said that they were dissatisfied with the quality of education students receive in kindergarten through grade 12. They also report that the "margin of sampling error is plus or minus 4%."
-What is the population parameter of interest, and what is the correct notation for this parameter?
A) p = proportion of U.S. adults who are dissatisfied with the quality of education students receive in kindergarten through grade 12
B) = proportion of the sample of 1,012 randomly selected U.S. adults who are dissatisfied = 0.53
C) p = proportion of the sample of 1,012 randomly selected U.S. adults who are dissatisfied = 0.53
D) =proportion of U.S. adults who are dissatisfied with the quality of education students receive in kindergarten through grade 12
In a recent Gallup survey of 1,012 randomly selected U.S. adults (age 18 and over), 53% said that they were dissatisfied with the quality of education students receive in kindergarten through grade 12. They also report that the "margin of sampling error is plus or minus 4%."
-What is the population parameter of interest, and what is the correct notation for this parameter?
A) p = proportion of U.S. adults who are dissatisfied with the quality of education students receive in kindergarten through grade 12
B)
= proportion of the sample of 1,012 randomly selected U.S. adults who are dissatisfied = 0.53C) p = proportion of the sample of 1,012 randomly selected U.S. adults who are dissatisfied = 0.53
D)
=proportion of U.S. adults who are dissatisfied with the quality of education students receive in kindergarten through grade 12 Question
Use the following to answer the questions below:
In a recent Gallup survey of 1,012 randomly selected U.S. adults (age 18 and over), 53% said that they were dissatisfied with the quality of education students receive in kindergarten through grade 12. They also report that the "margin of sampling error is plus or minus 4%."
-What is the relevant statistic?
A) = proportion of the sample of 1,012 randomly selected U.S. adults who are dissatisfied = 0.53
B) p = proportion of U.S. adults who are dissatisfied with the quality of education students receive in kindergarten through grade 12
C) p = proportion of the sample of 1,012 randomly selected U.S. adults who are dissatisfied = 0.53
D) = proportion of U.S. adults who are dissatisfied with the quality of education students receive in kindergarten through grade 12
In a recent Gallup survey of 1,012 randomly selected U.S. adults (age 18 and over), 53% said that they were dissatisfied with the quality of education students receive in kindergarten through grade 12. They also report that the "margin of sampling error is plus or minus 4%."
-What is the relevant statistic?
A)
= proportion of the sample of 1,012 randomly selected U.S. adults who are dissatisfied = 0.53B) p = proportion of U.S. adults who are dissatisfied with the quality of education students receive in kindergarten through grade 12
C) p = proportion of the sample of 1,012 randomly selected U.S. adults who are dissatisfied = 0.53
D)
= proportion of U.S. adults who are dissatisfied with the quality of education students receive in kindergarten through grade 12 Question
Question
Question
Question
Question
Question
Question
Question
Question
Question
Question
Question
Question
Use the following to answer the questions below:
In a poll conducted before a Massachusetts city's mayoral election, 134 of 420 randomly chosen likely voters indicated that they planned to vote for the Democratic candidate.
-Suppose that an article describing the poll says that the margin of error for the statistic is 0.045 and an interval estimate is found.What quantity is the interval estimate in trying to capture? Identify with appropriate notation and words.
A) p = proportion of likely voters who plan to vote for the Democratic candidate
B) = proportion of likely voters who plan to vote for the Democratic candidate
C) = the mean number of voters who plan to vote for the Democratic candidate
D) = the mean number of voters who plan to vote for the Democratic candidate
In a poll conducted before a Massachusetts city's mayoral election, 134 of 420 randomly chosen likely voters indicated that they planned to vote for the Democratic candidate.
-Suppose that an article describing the poll says that the margin of error for the statistic is 0.045 and an interval estimate is found.What quantity is the interval estimate in trying to capture? Identify with appropriate notation and words.
A) p = proportion of likely voters who plan to vote for the Democratic candidate
B)
= proportion of likely voters who plan to vote for the Democratic candidateC) = the mean number of voters who plan to vote for the Democratic candidate
D)
= the mean number of voters who plan to vote for the Democratic candidate Question
Question
Question
Question
Question
Question
Question
Question
Question
Question
Question
Question
Use the following to answer the questions below:
An Internet provider contacts a random sample of 300 customers and asks how many hours per week the customers use the Internet. It found the average amount of time spent on the Internet per week to be about 7.2 hours.
-Define the parameter of interest, using the proper notation.
A) = mean number of hours per week all customers use the Internet
B) = 7.2 hours
C) = mean number of hours per week all customers use the Internet
D) = 7.2 hours
An Internet provider contacts a random sample of 300 customers and asks how many hours per week the customers use the Internet. It found the average amount of time spent on the Internet per week to be about 7.2 hours.
-Define the parameter of interest, using the proper notation.
A) = mean number of hours per week all customers use the Internet
B)
= 7.2 hoursC)
= mean number of hours per week all customers use the InternetD) = 7.2 hours
Question
Use the following to answer the questions below:
An Internet provider contacts a random sample of 300 customers and asks how many hours per week the customers use the Internet. It found the average amount of time spent on the Internet per week to be about 7.2 hours.
-Use the information from the sample to give the best estimate of the population parameter.
A) = 7.2 hours
B) = mean number of hours per week all customers use the Internet
C) = mean number of hours per week all customers use the Internet
D) = 7.2 hours
An Internet provider contacts a random sample of 300 customers and asks how many hours per week the customers use the Internet. It found the average amount of time spent on the Internet per week to be about 7.2 hours.
-Use the information from the sample to give the best estimate of the population parameter.
A)
= 7.2 hoursB) = mean number of hours per week all customers use the Internet
C)
= mean number of hours per week all customers use the InternetD) = 7.2 hours
Question
Question
Question
Use the following to answer the questions below:
An Internet provider contacts a random sample of 300 customers and asks how many hours per week the customers use the Internet. It found the average amount of time spent on the Internet per week to be about 7.2 hours.
-Percentiles of the bootstrap distribution are provided. Use the percentiles to report a 95% confidence interval for the parameter.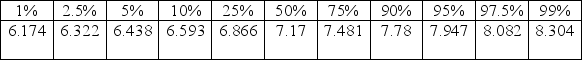
A) 6.322 hours to 8.082 hours
B) 6.438 hours to 7.947 hours
C) 6.174 hours to 8.304 hours
D) 6.593 hours to 7.78 hours
Question
Use the following to answer the questions below:
An Internet provider contacts a random sample of 300 customers and asks how many hours per week the customers use the Internet. It found the average amount of time spent on the Internet per week to be about 7.2 hours.
-Percentiles of the bootstrap distribution are provided. Use the percentiles to report a 90% confidence interval for the parameter.
A) 6.438 hours to 7.947 hours
B) 6.322 hours to 8.082 hours
C) 6.174 hours to 8.304 hours
D) 6.593 hours to 7.78 hours
Question
Question
Question
Question
Use the following to answer the questions below:
Suppose we are interested in comparing the proportion of male students who smoke to the proportion of female students who smoke. We have a random sample of 150 students (60 males and 90 females) that includes two variables: Smoke = "yes" or "no" and Gender = "female (F)" or "male (M)." The two-way table below summarizes the results.
?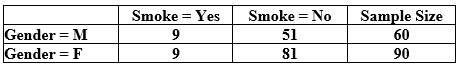
-If the parameter of interest is the difference in proportions, pm - pf, where pm and pf represent the proportion of smokers in each gender, find a point estimate for this difference in proportions based on the data in the table. Report your answer with two decimal places.
Question
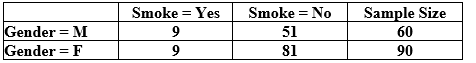
Use the following to answer the questions below:
Suppose we are interested in comparing the proportion of male students who smoke to the proportion of female students who smoke. We have a random sample of 150 students (60 males and 90 females) that includes two variables: Smoke = "yes" or "no" and Gender = "female (F)" or "male (M)." The two-way table below summarizes the results.
-Describe how to use the data to construct a bootstrap distribution. What value should be recorded for each of the bootstrap samples.
Question
Use the following to answer the questions below:
Suppose we are interested in comparing the proportion of male students who smoke to the proportion of female students who smoke. We have a random sample of 150 students (60 males and 90 females) that includes two variables: Smoke = "yes" or "no" and Gender = "female (F)" or "male (M)." The two-way table below summarizes the results.
?
-Use technology to construct a bootstrap distribution with at least 1,000 samples and estimate the standard error.
A) SE = 0.056
B) SE = 0.067
C) SE = 0.072
D) SE = 0.079
Question
Use the following to answer the questions below:
Suppose we are interested in comparing the proportion of male students who smoke to the proportion of female students who smoke. We have a random sample of 150 students (60 males and 90 females) that includes two variables: Smoke = "yes" or "no" and Gender = "female (F)" or "male (M)." The two-way table below summarizes the results.
-Use the estimate of the standard error to construct a 95% confidence interval for the difference in the proportion of smokers between male and female students,  Round the margin of error to three decimal places. Provide an interpretation of the interval in the context of this data situation.
Suppose we are interested in comparing the proportion of male students who smoke to the proportion of female students who smoke. We have a random sample of 150 students (60 males and 90 females) that includes two variables: Smoke = "yes" or "no" and Gender = "female (F)" or "male (M)." The two-way table below summarizes the results.
-Use the estimate of the standard error to construct a 95% confidence interval for the difference in the proportion of smokers between male and female students,
Round the margin of error to three decimal places. Provide an interpretation of the interval in the context of this data situation. Question
Use the following to answer the questions below:
Suppose we are interested in comparing the proportion of male students who smoke to the proportion of female students who smoke. We have a random sample of 150 students (60 males and 90 females) that includes two variables: Smoke = "yes" or "no" and Gender = "female (F)" or "male (M)." The two-way table below summarizes the results.
?
-You wish to provide a 98% confidence interval for the difference in the proportion of smokers between male and female students. State which percentiles of your bootstrap distribution you would use.
A) Use the 1%- and 99%-tiles
B) Use the 2%- and 98%-tiles
C) Use the 4%- and 96%-tiles
D) Use the 5%- and 95%-tiles
Question
Use the following to answer the questions below:
Suppose we are interested in comparing the proportion of male students who smoke to the proportion of female students who smoke. We have a random sample of 150 students (60 males and 90 females) that includes two variables: Smoke = "yes" or "no" and Gender = "female (F)" or "male (M)." The two-way table below summarizes the results.
-If the parameter of interest is the difference in proportions, -
-  , where
  and
and  , represent the proportion of smokers in each gender, find a point estimate for this difference in proportions based on the data in the table. Report your answer with two decimal places.
Suppose we are interested in comparing the proportion of male students who smoke to the proportion of female students who smoke. We have a random sample of 150 students (60 males and 90 females) that includes two variables: Smoke = "yes" or "no" and Gender = "female (F)" or "male (M)." The two-way table below summarizes the results.
-If the parameter of interest is the difference in proportions,
- , where and , represent the proportion of smokers in each gender, find a point estimate for this difference in proportions based on the data in the table. Report your answer with two decimal places. Question
Use the following to answer the questions below:
Suppose we are interested in comparing the proportion of male students who smoke to the proportion of female students who smoke. We have a random sample of 150 students (60 males and 90 females) that includes two variables: Smoke = "yes" or "no" and Gender = "female (F)" or "male (M)." The two-way table below summarizes the results.
-Describe how to use the data to construct a bootstrap distribution. What value should be recorded for each of the bootstrap samples.
Question
Use the following to answer the questions below:
Suppose we are interested in comparing the proportion of male students who smoke to the proportion of female students who smoke. We have a random sample of 150 students (60 males and 90 females) that includes two variables: Smoke = "yes" or "no" and Gender = "female (F)" or "male (M)." The two-way table below summarizes the results.
-Where should the bootstrap distribution be centered?
A) 0.0
B) 0.05
C) 0.10
D) 0.15

Unlock Deck
Sign up to unlock the cards in this deck!
Unlock Deck
Unlock Deck
1/149
Play
Full screen (f)
Deck 3: Confidence Intervals
1
Use the following to answer the questions below:
Identify each of the following as either a parameter or a statistic, and give the correct notation.
-Correlation between height and armspan (distance from fingertip to fingertip when arms are extended to the sides) for all players on the Chicago Bulls basketball team, using data from all players currently on the team
A) Parameter,
B) Parameter,
C) Statistic,
D) Statistic,
Parameter,
2
Use the following to answer the questions below:
Identify each of the following as either a parameter or a statistic, and give the correct notation.
-Proportion of students at your university that smoke, based on data from your class.
A) Statistic,
B) Parameter,
C) Parameter,
D) Statistic,
Identify each of the following as either a parameter or a statistic, and give the correct notation.
-Proportion of students at your university that smoke, based on data from your class.
A) Statistic,
B) Parameter,
C) Parameter,
D) Statistic,
Statistic,
3
Use the following to answer the questions below:
Identify each of the following as either a parameter or a statistic, and give the correct notation.
-Correlation between price of a textbook and the number of pages, based on 25 textbooks selected from the bookstore.
A) Statistic, r
B) Parameter,
C) Parameter,
D) Statistic,
Identify each of the following as either a parameter or a statistic, and give the correct notation.
-Correlation between price of a textbook and the number of pages, based on 25 textbooks selected from the bookstore.
A) Statistic, r
B) Parameter,
C) Parameter,
D) Statistic,
Statistic, r
4
Use the following to answer the questions below:
Identify each of the following as either a parameter or a statistic, and give the correct notation.
-Average commute time for employees at a small company, based on interviews with all employees.
A) Parameter,
B) Statistic, r
C) Parameter,
D) Statistic,
Identify each of the following as either a parameter or a statistic, and give the correct notation.
-Average commute time for employees at a small company, based on interviews with all employees.
A) Parameter,
B) Statistic, r
C) Parameter,
D) Statistic,
Unlock Deck
Unlock for access to all 149 flashcards in this deck.
Unlock Deck
k this deck
5
Use the following to answer the questions below:
Identify each of the following as either a parameter or a statistic, and give the correct notation.
-Average gas price in Minnesota, based on prices at randomly selected gas stations throughout the state.
A) Statistic,
B) Statistic, r
C) Parameter,
D) Parameter,
Identify each of the following as either a parameter or a statistic, and give the correct notation.
-Average gas price in Minnesota, based on prices at randomly selected gas stations throughout the state.
A) Statistic,
B) Statistic, r
C) Parameter,
D) Parameter,
Unlock Deck
Unlock for access to all 149 flashcards in this deck.
Unlock Deck
k this deck
6
Use the following to answer the questions below:
Identify each of the following as either a parameter or a statistic, and give the correct notation.
-Proportion of students at a university that are part-time, based on data on all students enrolled at the university.
A) Parameter,
B) Statistic, r
C) Parameter,
D) Statistic,
Identify each of the following as either a parameter or a statistic, and give the correct notation.
-Proportion of students at a university that are part-time, based on data on all students enrolled at the university.
A) Parameter,
B) Statistic, r
C) Parameter,
D) Statistic,
Unlock Deck
Unlock for access to all 149 flashcards in this deck.
Unlock Deck
k this deck
7
Use the following to answer the questions below:
Identify each of the following as either a parameter or a statistic, and give the correct notation.
-Briefly explain the distinction between a parameter and a statistic.
Identify each of the following as either a parameter or a statistic, and give the correct notation.
-Briefly explain the distinction between a parameter and a statistic.
Unlock Deck
Unlock for access to all 149 flashcards in this deck.
Unlock Deck
k this deck
8
Use the following to answer the questions below:
The sampling distribution shows sample proportions from samples of size n = 35.
-What does one dot on the sampling distribution represent?
The sampling distribution shows sample proportions from samples of size n = 35.
-What does one dot on the sampling distribution represent?
Unlock Deck
Unlock for access to all 149 flashcards in this deck.
Unlock Deck
k this deck
9
Use the following to answer the questions below:
The sampling distribution shows sample proportions from samples of size n = 35.
?
-Estimate the population proportion from the dotplot.
A) 0.56
B) 0.63
C) 0.70
D) 0.91
The sampling distribution shows sample proportions from samples of size n = 35.
?
-Estimate the population proportion from the dotplot.
A) 0.56
B) 0.63
C) 0.70
D) 0.91
Unlock Deck
Unlock for access to all 149 flashcards in this deck.
Unlock Deck
k this deck
10
Use the following to answer the questions below:
The sampling distribution shows sample proportions from samples of size n = 35.
?
-Estimate the standard error of the sample proportions.
A) 0.07
B) 0.63
C) 0.14
D) 0.01
The sampling distribution shows sample proportions from samples of size n = 35.
?
-Estimate the standard error of the sample proportions.
A) 0.07
B) 0.63
C) 0.14
D) 0.01
Unlock Deck
Unlock for access to all 149 flashcards in this deck.
Unlock Deck
k this deck
11
Use the following to answer the questions below:
The sampling distribution shows sample proportions from samples of size n = 35.
?
-Using the sampling distribution, how likely is =0.65
A) Reasonably likely to occur from a sample of this size
B) Unusual but might occur occasionally
C) Extremely unlikely to ever occur
The sampling distribution shows sample proportions from samples of size n = 35.
?
-Using the sampling distribution, how likely is
=0.65A) Reasonably likely to occur from a sample of this size
B) Unusual but might occur occasionally
C) Extremely unlikely to ever occur
Unlock Deck
Unlock for access to all 149 flashcards in this deck.
Unlock Deck
k this deck
12
Use the following to answer the questions below:
The sampling distribution shows sample proportions from samples of size n = 35.
?
-Using the sampling distribution, how likely is = 0.45?
A) Reasonably likely to occur from a sample of this size
B) Unusual but might occur occasionally
C) Extremely unlikely to ever occur
The sampling distribution shows sample proportions from samples of size n = 35.
?
-Using the sampling distribution, how likely is
= 0.45?A) Reasonably likely to occur from a sample of this size
B) Unusual but might occur occasionally
C) Extremely unlikely to ever occur
Unlock Deck
Unlock for access to all 149 flashcards in this deck.
Unlock Deck
k this deck
13
Use the following to answer the questions below:
The sampling distribution shows sample proportions from samples of size n = 35.
?
-Using the sampling distribution, how likely is = 0.98?
A) Reasonably likely to occur from a sample of this size
B) Unusual but might occur occasionally
C) Extremely unlikely to ever occur
The sampling distribution shows sample proportions from samples of size n = 35.
?
-Using the sampling distribution, how likely is
= 0.98?A) Reasonably likely to occur from a sample of this size
B) Unusual but might occur occasionally
C) Extremely unlikely to ever occur
Unlock Deck
Unlock for access to all 149 flashcards in this deck.
Unlock Deck
k this deck
14
Use the following to answer the questions below:
The sampling distribution shows sample proportions from samples of size n = 35.
?
-If samples of size n = 65 had been used instead of n = 35, which of the following would be true?
A) The sample statistics would be centered at a larger proportion.
B) The sample statistics would be centered at roughly the same proportion.
C) The sample statistics would be centered at a smaller proportion.
Unlock Deck
Unlock for access to all 149 flashcards in this deck.
Unlock Deck
k this deck
15
Use the following to answer the questions below:
The sampling distribution shows sample proportions from samples of size n = 35.
?
-If samples of size n = 65 had been used instead of n = 35, which of the following would be true?
A) The sample statistics would have more variability.
B) The variability in the sample statistics would be about the same.
C) The sample statistics would have less variability.
Unlock Deck
Unlock for access to all 149 flashcards in this deck.
Unlock Deck
k this deck
16
Use the following to answer the questions below:
The sampling distribution shows sample means from samples of size n = 50.
-What does one dot on the sampling distribution represent?
The sampling distribution shows sample means from samples of size n = 50.
-What does one dot on the sampling distribution represent?
Unlock Deck
Unlock for access to all 149 flashcards in this deck.
Unlock Deck
k this deck
17
Use the following to answer the questions below:
The sampling distribution shows sample means from samples of size n = 50.
?
-Estimate the population mean from the dotplot.
A) 62
B) 63
C) 65
D) 67
The sampling distribution shows sample means from samples of size n = 50.
?
-Estimate the population mean from the dotplot.
A) 62
B) 63
C) 65
D) 67
Unlock Deck
Unlock for access to all 149 flashcards in this deck.
Unlock Deck
k this deck
18
Use the following to answer the questions below:
The sampling distribution shows sample means from samples of size n = 50.
?
-Estimate the standard error of the sample means.
A) 1
B) 2
C) 3
D) 5
The sampling distribution shows sample means from samples of size n = 50.
?
-Estimate the standard error of the sample means.
A) 1
B) 2
C) 3
D) 5
Unlock Deck
Unlock for access to all 149 flashcards in this deck.
Unlock Deck
k this deck
19
Use the following to answer the questions below:
The sampling distribution shows sample means from samples of size n = 50.
?
-Using the sampling distribution, how likely is = 55.6?
A) Reasonably likely to occur from a sample of this size
B) Unusual but might occur occasionally
C) Extremely unlikely to ever occur
The sampling distribution shows sample means from samples of size n = 50.
?
-Using the sampling distribution, how likely is
= 55.6?A) Reasonably likely to occur from a sample of this size
B) Unusual but might occur occasionally
C) Extremely unlikely to ever occur
Unlock Deck
Unlock for access to all 149 flashcards in this deck.
Unlock Deck
k this deck
20
Use the following to answer the questions below:
The sampling distribution shows sample means from samples of size n = 50.
?
-Using the sampling distribution, how likely is = 64.2?
A) Reasonably likely to occur from a sample of this size
B) Unusual but might occur occasionally
C) Extremely unlikely to ever occur
The sampling distribution shows sample means from samples of size n = 50.
?
-Using the sampling distribution, how likely is
= 64.2?A) Reasonably likely to occur from a sample of this size
B) Unusual but might occur occasionally
C) Extremely unlikely to ever occur
Unlock Deck
Unlock for access to all 149 flashcards in this deck.
Unlock Deck
k this deck
21
Use the following to answer the questions below:
The sampling distribution shows sample means from samples of size n = 50.
?
-Using the sampling distribution, how likely is = 68.7?
A) Reasonably likely to occur from a sample of this size
B) Unusual but might occur occasionally
C) Extremely unlikely to ever occur
The sampling distribution shows sample means from samples of size n = 50.
?
-Using the sampling distribution, how likely is
= 68.7?A) Reasonably likely to occur from a sample of this size
B) Unusual but might occur occasionally
C) Extremely unlikely to ever occur
Unlock Deck
Unlock for access to all 149 flashcards in this deck.
Unlock Deck
k this deck
22
Use the following to answer the questions below:
The sampling distribution shows sample means from samples of size n = 50.
?
-If samples of size n = 30 had been used instead of n = 50, which of the following would be true?
A) The sample means would be centered at a larger value.
B) The sample means would be centered at the same value.
C) The sample means would be centered at a smaller value.
Unlock Deck
Unlock for access to all 149 flashcards in this deck.
Unlock Deck
k this deck
23
Use the following to answer the questions below:
The sampling distribution shows sample means from samples of size n = 50.
?
-If samples of size n = 30 had been used instead of n = 50, which of the following would be true?
A) The sample means would have more variability.
B) The variability in the sample statistics would be about the same.
C) The sample means would have less variability.
Unlock Deck
Unlock for access to all 149 flashcards in this deck.
Unlock Deck
k this deck
24
Use the following to answer the questions below:
In a survey of 7,786 randomly selected adults living in Germany, 5,840 said they exercised for at least 30 minutes three or more times per week.
-Identify, with the proper notation, the quantity being estimated.
A) p = proportion of German adults who exercise for 30 minutes three or more times per week.
B) = proportion number of German adults who exercise for 30 minutes three or more times per week.
C) p = the number of German adults who exercise for 30 minutes three or more times per week.
D) = the number of German adults who exercise for 30 minutes three or more times per week.
In a survey of 7,786 randomly selected adults living in Germany, 5,840 said they exercised for at least 30 minutes three or more times per week.
-Identify, with the proper notation, the quantity being estimated.
A) p = proportion of German adults who exercise for 30 minutes three or more times per week.
B)
= proportion number of German adults who exercise for 30 minutes three or more times per week.C) p = the number of German adults who exercise for 30 minutes three or more times per week.
D)
= the number of German adults who exercise for 30 minutes three or more times per week. Unlock Deck
Unlock for access to all 149 flashcards in this deck.
Unlock Deck
k this deck
25
Use the following to answer the questions below:
In a survey of 7,786 randomly selected adults living in Germany, 5,840 said they exercised for at least 30 minutes three or more times per week.
-Using the correct notation, give the value of the best estimate of the population parameter. Round your answer to two decimal places.
In a survey of 7,786 randomly selected adults living in Germany, 5,840 said they exercised for at least 30 minutes three or more times per week.
-Using the correct notation, give the value of the best estimate of the population parameter. Round your answer to two decimal places.
Unlock Deck
Unlock for access to all 149 flashcards in this deck.
Unlock Deck
k this deck
26
Use the following to answer the questions below:
According to U.S. Census data, 71.6% of Americans are age 21 and over. The provided figure shows possible sampling distributions for the proportion of a sample age 21 and over, for samples of size n = 50, n = 125, and n = 250.
?
Match the sample sizes (n = 50, n = 125, and n = 250) to their sampling distribution.
-Sample A: n = ________
Unlock Deck
Unlock for access to all 149 flashcards in this deck.
Unlock Deck
k this deck
27
Use the following to answer the questions below:
According to U.S. Census data, 71.6% of Americans are age 21 and over. The provided figure shows possible sampling distributions for the proportion of a sample age 21 and over, for samples of size n = 50, n = 125, and n = 250.
?
Match the sample sizes (n = 50, n = 125, and n = 250) to their sampling distribution.
-Sample B: n = ________
Unlock Deck
Unlock for access to all 149 flashcards in this deck.
Unlock Deck
k this deck
28
Use the following to answer the questions below:
According to U.S. Census data, 71.6% of Americans are age 21 and over. The provided figure shows possible sampling distributions for the proportion of a sample age 21 and over, for samples of size n = 50, n = 125, and n = 250.
?
Match the sample sizes (n = 50, n = 125, and n = 250) to their sampling distribution.
-Sample C: n = ________
Unlock Deck
Unlock for access to all 149 flashcards in this deck.
Unlock Deck
k this deck
29
Use the following to answer the questions below:
According to ESPN.com, the average number of yards per game for all NFL running backs with at least 50 attempts in the 2011 season was 49 yards/game. A sample of 20 running backs from the 2011 season averaged 46.54 yards/game.
-Is 49 yards/game a parameter or statistic?
A) Parameter
B) Statistic
According to ESPN.com, the average number of yards per game for all NFL running backs with at least 50 attempts in the 2011 season was 49 yards/game. A sample of 20 running backs from the 2011 season averaged 46.54 yards/game.
-Is 49 yards/game a parameter or statistic?
A) Parameter
B) Statistic
Unlock Deck
Unlock for access to all 149 flashcards in this deck.
Unlock Deck
k this deck
30
Use the following to answer the questions below:
According to ESPN.com, the average number of yards per game for all NFL running backs with at least 50 attempts in the 2011 season was 49 yards/game. A sample of 20 running backs from the 2011 season averaged 46.54 yards/game.
-Is 46.54 yards/game a parameter or statistic?
A) Parameter
B) Statistic
According to ESPN.com, the average number of yards per game for all NFL running backs with at least 50 attempts in the 2011 season was 49 yards/game. A sample of 20 running backs from the 2011 season averaged 46.54 yards/game.
-Is 46.54 yards/game a parameter or statistic?
A) Parameter
B) Statistic
Unlock Deck
Unlock for access to all 149 flashcards in this deck.
Unlock Deck
k this deck
31
Use the following to answer the questions below:
According to ESPN.com, the average number of yards per game for all NFL running backs with at least 50 attempts in the 2011 season was 49 yards/game. A sample of 20 running backs from the 2011 season averaged 46.54 yards/game.
-Two boxplots are shown. One boxplot corresponds to the yards/game for a random sample of
running backs. The other boxplot represents the values in a sampling distribution of 1,000 means of yards/game for samples of size n = 20.
Which boxplot represents the sample? Which boxplot represents the sampling distribution?
A) Boxplot A is the sampling distribution while Boxplot B is a single sample.
B) Boxplot B is the sampling distribution while Boxplot A is a single sample.
Unlock Deck
Unlock for access to all 149 flashcards in this deck.
Unlock Deck
k this deck
32
Use the following to answer the questions below:
A random sample of 200 students shows that 62% of students use the Student Health Center at some point during their time on campus, with a margin of error of ± 4%. Based on this information, identify each of the following as plausible or not for the percent of the entire student body that use the Student Health Center at some point during their time on campus.
-50%
A) Plausible
B) Not Plausible
Unlock Deck
Unlock for access to all 149 flashcards in this deck.
Unlock Deck
k this deck
33
Use the following to answer the questions below:
A random sample of 200 students shows that 62% of students use the Student Health Center at some point during their time on campus, with a margin of error of ± 4%. Based on this information, identify each of the following as plausible or not for the percent of the entire student body that use the Student Health Center at some point during their time on campus.
-60%
A) Plausible
B) Not Plausible
Unlock Deck
Unlock for access to all 149 flashcards in this deck.
Unlock Deck
k this deck
34
Use the following to answer the questions below:
A random sample of 200 students shows that 62% of students use the Student Health Center at some point during their time on campus, with a margin of error of ± 4%. Based on this information, identify each of the following as plausible or not for the percent of the entire student body that use the Student Health Center at some point during their time on campus.
-65%
A) Plausible
B) Not Plausible
Unlock Deck
Unlock for access to all 149 flashcards in this deck.
Unlock Deck
k this deck
35
Use the following to answer the questions below:
A random sample of 200 students shows that 62% of students use the Student Health Center at some point during their time on campus, with a margin of error of ± 4%. Based on this information, identify each of the following as plausible or not for the percent of the entire student body that use the Student Health Center at some point during their time on campus.
-72%
A) Plausible
B) Not Plausible
Unlock Deck
Unlock for access to all 149 flashcards in this deck.
Unlock Deck
k this deck
36
Use the following to answer the questions below:
In a recent Gallup survey of 1,012 randomly selected U.S. adults (age 18 and over), 53% said that they were dissatisfied with the quality of education students receive in kindergarten through grade 12. They also report that the "margin of sampling error is plus or minus 4%."
-What is the population of interest?
A) U.S. adults (age 18 and over)
B) 1,012 randomly selected U.S. adults
C) U.S. adults dissatisfied with K-12 education
D) U.S. adults satisfied with K-12 education
Unlock Deck
Unlock for access to all 149 flashcards in this deck.
Unlock Deck
k this deck
37
Use the following to answer the questions below:
In a recent Gallup survey of 1,012 randomly selected U.S. adults (age 18 and over), 53% said that they were dissatisfied with the quality of education students receive in kindergarten through grade 12. They also report that the "margin of sampling error is plus or minus 4%."
-What is the sample being used?
A) 1,012 randomly selected U.S. adults
B) U.S. adults (age 18 and over)
C) U.S. adults dissatisfied with K-12 education
D) U.S. adults satisfied with K-12 education
Unlock Deck
Unlock for access to all 149 flashcards in this deck.
Unlock Deck
k this deck
38
Use the following to answer the questions below:
In a recent Gallup survey of 1,012 randomly selected U.S. adults (age 18 and over), 53% said that they were dissatisfied with the quality of education students receive in kindergarten through grade 12. They also report that the "margin of sampling error is plus or minus 4%."
-What is the population parameter of interest, and what is the correct notation for this parameter?
A) p = proportion of U.S. adults who are dissatisfied with the quality of education students receive in kindergarten through grade 12
B) = proportion of the sample of 1,012 randomly selected U.S. adults who are dissatisfied = 0.53
C) p = proportion of the sample of 1,012 randomly selected U.S. adults who are dissatisfied = 0.53
D) =proportion of U.S. adults who are dissatisfied with the quality of education students receive in kindergarten through grade 12
In a recent Gallup survey of 1,012 randomly selected U.S. adults (age 18 and over), 53% said that they were dissatisfied with the quality of education students receive in kindergarten through grade 12. They also report that the "margin of sampling error is plus or minus 4%."
-What is the population parameter of interest, and what is the correct notation for this parameter?
A) p = proportion of U.S. adults who are dissatisfied with the quality of education students receive in kindergarten through grade 12
B)
= proportion of the sample of 1,012 randomly selected U.S. adults who are dissatisfied = 0.53C) p = proportion of the sample of 1,012 randomly selected U.S. adults who are dissatisfied = 0.53
D)
=proportion of U.S. adults who are dissatisfied with the quality of education students receive in kindergarten through grade 12 Unlock Deck
Unlock for access to all 149 flashcards in this deck.
Unlock Deck
k this deck
39
Use the following to answer the questions below:
In a recent Gallup survey of 1,012 randomly selected U.S. adults (age 18 and over), 53% said that they were dissatisfied with the quality of education students receive in kindergarten through grade 12. They also report that the "margin of sampling error is plus or minus 4%."
-What is the relevant statistic?
A) = proportion of the sample of 1,012 randomly selected U.S. adults who are dissatisfied = 0.53
B) p = proportion of U.S. adults who are dissatisfied with the quality of education students receive in kindergarten through grade 12
C) p = proportion of the sample of 1,012 randomly selected U.S. adults who are dissatisfied = 0.53
D) = proportion of U.S. adults who are dissatisfied with the quality of education students receive in kindergarten through grade 12
In a recent Gallup survey of 1,012 randomly selected U.S. adults (age 18 and over), 53% said that they were dissatisfied with the quality of education students receive in kindergarten through grade 12. They also report that the "margin of sampling error is plus or minus 4%."
-What is the relevant statistic?
A)
= proportion of the sample of 1,012 randomly selected U.S. adults who are dissatisfied = 0.53B) p = proportion of U.S. adults who are dissatisfied with the quality of education students receive in kindergarten through grade 12
C) p = proportion of the sample of 1,012 randomly selected U.S. adults who are dissatisfied = 0.53
D)
= proportion of U.S. adults who are dissatisfied with the quality of education students receive in kindergarten through grade 12 Unlock Deck
Unlock for access to all 149 flashcards in this deck.
Unlock Deck
k this deck
40
Use the following to answer the questions below:
In a recent Gallup survey of 1,012 randomly selected U.S. adults (age 18 and over), 53% said that they were dissatisfied with the quality of education students receive in kindergarten through grade 12. They also report that the "margin of sampling error is plus or minus 4%."
-Find an interval estimate for the parameter of interest. Interpret it in terms of dissatisfaction in the quality of education students receive. Use two decimal places in your answer.
A) 0.49 to 0.57
We are 95% sure that the true proportion of U.S. adults who are dissatisfied with the quality of education students receive in kindergarten through grade 12 is between 0.49 and 0.57 (i.e., 49% and 57%).0.49 to 0.57
We are 95% sure that the true proportion of U.S. adults who are dissatisfied with the quality of education students receive in kindergarten through grade 12 is between 0.49 and 0.57 (i.e., 49% and 57%).
B) 0.51 to 0.55
We are 95% sure that the true proportion of U.S. adults who are dissatisfied with the quality of education students receive in kindergarten through grade 12 is between 0.51 and 0.55 (i.e., 51% and 55%).
C) 0.51 to 0.55
We are 95% sure that the proportion of U.S. adults who reported being dissatisfied with the quality of education students receive in kindergarten through grade 12 is between 0.51 and 0.55 (i.e., 51% and 55%).
D) 0.49 to 0.57
We are 95% sure that the proportion of U.S. adults who reported being dissatisfied with the quality of education students receive in kindergarten through grade 12 is between 0.49 and 0.57 (i.e., 49% and 57%).
Unlock Deck
Unlock for access to all 149 flashcards in this deck.
Unlock Deck
k this deck
41
Use the following to answer the questions below:
Identify if each of the following statements is a proper interpretation of a 95% confidence interval.
-I am 95% sure that this interval will contain the population parameter.
Identify if each of the following statements is a proper interpretation of a 95% confidence interval.
-I am 95% sure that this interval will contain the population parameter.
Unlock Deck
Unlock for access to all 149 flashcards in this deck.
Unlock Deck
k this deck
42
Use the following to answer the questions below:
Identify if each of the following statements is a proper interpretation of a 95% confidence interval.
-I am 95% sure that this interval will contain the sample statistic.
Identify if each of the following statements is a proper interpretation of a 95% confidence interval.
-I am 95% sure that this interval will contain the sample statistic.
Unlock Deck
Unlock for access to all 149 flashcards in this deck.
Unlock Deck
k this deck
43
Use the following to answer the questions below:
Identify if each of the following statements is a proper interpretation of a 95% confidence interval.
-95% of the population values will fall within this interval.
Identify if each of the following statements is a proper interpretation of a 95% confidence interval.
-95% of the population values will fall within this interval.
Unlock Deck
Unlock for access to all 149 flashcards in this deck.
Unlock Deck
k this deck
44
Use the following to answer the questions below:
Identify if each of the following statements is a proper interpretation of a 95% confidence interval.
-The probability that the population parameter is in this interval is 0.95.
Identify if each of the following statements is a proper interpretation of a 95% confidence interval.
-The probability that the population parameter is in this interval is 0.95.
Unlock Deck
Unlock for access to all 149 flashcards in this deck.
Unlock Deck
k this deck
45
Use the following to answer the questions below:
Identify if each of the following statements is a proper interpretation of a 95% confidence interval.
-95% of the possible samples from this population will have sample statistics in this particular interval.
Identify if each of the following statements is a proper interpretation of a 95% confidence interval.
-95% of the possible samples from this population will have sample statistics in this particular interval.
Unlock Deck
Unlock for access to all 149 flashcards in this deck.
Unlock Deck
k this deck
46
Recently, the Centers for Disease Control and Prevention estimated 9.4% of children under the age of 18 had asthma. They reported the standard error to be 0.35%. Assuming that the sampling distribution is symmetric and bell-shaped, find a 95% confidence interval.
A) 8.7% to 10.1%
B) 9.1% to 7.8%
C) 8.4% to 10.5%
D) 8.1% to 10.8%
A) 8.7% to 10.1%
B) 9.1% to 7.8%
C) 8.4% to 10.5%
D) 8.1% to 10.8%
Unlock Deck
Unlock for access to all 149 flashcards in this deck.
Unlock Deck
k this deck
47
Use the following to answer the questions below:
A sample of 148 college students reports sleeping an average of 6.85 hours on weeknights, with a margin of error of 0.35 hours. Based on this information, identify each of the following as plausible or not for the average amount of sleep college students get on weeknights.
-6.6 hours
A) Plausible
B) Not plausible
Unlock Deck
Unlock for access to all 149 flashcards in this deck.
Unlock Deck
k this deck
48
Use the following to answer the questions below:
A sample of 148 college students reports sleeping an average of 6.85 hours on weeknights, with a margin of error of 0.35 hours. Based on this information, identify each of the following as plausible or not for the average amount of sleep college students get on weeknights.
-7.5 hours
A) Plausible
B) Not plausible
Unlock Deck
Unlock for access to all 149 flashcards in this deck.
Unlock Deck
k this deck
49
Use the following to answer the questions below:
A sample of 148 college students reports sleeping an average of 6.85 hours on weeknights, with a margin of error of 0.35 hours. Based on this information, identify each of the following as plausible or not for the average amount of sleep college students get on weeknights.
-8 hours
A) Plausible
B) Not plausible
Unlock Deck
Unlock for access to all 149 flashcards in this deck.
Unlock Deck
k this deck
50
Use the following to answer the questions below:
In a poll conducted before a Massachusetts city's mayoral election, 134 of 420 randomly chosen likely voters indicated that they planned to vote for the Democratic candidate.
-Compute a sample statistic from these data. Report your answer with three decimal places.
In a poll conducted before a Massachusetts city's mayoral election, 134 of 420 randomly chosen likely voters indicated that they planned to vote for the Democratic candidate.
-Compute a sample statistic from these data. Report your answer with three decimal places.
Unlock Deck
Unlock for access to all 149 flashcards in this deck.
Unlock Deck
k this deck
51
Use the following to answer the questions below:
In a poll conducted before a Massachusetts city's mayoral election, 134 of 420 randomly chosen likely voters indicated that they planned to vote for the Democratic candidate.
-Suppose that an article describing the poll says that the margin of error for the statistic is 0.045. Use this information to find an interval estimate. Report your answer with three decimal places.
Unlock Deck
Unlock for access to all 149 flashcards in this deck.
Unlock Deck
k this deck
52
Use the following to answer the questions below:
In a poll conducted before a Massachusetts city's mayoral election, 134 of 420 randomly chosen likely voters indicated that they planned to vote for the Democratic candidate.
-Suppose that an article describing the poll says that the margin of error for the statistic is 0.045 and an interval estimate is found.What quantity is the interval estimate in trying to capture? Identify with appropriate notation and words.
A) p = proportion of likely voters who plan to vote for the Democratic candidate
B) = proportion of likely voters who plan to vote for the Democratic candidate
C) = the mean number of voters who plan to vote for the Democratic candidate
D) = the mean number of voters who plan to vote for the Democratic candidate
In a poll conducted before a Massachusetts city's mayoral election, 134 of 420 randomly chosen likely voters indicated that they planned to vote for the Democratic candidate.
-Suppose that an article describing the poll says that the margin of error for the statistic is 0.045 and an interval estimate is found.What quantity is the interval estimate in trying to capture? Identify with appropriate notation and words.
A) p = proportion of likely voters who plan to vote for the Democratic candidate
B)
= proportion of likely voters who plan to vote for the Democratic candidateC) = the mean number of voters who plan to vote for the Democratic candidate
D)
= the mean number of voters who plan to vote for the Democratic candidate Unlock Deck
Unlock for access to all 149 flashcards in this deck.
Unlock Deck
k this deck
53
Use the following to answer the questions below:
In a poll conducted before a Massachusetts city's mayoral election, 134 of 420 randomly chosen likely voters indicated that they planned to vote for the Democratic candidate.
-Suppose that an article describing the poll says that the margin of error for the statistic is 0.045. Use this information to find an interval estimate and interpret the confidence interval.
Unlock Deck
Unlock for access to all 149 flashcards in this deck.
Unlock Deck
k this deck
54
Use the following to answer the questions below:
In a poll conducted before a Massachusetts city's mayoral election, 134 of 420 randomly chosen likely voters indicated that they planned to vote for the Democratic candidate.
-Suppose that a student collects pulse rates from a random sample of 200 students at her college and finds a 90% confidence interval goes from 65.5 to 71.8 beats per minute. Is the following statement an appropriate interpretation of this interval? If not, explain why not.
"90% of the students at my college have mean pulse rates between 65.5 and 71.8 beats per minute."
Unlock Deck
Unlock for access to all 149 flashcards in this deck.
Unlock Deck
k this deck
55
Use the following to answer the questions below:
Identify whether each of the following samples is a possible bootstrap sample from this original sample: 20, 24, 19, 23, 18
-24, 18, 23
Identify whether each of the following samples is a possible bootstrap sample from this original sample: 20, 24, 19, 23, 18
-24, 18, 23
Unlock Deck
Unlock for access to all 149 flashcards in this deck.
Unlock Deck
k this deck
56
Use the following to answer the questions below:
Identify whether each of the following samples is a possible bootstrap sample from this original sample: 20, 24, 19, 23, 18
-24, 19, 24, 20,23
Identify whether each of the following samples is a possible bootstrap sample from this original sample: 20, 24, 19, 23, 18
-24, 19, 24, 20,23
Unlock Deck
Unlock for access to all 149 flashcards in this deck.
Unlock Deck
k this deck
57
Use the following to answer the questions below:
Identify whether each of the following samples is a possible bootstrap sample from this original sample: 20, 24, 19, 23, 18
-20, 24, 21, 19, 18
Identify whether each of the following samples is a possible bootstrap sample from this original sample: 20, 24, 19, 23, 18
-20, 24, 21, 19, 18
Unlock Deck
Unlock for access to all 149 flashcards in this deck.
Unlock Deck
k this deck
58
Use the following to answer the questions below:
Identify whether each of the following samples is a possible bootstrap sample from this original sample: 20, 24, 19, 23, 18
-20, 20, 20, 20, 20
Identify whether each of the following samples is a possible bootstrap sample from this original sample: 20, 24, 19, 23, 18
-20, 20, 20, 20, 20
Unlock Deck
Unlock for access to all 149 flashcards in this deck.
Unlock Deck
k this deck
59
Use the following to answer the questions below:
Identify whether each of the following samples is a possible bootstrap sample from this original sample: 20, 24, 19, 23, 18
-18, 19, 20, 23, 24
Identify whether each of the following samples is a possible bootstrap sample from this original sample: 20, 24, 19, 23, 18
-18, 19, 20, 23, 24
Unlock Deck
Unlock for access to all 149 flashcards in this deck.
Unlock Deck
k this deck
60
A sample of size 46 with a mean of 13.6 is to be used to construct a confidence interval for ?. A bootstrap distribution based on 1,000 samples is created. Where will the bootstrap distribution be centered?
A) 46
B) 13.6
C)
D) 1,000
A) 46
B) 13.6
C)
D) 1,000
Unlock Deck
Unlock for access to all 149 flashcards in this deck.
Unlock Deck
k this deck
61
A sample of n = 10 Illinois gas stations had an average price of $3.975 per gallon. The national average at this time was $3.63. If we want to use the sample data to construct a 95% confidence interval for the average gas price in Illinois, where would the bootstrap distribution be centered?
A) 3.63
B) 3.80
C) 3.975
D) 10
A) 3.63
B) 3.80
C) 3.975
D) 10
Unlock Deck
Unlock for access to all 149 flashcards in this deck.
Unlock Deck
k this deck
62
A bootstrap distribution will be centered at the value of the original statistic.
Unlock Deck
Unlock for access to all 149 flashcards in this deck.
Unlock Deck
k this deck
63
Decreasing the confidence level (say, from 95% to 85%) will cause the width of a typical confidence interval to ________.
A) increase
B) decrease
C) remain the same
A) increase
B) decrease
C) remain the same
Unlock Deck
Unlock for access to all 149 flashcards in this deck.
Unlock Deck
k this deck
64
Use the following to answer the questions below:
An Internet provider contacts a random sample of 300 customers and asks how many hours per week the customers use the Internet. It found the average amount of time spent on the Internet per week to be about 7.2 hours.
-Define the parameter of interest, using the proper notation.
A) = mean number of hours per week all customers use the Internet
B) = 7.2 hours
C) = mean number of hours per week all customers use the Internet
D) = 7.2 hours
An Internet provider contacts a random sample of 300 customers and asks how many hours per week the customers use the Internet. It found the average amount of time spent on the Internet per week to be about 7.2 hours.
-Define the parameter of interest, using the proper notation.
A) = mean number of hours per week all customers use the Internet
B)
= 7.2 hoursC)
= mean number of hours per week all customers use the InternetD) = 7.2 hours
Unlock Deck
Unlock for access to all 149 flashcards in this deck.
Unlock Deck
k this deck
65
Use the following to answer the questions below:
An Internet provider contacts a random sample of 300 customers and asks how many hours per week the customers use the Internet. It found the average amount of time spent on the Internet per week to be about 7.2 hours.
-Use the information from the sample to give the best estimate of the population parameter.
A) = 7.2 hours
B) = mean number of hours per week all customers use the Internet
C) = mean number of hours per week all customers use the Internet
D) = 7.2 hours
An Internet provider contacts a random sample of 300 customers and asks how many hours per week the customers use the Internet. It found the average amount of time spent on the Internet per week to be about 7.2 hours.
-Use the information from the sample to give the best estimate of the population parameter.
A)
= 7.2 hoursB) = mean number of hours per week all customers use the Internet
C)
= mean number of hours per week all customers use the InternetD) = 7.2 hours
Unlock Deck
Unlock for access to all 149 flashcards in this deck.
Unlock Deck
k this deck
66
Use the following to answer the questions below:
An Internet provider contacts a random sample of 300 customers and asks how many hours per week the customers use the Internet. It found the average amount of time spent on the Internet per week to be about 7.2 hours.
-Describe how to use the data to select one bootstrap sample. What statistic is recorded from this sample?
Unlock Deck
Unlock for access to all 149 flashcards in this deck.
Unlock Deck
k this deck
67
Use the following to answer the questions below:
An Internet provider contacts a random sample of 300 customers and asks how many hours per week the customers use the Internet. It found the average amount of time spent on the Internet per week to be about 7.2 hours.
-The standard error is about 0.458. Find a 95% confidence interval for the parameter. Round the margin of error to two decimal places.
A) 6.28 to 8.12 hours
B) 7.04 to 7.66 hours
C) 5.82 to 8.58 hours
D) 6.77 to 7.43 hours
Unlock Deck
Unlock for access to all 149 flashcards in this deck.
Unlock Deck
k this deck
68
Use the following to answer the questions below:
An Internet provider contacts a random sample of 300 customers and asks how many hours per week the customers use the Internet. It found the average amount of time spent on the Internet per week to be about 7.2 hours.
-Percentiles of the bootstrap distribution are provided. Use the percentiles to report a 95% confidence interval for the parameter.
A) 6.322 hours to 8.082 hours
B) 6.438 hours to 7.947 hours
C) 6.174 hours to 8.304 hours
D) 6.593 hours to 7.78 hours
Unlock Deck
Unlock for access to all 149 flashcards in this deck.
Unlock Deck
k this deck
69
Use the following to answer the questions below:
An Internet provider contacts a random sample of 300 customers and asks how many hours per week the customers use the Internet. It found the average amount of time spent on the Internet per week to be about 7.2 hours.
-Percentiles of the bootstrap distribution are provided. Use the percentiles to report a 90% confidence interval for the parameter.
A) 6.438 hours to 7.947 hours
B) 6.322 hours to 8.082 hours
C) 6.174 hours to 8.304 hours
D) 6.593 hours to 7.78 hours
Unlock Deck
Unlock for access to all 149 flashcards in this deck.
Unlock Deck
k this deck
70
Use the following to answer the questions below:
Suppose that a 95% confidence interval for the slope of a regression line based on a sample of size n = 100 and the percentiles of the slopes for 1,000 bootstrap samples goes from 2.50 to 2.80. For each change described (with all else staying the same), indicate which of the three confidence intervals would be the most likely result.
-Decrease the sample size to n = 60.
A) 2.53 to 2.77 (narrower)
B) 2.50 to 2.80 (the same)
C) 2.46 to 2.84 (wider)
Unlock Deck
Unlock for access to all 149 flashcards in this deck.
Unlock Deck
k this deck
71
Use the following to answer the questions below:
Suppose that a 95% confidence interval for the slope of a regression line based on a sample of size n = 100 and the percentiles of the slopes for 1,000 bootstrap samples goes from 2.50 to 2.80. For each change described (with all else staying the same), indicate which of the three confidence intervals would be the most likely result.
-Increase the confidence level to 99%.
A) 2.53 to 2.77 (narrower)
B) 2.50 to 2.80 (the same)
C) 2.46 to 2.84 (wider)
Unlock Deck
Unlock for access to all 149 flashcards in this deck.
Unlock Deck
k this deck
72
Use the following to answer the questions below:
Suppose that a 95% confidence interval for the slope of a regression line based on a sample of size n = 100 and the percentiles of the slopes for 1,000 bootstrap samples goes from 2.50 to 2.80. For each change described (with all else staying the same), indicate which of the three confidence intervals would be the most likely result.
-Increase the number of bootstrap samples to 5,000.
A) 2.53 to 2.77 (narrower)
B) 2.50 to 2.80 (the same)
C) 2.46 to 2.84 (wider)
Unlock Deck
Unlock for access to all 149 flashcards in this deck.
Unlock Deck
k this deck
73
Use the following to answer the questions below:
Suppose we are interested in comparing the proportion of male students who smoke to the proportion of female students who smoke. We have a random sample of 150 students (60 males and 90 females) that includes two variables: Smoke = "yes" or "no" and Gender = "female (F)" or "male (M)." The two-way table below summarizes the results.
?
-If the parameter of interest is the difference in proportions, pm - pf, where pm and pf represent the proportion of smokers in each gender, find a point estimate for this difference in proportions based on the data in the table. Report your answer with two decimal places.
Unlock Deck
Unlock for access to all 149 flashcards in this deck.
Unlock Deck
k this deck
74
Use the following to answer the questions below:
Suppose we are interested in comparing the proportion of male students who smoke to the proportion of female students who smoke. We have a random sample of 150 students (60 males and 90 females) that includes two variables: Smoke = "yes" or "no" and Gender = "female (F)" or "male (M)." The two-way table below summarizes the results.
-Describe how to use the data to construct a bootstrap distribution. What value should be recorded for each of the bootstrap samples.
Unlock Deck
Unlock for access to all 149 flashcards in this deck.
Unlock Deck
k this deck
75
Use the following to answer the questions below:
Suppose we are interested in comparing the proportion of male students who smoke to the proportion of female students who smoke. We have a random sample of 150 students (60 males and 90 females) that includes two variables: Smoke = "yes" or "no" and Gender = "female (F)" or "male (M)." The two-way table below summarizes the results.
?
-Use technology to construct a bootstrap distribution with at least 1,000 samples and estimate the standard error.
A) SE = 0.056
B) SE = 0.067
C) SE = 0.072
D) SE = 0.079
Unlock Deck
Unlock for access to all 149 flashcards in this deck.
Unlock Deck
k this deck
76
Use the following to answer the questions below:
Suppose we are interested in comparing the proportion of male students who smoke to the proportion of female students who smoke. We have a random sample of 150 students (60 males and 90 females) that includes two variables: Smoke = "yes" or "no" and Gender = "female (F)" or "male (M)." The two-way table below summarizes the results.
-Use the estimate of the standard error to construct a 95% confidence interval for the difference in the proportion of smokers between male and female students, Round the margin of error to three decimal places. Provide an interpretation of the interval in the context of this data situation.
Suppose we are interested in comparing the proportion of male students who smoke to the proportion of female students who smoke. We have a random sample of 150 students (60 males and 90 females) that includes two variables: Smoke = "yes" or "no" and Gender = "female (F)" or "male (M)." The two-way table below summarizes the results.
-Use the estimate of the standard error to construct a 95% confidence interval for the difference in the proportion of smokers between male and female students,
Round the margin of error to three decimal places. Provide an interpretation of the interval in the context of this data situation. Unlock Deck
Unlock for access to all 149 flashcards in this deck.
Unlock Deck
k this deck
77
Use the following to answer the questions below:
Suppose we are interested in comparing the proportion of male students who smoke to the proportion of female students who smoke. We have a random sample of 150 students (60 males and 90 females) that includes two variables: Smoke = "yes" or "no" and Gender = "female (F)" or "male (M)." The two-way table below summarizes the results.
?
-You wish to provide a 98% confidence interval for the difference in the proportion of smokers between male and female students. State which percentiles of your bootstrap distribution you would use.
A) Use the 1%- and 99%-tiles
B) Use the 2%- and 98%-tiles
C) Use the 4%- and 96%-tiles
D) Use the 5%- and 95%-tiles
Unlock Deck
Unlock for access to all 149 flashcards in this deck.
Unlock Deck
k this deck
78
Use the following to answer the questions below:
Suppose we are interested in comparing the proportion of male students who smoke to the proportion of female students who smoke. We have a random sample of 150 students (60 males and 90 females) that includes two variables: Smoke = "yes" or "no" and Gender = "female (F)" or "male (M)." The two-way table below summarizes the results.
-If the parameter of interest is the difference in proportions, - , where and , represent the proportion of smokers in each gender, find a point estimate for this difference in proportions based on the data in the table. Report your answer with two decimal places.
Suppose we are interested in comparing the proportion of male students who smoke to the proportion of female students who smoke. We have a random sample of 150 students (60 males and 90 females) that includes two variables: Smoke = "yes" or "no" and Gender = "female (F)" or "male (M)." The two-way table below summarizes the results.
-If the parameter of interest is the difference in proportions,
- , where and , represent the proportion of smokers in each gender, find a point estimate for this difference in proportions based on the data in the table. Report your answer with two decimal places. Unlock Deck
Unlock for access to all 149 flashcards in this deck.
Unlock Deck
k this deck
79
Use the following to answer the questions below:
Suppose we are interested in comparing the proportion of male students who smoke to the proportion of female students who smoke. We have a random sample of 150 students (60 males and 90 females) that includes two variables: Smoke = "yes" or "no" and Gender = "female (F)" or "male (M)." The two-way table below summarizes the results.
-Describe how to use the data to construct a bootstrap distribution. What value should be recorded for each of the bootstrap samples.
Unlock Deck
Unlock for access to all 149 flashcards in this deck.
Unlock Deck
k this deck
80
Use the following to answer the questions below:
Suppose we are interested in comparing the proportion of male students who smoke to the proportion of female students who smoke. We have a random sample of 150 students (60 males and 90 females) that includes two variables: Smoke = "yes" or "no" and Gender = "female (F)" or "male (M)." The two-way table below summarizes the results.
-Where should the bootstrap distribution be centered?
A) 0.0
B) 0.05
C) 0.10
D) 0.15
Unlock Deck
Unlock for access to all 149 flashcards in this deck.
Unlock Deck
k this deck
Unlock Deck
Unlock for access to all 149 flashcards in this deck.


