Exam 3: Confidence Intervals
Exam 1: Collecting Data68 Questions
Exam 2: Describing Data127 Questions
Exam 3: Confidence Intervals149 Questions
Exam 4: Hypothesis Tests117 Questions
Exam 5: Approximating With a Distribution74 Questions
Exam 6: Inference for Means and Proportions166 Questions
Exam 7: CHI-Square Tests for Categorical Variables45 Questions
Exam 8: Anova to Compare Means53 Questions
Exam 9: Inference for Regression123 Questions
Exam 10: Multiple Regression72 Questions
Select questions type
Use the following to answer the questions below:
According to U.S. Census data, 71.6% of Americans are age 21 and over. The provided figure shows possible sampling distributions for the proportion of a sample age 21 and over, for samples of size n = 50, n = 125, and n = 250.
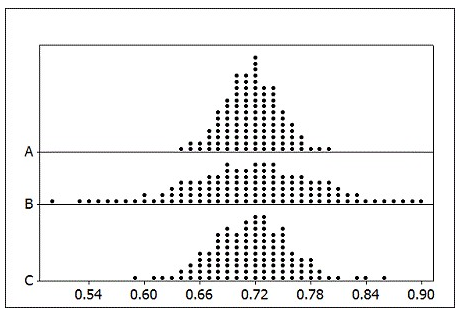 Match the sample sizes (n = 50, n = 125, and n = 250) to their sampling distribution.
-Sample B: n = ________
Match the sample sizes (n = 50, n = 125, and n = 250) to their sampling distribution.
-Sample B: n = ________
Free
(Short Answer)
5.0/5  (36)
(36)
Correct Answer: Verified
50
Use the following to answer the questions below:
Identify if each of the following statements is a proper interpretation of a 95% confidence interval.
-95% of the possible samples from this population will have sample statistics in this particular interval.
Free
(True/False)
4.9/5 (37)
Correct Answer:Verified
False
Use the following to answer the questions below:
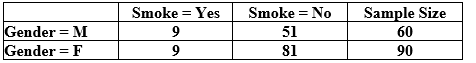
Suppose we are interested in comparing the proportion of male students who smoke to the proportion of female students who smoke. We have a random sample of 150 students (60 males and 90 females) that includes two variables: Smoke = "yes" or "no" and Gender = "female (F)" or "male (M)." The two-way table below summarizes the results.
 -Where should the bootstrap distribution be centered?
Free
(Multiple Choice)
4.8/5 (41)
Correct Answer:Verified
B
Use the following to answer the questions below:
To create a confidence interval from a bootstrap distribution using percentiles, we keep the middle values and chop off a certain percentage from each tail. Indicate what percent of values must be chopped off from each tail for each confidence level.
-95%
(Short Answer)
4.9/5 (28)
Use the following to answer the questions below:
There are 24 students enrolled in an introductory statistics class at a small university. As an in-class exercise the students were asked how many hours of television they watch each week. Their responses, broken down by gender, are summarized in the provided table. Assume that the students enrolled in the statistics class are representative of all students at the university.
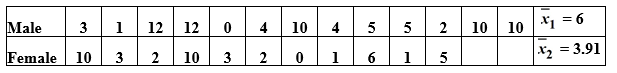 -Percentiles of the bootstrap distribution (based on 5,000 samples) are provided. Use the percentiles to provide a 95% confidence interval for the difference in the mean number of hours spent watching television for males and females at this university. Indicate which percentiles you are using.
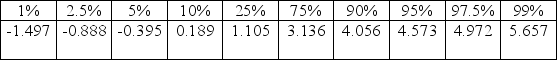
(Multiple Choice)
4.9/5 (36)
Use the following to answer the questions below:
November 6, 2012 was election day. Many of the major television networks aired coverage of the incoming election results during the primetime hours. The provided table displays the amount of time (in minutes) spent watching election coverage for a random sample of 25 U.S. adults.
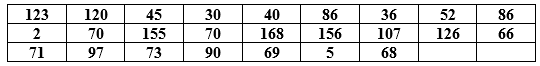 -Use the data from the sample to estimate the parameter of interest. Report your answer with two decimal places.
(Multiple Choice)
4.8/5 (34)
Use the following to answer the questions below:
Identify if each of the following statements is a proper interpretation of a 95% confidence interval.
-I am 95% sure that this interval will contain the population parameter.
(True/False)
4.8/5 (46)
Use the following to answer the questions below:
A sample of 148 college students reports sleeping an average of 6.85 hours on weeknights, with a margin of error of 0.35 hours. Based on this information, identify each of the following as plausible or not for the average amount of sleep college students get on weeknights.
-7.5 hours
(Multiple Choice)
4.9/5 (36)
Use the following to answer the questions below:
There are 24 students enrolled in an introductory statistics class at a small university. As an in-class exercise the students were asked how many hours of television they watch each week. Their responses, broken down by gender, are summarized in the provided table. Assume that the students enrolled in the statistics class are representative of all students at the university.
-The standard error is estimated to be 1.511. Construct and interpret the 95% confidence interval in the context of this data situation.
(Essay)
4.9/5 (37)
Use the following to answer the questions below:
Suppose we are interested in comparing the proportion of male students who smoke to the proportion of female students who smoke. We have a random sample of 150 students (60 males and 90 females) that includes two variables: Smoke = "yes" or "no" and Gender = "female (F)" or "male (M)." The two-way table below summarizes the results.
-Describe how to use the data to construct a bootstrap distribution. What value should be recorded for each of the bootstrap samples.
(Essay)
4.8/5 (34)
Use the following to answer the questions below:
A random sample of 200 students shows that 62% of students use the Student Health Center at some point during their time on campus, with a margin of error of ± 4%. Based on this information, identify each of the following as plausible or not for the percent of the entire student body that use the Student Health Center at some point during their time on campus.
-65%
(Multiple Choice)
4.7/5 (42)
Decreasing the confidence level (say, from 95% to 85%) will cause the width of a typical confidence interval to ________.
(Multiple Choice)
4.9/5 (37)
Use the following to answer the questions below:
Identify each of the following as either a parameter or a statistic, and give the correct notation.
-Briefly explain the distinction between a parameter and a statistic.
(Essay)
4.8/5 (39)
Use the following to answer the questions below:
A study to investigate the dominant paws in cats was described in the scientific journal Animal Behaviour. The researchers used a random sample of 42 domestic cats. In this study, each cat was shown a treat (5 grams of tuna), and while the cat watched, the food was placed inside a jar. The opening of the jar was small enough that the cat could not stick its head inside to remove the treat. The researcher recorded the paw that was first used by the cat to try to retrieve the treat. This was repeated 100 times for each cat (over a span of several days). The paw used most often was deemed the dominant paw (note that one cat used both paws equally and was classified as "ambidextrous"). Of the 42 cats studied, 20 were classified as "left-pawed."
-Describe how to use the data to construct a bootstrap distribution. What value should be recorded for each of the bootstrap samples?
(Essay)
4.9/5 (25)
A sample of n = 10 Illinois gas stations had an average price of $3.975 per gallon. The national average at this time was $3.63. If we want to use the sample data to construct a 95% confidence interval for the average gas price in Illinois, where would the bootstrap distribution be centered?
(Multiple Choice)
4.8/5 (41)
Use the following to answer the questions below:
November 6, 2012 was election day. Many of the major television networks aired coverage of the incoming election results during the primetime hours. The provided table displays the amount of time (in minutes) spent watching election coverage for a random sample of 25 U.S. adults.
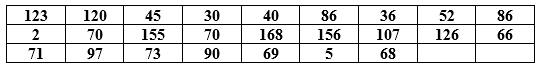 -Describe how to use the data to construct a bootstrap distribution. What value should be recorded for each of the bootstrap samples?
(Essay)
4.9/5 (36)
Use the following to answer the questions below:
The sampling distribution shows sample proportions from samples of size n = 35.
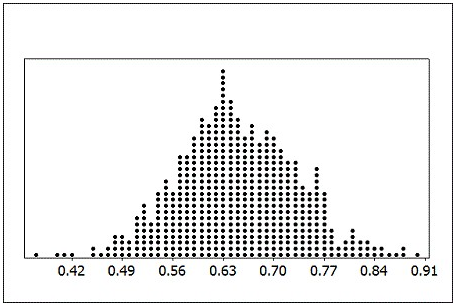 -What does one dot on the sampling distribution represent?
(Essay)
4.7/5 (35)
Use the following to answer the questions below:
In a recent Gallup survey of 1,012 randomly selected U.S. adults (age 18 and over), 53% said that they were dissatisfied with the quality of education students receive in kindergarten through grade 12. They also report that the "margin of sampling error is plus or minus 4%."
-What is the population parameter of interest, and what is the correct notation for this parameter?
(Multiple Choice)
4.8/5 (28)
Use the following to answer the questions below:
To create a confidence interval from a bootstrap distribution using percentiles, we keep the middle values and chop off a certain percentage from each tail. Indicate what percent of values must be chopped off from each tail for each confidence level.
-80%
(Short Answer)
4.7/5 (29)
Use the following to answer the questions below:
A random sample of 200 students shows that 62% of students use the Student Health Center at some point during their time on campus, with a margin of error of ± 4%. Based on this information, identify each of the following as plausible or not for the percent of the entire student body that use the Student Health Center at some point during their time on campus.
-50%
(Multiple Choice)
4.9/5 (30)
Filters
- Essay(0)
- Multiple Choice(0)
- Short Answer(0)
- True False(0)
- Matching(0)