Deck 2: Describing Data
Full screen (f)
Question
Use the following to answer the questions below:
February 12, 2009 marked the 200 th anniversary of Charles Darwin's birth. To celebrate, Gallup, a national polling organization, surveyed 1,018 Americans about their education level and their beliefs about the theory of evolution. The survey results are displayed in the provided two-way table.
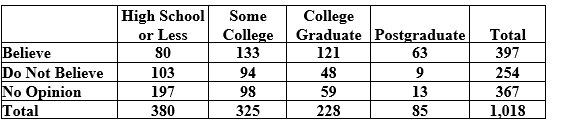
-What proportion of respondents have a college degree? Round your answer to three decimal places.
February 12, 2009 marked the 200 th anniversary of Charles Darwin's birth. To celebrate, Gallup, a national polling organization, surveyed 1,018 Americans about their education level and their beliefs about the theory of evolution. The survey results are displayed in the provided two-way table.
-What proportion of respondents have a college degree? Round your answer to three decimal places.
Question
Use the following to answer the questions below:
February 12, 2009 marked the 200 th anniversary of Charles Darwin's birth. To celebrate, Gallup, a national polling organization, surveyed 1,018 Americans about their education level and their beliefs about the theory of evolution. The survey results are displayed in the provided two-way table.
-What proportion of respondents have no opinion on the theory of evolution? Round your answer to two decimal places.
Question
Use the following to answer the questions below:
February 12, 2009 marked the 200 th anniversary of Charles Darwin's birth. To celebrate, Gallup, a national polling organization, surveyed 1,018 Americans about their education level and their beliefs about the theory of evolution. The survey results are displayed in the provided two-way table.
-What proportion of non-believers have a high school education or less? Use four decimal places in your answer.
Question
Use the following to answer the questions below:
February 12, 2009 marked the 200 th anniversary of Charles Darwin's birth. To celebrate, Gallup, a national polling organization, surveyed 1,018 Americans about their education level and their beliefs about the theory of evolution. The survey results are displayed in the provided two-way table.
-What proportion of college graduates believe in the theory of evolution? Use four decimal places in your answer.
Question
Use the following to answer the questions below:
February 12, 2009 marked the 200 th anniversary of Charles Darwin's birth. To celebrate, Gallup, a national polling organization, surveyed 1,018 Americans about their education level and their beliefs about the theory of evolution. The survey results are displayed in the provided two-way table.
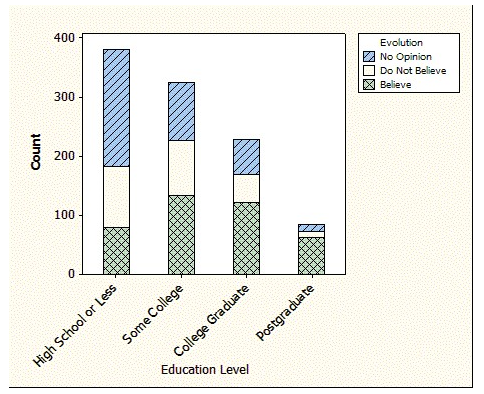
-Find the proportion of respondents who believe in evolution for each education level (round each to three decimal places). Does there seem to be an association between education level and belief in evolution? If so, in what direction?
February 12, 2009 marked the 200 th anniversary of Charles Darwin's birth. To celebrate, Gallup, a national polling organization, surveyed 1,018 Americans about their education level and their beliefs about the theory of evolution. The survey results are displayed in the provided two-way table.
-Find the proportion of respondents who believe in evolution for each education level (round each to three decimal places). Does there seem to be an association between education level and belief in evolution? If so, in what direction?
Question
The survey results are displayed in the segmented bar chart. Does there appear to be an association between education level and belief in the theory of evolution? If so, what does it mean about these two variables?
Question
Question
Question
Question
Question
Question
Question
Question
Question
Question
Use the following to answer the questions below:
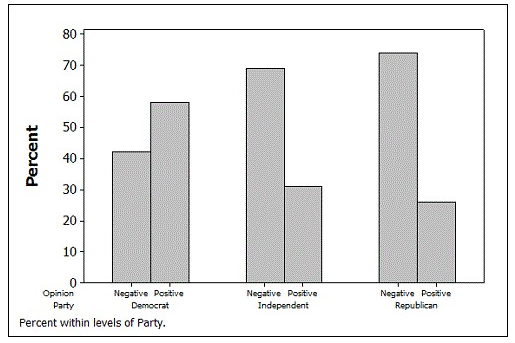
In a survey conducted by the Gallup organization September 6-9, 2012, 1,017 adults were asked, "In general, how much trust and confidence do you have in the mass media-such as newspapers, TV, and radio-when it comes to reporting the news fully, accurately, and fairly?" 81 said that they had a "great deal" of confidence, 325 said they had a "fair amount" of confidence, 397 said they had "not very much" confidence, and 214 said they had "no confidence at all."
-In the article, they discuss the association between political party and opinion about the media ("positive" = great deal/fair amount of confidence and "negative" = not very much confidence/none at all). The results, as percentages, are displayed in the side-by-side bar charts. Describe the association between political party and opinion about the media. Use the bar chart to estimate the proportion of individuals with positive opinions about the media for each political party.
?
Question
Question
Use the following to answer the questions below:
In a recent survey, Gallup asked a sample of U.S. adults if they would prefer to have a job outside the home, or if they would prefer to stay home to care for the family and home. Partial results for the individuals who expressed a preference, broken down by gender, are displayed in the two-way table.
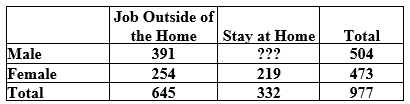
-Find the number of males who would prefer to stay at home.
In a recent survey, Gallup asked a sample of U.S. adults if they would prefer to have a job outside the home, or if they would prefer to stay home to care for the family and home. Partial results for the individuals who expressed a preference, broken down by gender, are displayed in the two-way table.
-Find the number of males who would prefer to stay at home.
Question
Use the following to answer the questions below:
In a recent survey, Gallup asked a sample of U.S. adults if they would prefer to have a job outside the home, or if they would prefer to stay home to care for the family and home. Partial results for the individuals who expressed a preference, broken down by gender, are displayed in the two-way table.
-What proportion of respondents would prefer to stay at home? Round your answer to two decimal places.
Question
Use the following to answer the questions below:
In a recent survey, Gallup asked a sample of U.S. adults if they would prefer to have a job outside the home, or if they would prefer to stay home to care for the family and home. Partial results for the individuals who expressed a preference, broken down by gender, are displayed in the two-way table.
-Compute the difference in the proportion of men who would prefer a job outside of the home and the proportion of females who would prefer a job outside of the home. Use two decimal places in your answer.
Question
Use the following to answer the questions below:
In a recent survey, Gallup asked a sample of U.S. adults if they would prefer to have a job outside the home, or if they would prefer to stay home to care for the family and home. Partial results for the individuals who expressed a preference, broken down by gender, are displayed in the two-way table.
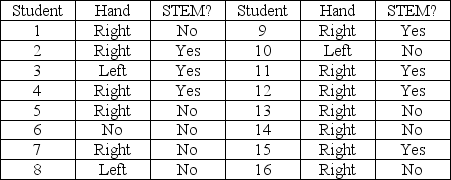
-Students in a small statistics class were asked which was their dominant hand and if they were in a STEM (science, technology, engineering, and math) major. Their results are listed below. Use the results to construct a two-way table.
In a recent survey, Gallup asked a sample of U.S. adults if they would prefer to have a job outside the home, or if they would prefer to stay home to care for the family and home. Partial results for the individuals who expressed a preference, broken down by gender, are displayed in the two-way table.
-Students in a small statistics class were asked which was their dominant hand and if they were in a STEM (science, technology, engineering, and math) major. Their results are listed below. Use the results to construct a two-way table.
Question
Question
Question
Question
Use the dataset to calculate the following summary statistics in the questions below. Report each with one decimal place.
- Median
-
Median Question
Use the dataset to calculate the following summary statistics in the questions below. Report each with one decimal place.
- Mean
Mean
-
Mean Question
Use the following to answer the questions below:
The provided histogram displays the number of Facebook friends for students in a small statistics class.
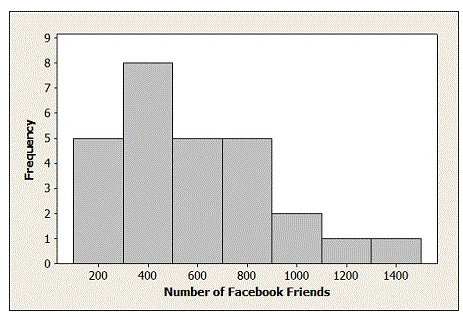
-Which of the following best describes the shape of the distribution of the number of Facebook friends?
A) Skewed to the left
B) Roughly symmetric
C) Skewed to the right
The provided histogram displays the number of Facebook friends for students in a small statistics class.
-Which of the following best describes the shape of the distribution of the number of Facebook friends?
A) Skewed to the left
B) Roughly symmetric
C) Skewed to the right
Question
Use the following to answer the questions below:
The provided histogram displays the number of Facebook friends for students in a small statistics class.
-The mean number of Facebook friends is closest to which value?
A) 220 friends
B) 560 friends
C) 810 friends
D) 1,000 friends
The provided histogram displays the number of Facebook friends for students in a small statistics class.
-The mean number of Facebook friends is closest to which value?
A) 220 friends
B) 560 friends
C) 810 friends
D) 1,000 friends
Question
Use the following to answer the questions below:
The provided histogram displays the number of Facebook friends for students in a small statistics class.
-The median number of Facebook friends is likely closest to which value?
A) 300
B) 500
C) 700
D) 800
The provided histogram displays the number of Facebook friends for students in a small statistics class.
-The median number of Facebook friends is likely closest to which value?
A) 300
B) 500
C) 700
D) 800
Question
Use the following to answer the questions below:
The finishing time for the top 100 men in a marathon are displayed in the provided figure.
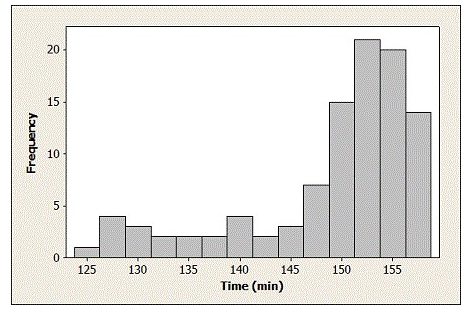
-Which of the following best describes the distribution of times for the top 100 male finishers in the marathon?
A) Skewed to the left
B) Roughly symmetric
C) Skewed to the right
The finishing time for the top 100 men in a marathon are displayed in the provided figure.
-Which of the following best describes the distribution of times for the top 100 male finishers in the marathon?
A) Skewed to the left
B) Roughly symmetric
C) Skewed to the right
Question
Use the following to answer the questions below:
The finishing time for the top 100 men in a marathon are displayed in the provided figure.
-The mean time for the top 100 males is closest to which value?
A) 148 minutes
B) 151 minutes
C) 140 minutes
D) 135 minutes
The finishing time for the top 100 men in a marathon are displayed in the provided figure.
-The mean time for the top 100 males is closest to which value?
A) 148 minutes
B) 151 minutes
C) 140 minutes
D) 135 minutes
Question
Use the following to answer the questions below:
The finishing time for the top 100 men in a marathon are displayed in the provided figure.
-The median time for the top 100 males is closest to which value?
A) 156 minutes
B) 140 minutes
C) 145 minutes
D) 151 minutes
The finishing time for the top 100 men in a marathon are displayed in the provided figure.
-The median time for the top 100 males is closest to which value?
A) 156 minutes
B) 140 minutes
C) 145 minutes
D) 151 minutes
Question
Use the following to answer the questions below:
The midrange is another way to measure of the center of a distribution. The midrange of a dataset is defined to be the average of the minimum and maximum values in the dataset.
-Calculate the midrange of this dataset.

The midrange is another way to measure of the center of a distribution. The midrange of a dataset is defined to be the average of the minimum and maximum values in the dataset.
-Calculate the midrange of this dataset.
Question
Question
Question
Question
Use the dataset to compute the following summary statistics in the questions below.
- Median
-
Median Question
Use the dataset to compute the following summary statistics in the questions below.
- Mean (rounded to two decimal places)
-
Mean (rounded to two decimal places) Question
Use the dataset to compute the following summary statistics in the questions below.
- Q1
Q1
-
Q1 Question
Use the dataset to compute the following summary statistics in the questions below.
- Q3
Q3
-
Q3 Question
Use the dataset to compute the following summary statistics in the questions below.
- IQR
IQR
-
IQR Question
Use the dataset to compute the following summary statistics in the questions below.
- Range
Range
-
Range Question
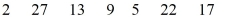
Each of the variables displayed in the histograms below has a mean of 14.5, a range of 8, and 59 observations. Rank the three variables according to their standard deviations, from the smallest to the largest.
A) A, B, C
B) B, A, C
C) C, B, A
D) A, C, B
A) A, B, C
B) B, A, C
C) C, B, A
D) A, C, B
Question
Question
Question
Use the following to answer the questions below:
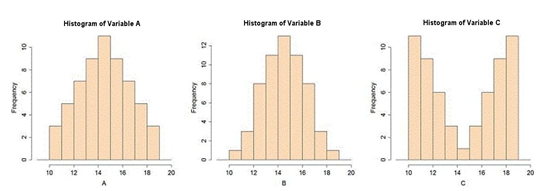
Scores on an exam (out of 100 points) given in a large introductory statistics course are displayed in the provided histogram.
-Which best describes the shape of the distribution of exam scores?
A) Approximately symmetric
B) Skewed to the left
C) Skewed to the right
Scores on an exam (out of 100 points) given in a large introductory statistics course are displayed in the provided histogram.
-Which best describes the shape of the distribution of exam scores?
A) Approximately symmetric
B) Skewed to the left
C) Skewed to the right
Question
Use the following to answer the questions below:
Scores on an exam (out of 100 points) given in a large introductory statistics course are displayed in the provided histogram.
-Based on the histogram, which value is likely the mean exam score?
A) 82
B) 88
C) 76
D) 92
Scores on an exam (out of 100 points) given in a large introductory statistics course are displayed in the provided histogram.
-Based on the histogram, which value is likely the mean exam score?
A) 82
B) 88
C) 76
D) 92
Question
Use the following to answer the questions below:
Scores on an exam (out of 100 points) given in a large introductory statistics course are displayed in the provided histogram.
-Based on the histogram of exam scores, which value is likely the median exam score?
A) 92
B) 88
C) 82
D) 72
Scores on an exam (out of 100 points) given in a large introductory statistics course are displayed in the provided histogram.
-Based on the histogram of exam scores, which value is likely the median exam score?
A) 92
B) 88
C) 82
D) 72
Question
Use the following to answer the questions below:
Scores on an exam (out of 100 points) given in a large introductory statistics course are displayed in the provided histogram.
-Based on the histogram, the standard deviation of the exam scores is likely closest to which of these values?
A) 0.5
B) 10
C) 5
D) 1
Scores on an exam (out of 100 points) given in a large introductory statistics course are displayed in the provided histogram.
-Based on the histogram, the standard deviation of the exam scores is likely closest to which of these values?
A) 0.5
B) 10
C) 5
D) 1
Question
Use the following to answer the questions below:
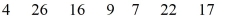
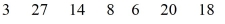
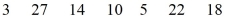
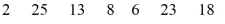
One of the symptoms of the flu is an elevated pulse rate. Pulse rates (in beats per minute) for patients with the flu are provided.

-Give the sample mean pulse rate. Use two decimal places in your answer.
A) 89.35 beats per minute
B) 90 beats per minute
C) 92.5 beats per minute
D) 89 beats per minute
One of the symptoms of the flu is an elevated pulse rate. Pulse rates (in beats per minute) for patients with the flu are provided.
-Give the sample mean pulse rate. Use two decimal places in your answer.
A) 89.35 beats per minute
B) 90 beats per minute
C) 92.5 beats per minute
D) 89 beats per minute
Question
Use the following to answer the questions below:
One of the symptoms of the flu is an elevated pulse rate. Pulse rates (in beats per minute) for patients with the flu are provided.
-Find the standard deviation of the pulse rates. Use two decimal places in your answer.
A) 7.85 beats per minute
B) 8.27 beats per minute
C) 7.33 beats per minute
D) 8.19 beats per minute
Question
Use the following to answer the questions below:
One of the symptoms of the flu is an elevated pulse rate. Pulse rates (in beats per minute) for patients with the flu are provided.
-Give the five-number summary of these pulse rates.
One of the symptoms of the flu is an elevated pulse rate. Pulse rates (in beats per minute) for patients with the flu are provided.
-Give the five-number summary of these pulse rates.
Question
Use the following to answer the questions below:
One of the symptoms of the flu is an elevated pulse rate. Pulse rates (in beats per minute) for patients with the flu are provided.
-Are there any outliers? If so, which data points? Clearly show your work to justify your answer.
One of the symptoms of the flu is an elevated pulse rate. Pulse rates (in beats per minute) for patients with the flu are provided.
-Are there any outliers? If so, which data points? Clearly show your work to justify your answer.
Question
Use the following to answer the questions below:
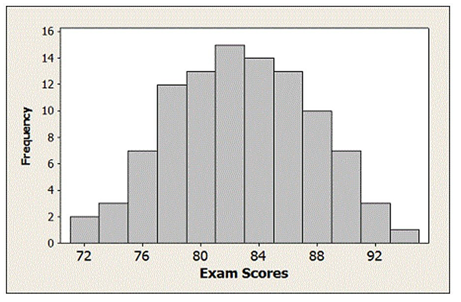
Match the five-number summary to the appropriate boxplot.
- 15, 19, 20, 25, 28
Match the five-number summary to the appropriate boxplot.
- 15, 19, 20, 25, 28
Question
Use the following to answer the questions below:
Match the five-number summary to the appropriate boxplot.
- 1, 3, 4, 6, 8
Match the five-number summary to the appropriate boxplot.
- 1, 3, 4, 6, 8
Question
Use the following to answer the questions below:
Match the five-number summary to the appropriate boxplot.
- 3, 10, 12, 13, 19
Match the five-number summary to the appropriate boxplot.
- 3, 10, 12, 13, 19
Question
Use the following to answer the questions below:
Match the five-number summary to the appropriate boxplot.
- 5, 8, 9, 11, 14
Match the five-number summary to the appropriate boxplot.
- 5, 8, 9, 11, 14
Question
Use the following to answer the questions below:
The provided Minitab output displays descriptive statistics for the amount of financial aid, in thousands of dollars, awarded to a sample of students at a large university.

-How many students are included in the sample?
The provided Minitab output displays descriptive statistics for the amount of financial aid, in thousands of dollars, awarded to a sample of students at a large university.
-How many students are included in the sample?
Question
Use the following to answer the questions below:
The provided Minitab output displays descriptive statistics for the amount of financial aid, in thousands of dollars, awarded to a sample of students at a large university.
-Based on the mean and median financial aid amounts displayed in the summary, which of the following most likely describes the shape of the distribution of financial aid amounts?
A) Slightly skewed to the left
B) Roughly symmetric
C) Slightly skewed to the right
Question
Use the following to answer the questions below:
The provided Minitab output displays descriptive statistics for the amount of financial aid, in thousands of dollars, awarded to a sample of students at a large university.
-Based on the output, give an interval that is certain to contain the 15th percentile of the distribution of financial aid amounts.
Question
Use the following to answer the questions below:
The provided Minitab output displays descriptive statistics for the amount of financial aid, in thousands of dollars, awarded to a sample of students at a large university.
-Based on the output, give an interval that is certain to contain the 60th percentile of the distribution of financial aid amounts.
Question
Use the following to answer the questions below:
The provided Minitab output displays descriptive statistics for the amount of financial aid, in thousands of dollars, awarded to a sample of students at a large university.
-What is the range of financial aid amounts?
The provided Minitab output displays descriptive statistics for the amount of financial aid, in thousands of dollars, awarded to a sample of students at a large university.
-What is the range of financial aid amounts?
Question
Use the following to answer the questions below:
The provided Minitab output displays descriptive statistics for the amount of financial aid, in thousands of dollars, awarded to a sample of students at a large university.
-What is the IQR of financial aid amounts?
The provided Minitab output displays descriptive statistics for the amount of financial aid, in thousands of dollars, awarded to a sample of students at a large university.
-What is the IQR of financial aid amounts?
Question
Use the following to answer the questions below:
The provided Minitab output displays descriptive statistics for the amount of financial aid, in thousands of dollars, awarded to a sample of students at a large university.
-Is the largest financial aid amount an outlier?
The provided Minitab output displays descriptive statistics for the amount of financial aid, in thousands of dollars, awarded to a sample of students at a large university.
-Is the largest financial aid amount an outlier?
Question
Use the following to answer the questions below:
The provided Minitab output displays descriptive statistics for the amount of financial aid, in thousands of dollars, awarded to a sample of students at a large university.
-Find and interpret the z-score for the smallest financial aid amount.
The provided Minitab output displays descriptive statistics for the amount of financial aid, in thousands of dollars, awarded to a sample of students at a large university.
-Find and interpret the z-score for the smallest financial aid amount.
Question
Use the following to answer the questions below:
Students in an introductory statistics course were asked to count the number of scars on their dominant hand (the one they write with the most). The results are displayed in the provided boxplot.
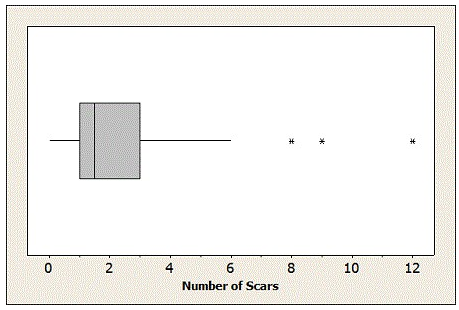
-From the boxplot you can identify how many students are in the class.
Students in an introductory statistics course were asked to count the number of scars on their dominant hand (the one they write with the most). The results are displayed in the provided boxplot.
-From the boxplot you can identify how many students are in the class.
Question
Use the following to answer the questions below:
Students in an introductory statistics course were asked to count the number of scars on their dominant hand (the one they write with the most). The results are displayed in the provided boxplot.
-Use the boxplot to estimate the median number of scars that students in the class have on their dominant hand.
Question
Use the following to answer the questions below:
Students in an introductory statistics course were asked to count the number of scars on their dominant hand (the one they write with the most). The results are displayed in the provided boxplot.
-The distribution of the number of scars would be classified as
A) skewed to the left.
B) roughly symmetric.
C) skewed to the right.
Question
Use the following to answer the questions below:
Students in an introductory statistics course were asked to count the number of scars on their dominant hand (the one they write with the most). The results are displayed in the provided boxplot.
-Calculate the IQR for the distribution of the number of scars students have.
Students in an introductory statistics course were asked to count the number of scars on their dominant hand (the one they write with the most). The results are displayed in the provided boxplot.
-Calculate the IQR for the distribution of the number of scars students have.
Question
Use the following to answer the questions below:
Students in an introductory statistics course were asked to count the number of scars on their dominant hand (the one they write with the most). The results are displayed in the provided boxplot.
-Which answer best describes the following conclusion?
"There are no students with 7 scars on their dominant hand."
A) True
B) False
C) Cannot be determined
Question
Use the following to answer the questions below:
Students in an introductory statistics course were asked to count the number of scars on their dominant hand (the one they write with the most). The results are displayed in the provided boxplot.
-Which answer best describes the following conclusion?
"There are no students with 2 scars on their dominant hand."
A) True
B) False
C) Cannot be determined
Question
Use the following to answer the questions below:
Students in an introductory statistics course were asked to count the number of scars on their dominant hand (the one they write with the most). The results are displayed in the provided boxplot.
-The mean can be determined exactly from the boxplot.
Students in an introductory statistics course were asked to count the number of scars on their dominant hand (the one they write with the most). The results are displayed in the provided boxplot.
-The mean can be determined exactly from the boxplot.
Question
Use the following to answer the questions below:
The side-by-side boxplots compare the top 100 men's and women's finishing times in a marathon.
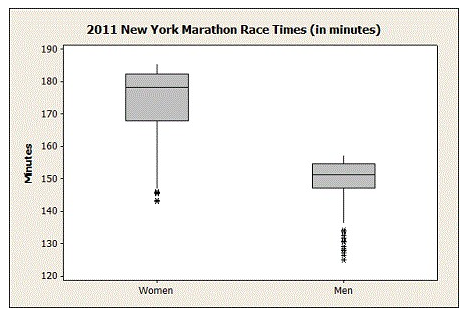
-Which group tends to finish the race faster?
A) Men
B) Women
The side-by-side boxplots compare the top 100 men's and women's finishing times in a marathon.
-Which group tends to finish the race faster?
A) Men
B) Women
Question
Use the following to answer the questions below:
The side-by-side boxplots compare the top 100 men's and women's finishing times in a marathon.
-Which group has the larger spread in its race times?
A) Men
B) Women
The side-by-side boxplots compare the top 100 men's and women's finishing times in a marathon.
-Which group has the larger spread in its race times?
A) Men
B) Women
Question
Use the following to answer the questions below:
The side-by-side boxplots compare the top 100 men's and women's finishing times in a marathon.
-Does there appear to be an association between gender and race time?
The side-by-side boxplots compare the top 100 men's and women's finishing times in a marathon.
-Does there appear to be an association between gender and race time?
Question
Use the following to answer the questions below:
The states located in the Midwestern region of the country typically experience a large number of tornados every year. The number of tornadoes from 2000-2011 for four Midwestern states (Kansas, Nebraska, South Dakota, and Iowa) are displayed in the side-by-side boxplots.
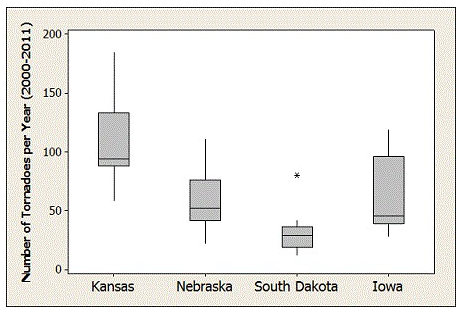
-Which state tends to see the most tornadoes per year?
A) Kansas
B) Nebraska
C) South Dakota
D) Iowa
The states located in the Midwestern region of the country typically experience a large number of tornados every year. The number of tornadoes from 2000-2011 for four Midwestern states (Kansas, Nebraska, South Dakota, and Iowa) are displayed in the side-by-side boxplots.
-Which state tends to see the most tornadoes per year?
A) Kansas
B) Nebraska
C) South Dakota
D) Iowa
Question
Use the following to answer the questions below:
The states located in the Midwestern region of the country typically experience a large number of tornados every year. The number of tornadoes from 2000-2011 for four Midwestern states (Kansas, Nebraska, South Dakota, and Iowa) are displayed in the side-by-side boxplots.
-Which state has the largest range?
A) Kansas
B) Nebraska
C) South Dakota
D) Iowa
Question
Use the following to answer the questions below:
The states located in the Midwestern region of the country typically experience a large number of tornados every year. The number of tornadoes from 2000-2011 for four Midwestern states (Kansas, Nebraska, South Dakota, and Iowa) are displayed in the side-by-side boxplots.
-Which state tends to see the fewest tornadoes per year?
A) Kansas
B) Nebraska
C) South Dakota
D) Iowa
Question
Use the following to answer the questions below:
The states located in the Midwestern region of the country typically experience a large number of tornados every year. The number of tornadoes from 2000-2011 for four Midwestern states (Kansas, Nebraska, South Dakota, and Iowa) are displayed in the side-by-side boxplots.
-Which state has the largest IQR?
A) Kansas
B) Nebraska
C) South Dakota
D) Iowa
Question
Use the following to answer the questions below:
The states located in the Midwestern region of the country typically experience a large number of tornados every year. The number of tornadoes from 2000-2011 for four Midwestern states (Kansas, Nebraska, South Dakota, and Iowa) are displayed in the side-by-side boxplots.
-Which state has an outlier?
A) Kansas
B) Nebraska
C) South Dakota
D) Iowa

Unlock Deck
Sign up to unlock the cards in this deck!
Unlock Deck
Unlock Deck
1/127
Play
Full screen (f)
Deck 2: Describing Data
1
Use the following to answer the questions below:
February 12, 2009 marked the 200 th anniversary of Charles Darwin's birth. To celebrate, Gallup, a national polling organization, surveyed 1,018 Americans about their education level and their beliefs about the theory of evolution. The survey results are displayed in the provided two-way table.
-What proportion of respondents have a college degree? Round your answer to three decimal places.
0.224
2
Use the following to answer the questions below:
February 12, 2009 marked the 200 th anniversary of Charles Darwin's birth. To celebrate, Gallup, a national polling organization, surveyed 1,018 Americans about their education level and their beliefs about the theory of evolution. The survey results are displayed in the provided two-way table.
-What proportion of respondents have no opinion on the theory of evolution? Round your answer to two decimal places.
0.36
3
Use the following to answer the questions below:
February 12, 2009 marked the 200 th anniversary of Charles Darwin's birth. To celebrate, Gallup, a national polling organization, surveyed 1,018 Americans about their education level and their beliefs about the theory of evolution. The survey results are displayed in the provided two-way table.
-What proportion of non-believers have a high school education or less? Use four decimal places in your answer.
0.4055
4
Use the following to answer the questions below:
February 12, 2009 marked the 200 th anniversary of Charles Darwin's birth. To celebrate, Gallup, a national polling organization, surveyed 1,018 Americans about their education level and their beliefs about the theory of evolution. The survey results are displayed in the provided two-way table.
-What proportion of college graduates believe in the theory of evolution? Use four decimal places in your answer.
Unlock Deck
Unlock for access to all 127 flashcards in this deck.
Unlock Deck
k this deck
5
Use the following to answer the questions below:
February 12, 2009 marked the 200 th anniversary of Charles Darwin's birth. To celebrate, Gallup, a national polling organization, surveyed 1,018 Americans about their education level and their beliefs about the theory of evolution. The survey results are displayed in the provided two-way table.
-Find the proportion of respondents who believe in evolution for each education level (round each to three decimal places). Does there seem to be an association between education level and belief in evolution? If so, in what direction?
Unlock Deck
Unlock for access to all 127 flashcards in this deck.
Unlock Deck
k this deck
6
The survey results are displayed in the segmented bar chart. Does there appear to be an association between education level and belief in the theory of evolution? If so, what does it mean about these two variables?
Unlock Deck
Unlock for access to all 127 flashcards in this deck.
Unlock Deck
k this deck
7
Use the statement to answer the following questions below.
-A Fun-Size bag of M&M's contains 4 green, 4 red, 3 yellow, 4 orange, 4 blue, and 3 brown candies.
What proportion of the M&M's are green? Use four decimal places in your answer.
-A Fun-Size bag of M&M's contains 4 green, 4 red, 3 yellow, 4 orange, 4 blue, and 3 brown candies.
What proportion of the M&M's are green? Use four decimal places in your answer.
Unlock Deck
Unlock for access to all 127 flashcards in this deck.
Unlock Deck
k this deck
8
Use the statement to answer the following questions below.
-A Fun-Size bag of M&M's contains 5 green, 4 red, 4 yellow, 3 orange, 4 blue, and 4 brown candies.
What proportion of the candies are yellow or orange? Use four decimal places in your answer.
-A Fun-Size bag of M&M's contains 5 green, 4 red, 4 yellow, 3 orange, 4 blue, and 4 brown candies.
What proportion of the candies are yellow or orange? Use four decimal places in your answer.
Unlock Deck
Unlock for access to all 127 flashcards in this deck.
Unlock Deck
k this deck
9
Use the statement to answer the following questions below.
-A Fun-Size bag of M&M's contains 5 green, 3 red, 3 yellow, 3 orange, 4 blue, and 3 brown candies.
Sketch a bar chart of the data.
-A Fun-Size bag of M&M's contains 5 green, 3 red, 3 yellow, 3 orange, 4 blue, and 3 brown candies.
Sketch a bar chart of the data.
Unlock Deck
Unlock for access to all 127 flashcards in this deck.
Unlock Deck
k this deck
10
Use the statement to answer the following questions below.
-A Fun-Size bag of M&M's contains 4 green, 2 red, 4 yellow, 3 orange, 6 blue, and 1 brown candies.
Construct a relative frequency table of the results. Use two decimal places in your relative frequencies.
-A Fun-Size bag of M&M's contains 4 green, 2 red, 4 yellow, 3 orange, 6 blue, and 1 brown candies.
Construct a relative frequency table of the results. Use two decimal places in your relative frequencies.
Unlock Deck
Unlock for access to all 127 flashcards in this deck.
Unlock Deck
k this deck
11
Use the following to answer the questions below:
In a survey conducted by the Gallup organization September 6-9, 2012, 1,017 adults were asked, "In general, how much trust and confidence do you have in the mass media-such as newspapers, TV, and radio-when it comes to reporting the news fully, accurately, and fairly?" 81 said that they had a "great deal" of confidence, 325 said they had a "fair amount" of confidence, 397 said they had "not very much" confidence, and 214 said they had "no confidence at all."
-Display the results in a frequency table.
Unlock Deck
Unlock for access to all 127 flashcards in this deck.
Unlock Deck
k this deck
12
Use the following to answer the questions below:
In a survey conducted by the Gallup organization September 6-9, 2012, 1,017 adults were asked, "In general, how much trust and confidence do you have in the mass media-such as newspapers, TV, and radio-when it comes to reporting the news fully, accurately, and fairly?" 81 said that they had a "great deal" of confidence, 325 said they had a "fair amount" of confidence, 397 said they had "not very much" confidence, and 214 said they had "no confidence at all."
-Sketch a bar chart of the data.
Unlock Deck
Unlock for access to all 127 flashcards in this deck.
Unlock Deck
k this deck
13
Use the following to answer the questions below:
In a survey conducted by the Gallup organization September 6-9, 2012, 1,017 adults were asked, "In general, how much trust and confidence do you have in the mass media-such as newspapers, TV, and radio-when it comes to reporting the news fully, accurately, and fairly?" 81 said that they had a "great deal" of confidence, 325 said they had a "fair amount" of confidence, 397 said they had "not very much" confidence, and 214 said they had "no confidence at all."
-Give a relative frequency table of the data. Use two decimal places in your relative frequencies.
Unlock Deck
Unlock for access to all 127 flashcards in this deck.
Unlock Deck
k this deck
14
Use the following to answer the questions below:
In a survey conducted by the Gallup organization September 6-9, 2012, 1,017 adults were asked, "In general, how much trust and confidence do you have in the mass media-such as newspapers, TV, and radio-when it comes to reporting the news fully, accurately, and fairly?" 81 said that they had a "great deal" of confidence, 325 said they had a "fair amount" of confidence, 397 said they had "not very much" confidence, and 214 said they had "no confidence at all."
-What proportion of respondents have a great deal of confidence in the media? Use two decimal places in your answer.
Unlock Deck
Unlock for access to all 127 flashcards in this deck.
Unlock Deck
k this deck
15
Use the following to answer the questions below:
In a survey conducted by the Gallup organization September 6-9, 2012, 1,017 adults were asked, "In general, how much trust and confidence do you have in the mass media-such as newspapers, TV, and radio-when it comes to reporting the news fully, accurately, and fairly?" 81 said that they had a "great deal" of confidence, 325 said they had a "fair amount" of confidence, 397 said they had "not very much" confidence, and 214 said they had "no confidence at all."
-What proportion of respondents have a negative opinion (not very much confidence/none at all) about the mass media? Use two decimal places in your answer.
Unlock Deck
Unlock for access to all 127 flashcards in this deck.
Unlock Deck
k this deck
16
Use the following to answer the questions below:
In a survey conducted by the Gallup organization September 6-9, 2012, 1,017 adults were asked, "In general, how much trust and confidence do you have in the mass media-such as newspapers, TV, and radio-when it comes to reporting the news fully, accurately, and fairly?" 81 said that they had a "great deal" of confidence, 325 said they had a "fair amount" of confidence, 397 said they had "not very much" confidence, and 214 said they had "no confidence at all."
-In the article, they discuss the association between political party and opinion about the media ("positive" = great deal/fair amount of confidence and "negative" = not very much confidence/none at all). The results, as percentages, are displayed in the side-by-side bar charts. Describe the association between political party and opinion about the media. Use the bar chart to estimate the proportion of individuals with positive opinions about the media for each political party.
?
Unlock Deck
Unlock for access to all 127 flashcards in this deck.
Unlock Deck
k this deck
17
Use the following to answer the questions below:
In a survey conducted by the Gallup organization September 6-9, 2012, 1,017 adults were asked, "In general, how much trust and confidence do you have in the mass media-such as newspapers, TV, and radio-when it comes to reporting the news fully, accurately, and fairly?" 81 said that they had a "great deal" of confidence, 325 said they had a "fair amount" of confidence, 397 said they had "not very much" confidence, and 214 said they had "no confidence at all."
-In the same article, they compare opinions about the media in 2012 to those in the previous election year (2008). In 2008, 60% of Democrats, 27% of Republicans, and 41% of Independents had positive opinions (great deal/fair amount of confidence) about the media. For each political party, find the difference in the proportion of positive opinions in 2008 and the proportion of positive opinions in 2012. Comment on if/how opinions have changed for the political parties over the past four years.
Unlock Deck
Unlock for access to all 127 flashcards in this deck.
Unlock Deck
k this deck
18
Use the following to answer the questions below:
In a recent survey, Gallup asked a sample of U.S. adults if they would prefer to have a job outside the home, or if they would prefer to stay home to care for the family and home. Partial results for the individuals who expressed a preference, broken down by gender, are displayed in the two-way table.
-Find the number of males who would prefer to stay at home.
Unlock Deck
Unlock for access to all 127 flashcards in this deck.
Unlock Deck
k this deck
19
Use the following to answer the questions below:
In a recent survey, Gallup asked a sample of U.S. adults if they would prefer to have a job outside the home, or if they would prefer to stay home to care for the family and home. Partial results for the individuals who expressed a preference, broken down by gender, are displayed in the two-way table.
-What proportion of respondents would prefer to stay at home? Round your answer to two decimal places.
Unlock Deck
Unlock for access to all 127 flashcards in this deck.
Unlock Deck
k this deck
20
Use the following to answer the questions below:
In a recent survey, Gallup asked a sample of U.S. adults if they would prefer to have a job outside the home, or if they would prefer to stay home to care for the family and home. Partial results for the individuals who expressed a preference, broken down by gender, are displayed in the two-way table.
-Compute the difference in the proportion of men who would prefer a job outside of the home and the proportion of females who would prefer a job outside of the home. Use two decimal places in your answer.
Unlock Deck
Unlock for access to all 127 flashcards in this deck.
Unlock Deck
k this deck
21
Use the following to answer the questions below:
In a recent survey, Gallup asked a sample of U.S. adults if they would prefer to have a job outside the home, or if they would prefer to stay home to care for the family and home. Partial results for the individuals who expressed a preference, broken down by gender, are displayed in the two-way table.
-Students in a small statistics class were asked which was their dominant hand and if they were in a STEM (science, technology, engineering, and math) major. Their results are listed below. Use the results to construct a two-way table.
Unlock Deck
Unlock for access to all 127 flashcards in this deck.
Unlock Deck
k this deck
22
If a distribution is heavily skewed to the left, which relationship between the mean and median is most likely?
A) Mean < Median
B) Mean Median
C) Mean > Median
A) Mean < Median
B) Mean Median
C) Mean > Median
Unlock Deck
Unlock for access to all 127 flashcards in this deck.
Unlock Deck
k this deck
23
If a distribution is roughly symmetric, which relationship between the mean and median is likely true?
A) Mean < Median
B) Mean Median
C) Mean > Median
A) Mean < Median
B) Mean Median
C) Mean > Median
Unlock Deck
Unlock for access to all 127 flashcards in this deck.
Unlock Deck
k this deck
24
If a distribution is heavily skewed to the right, which relationship between the mean and median is likely true?
A) Mean < Median
B) Mean Median
C) Mean > Median
A) Mean < Median
B) Mean Median
C) Mean > Median
Unlock Deck
Unlock for access to all 127 flashcards in this deck.
Unlock Deck
k this deck
25
Use the dataset to calculate the following summary statistics in the questions below. Report each with one decimal place.
- Median
-
Median Unlock Deck
Unlock for access to all 127 flashcards in this deck.
Unlock Deck
k this deck
26
Use the dataset to calculate the following summary statistics in the questions below. Report each with one decimal place.
- Mean
-
Mean Unlock Deck
Unlock for access to all 127 flashcards in this deck.
Unlock Deck
k this deck
27
Use the following to answer the questions below:
The provided histogram displays the number of Facebook friends for students in a small statistics class.
-Which of the following best describes the shape of the distribution of the number of Facebook friends?
A) Skewed to the left
B) Roughly symmetric
C) Skewed to the right
The provided histogram displays the number of Facebook friends for students in a small statistics class.
-Which of the following best describes the shape of the distribution of the number of Facebook friends?
A) Skewed to the left
B) Roughly symmetric
C) Skewed to the right
Unlock Deck
Unlock for access to all 127 flashcards in this deck.
Unlock Deck
k this deck
28
Use the following to answer the questions below:
The provided histogram displays the number of Facebook friends for students in a small statistics class.
-The mean number of Facebook friends is closest to which value?
A) 220 friends
B) 560 friends
C) 810 friends
D) 1,000 friends
The provided histogram displays the number of Facebook friends for students in a small statistics class.
-The mean number of Facebook friends is closest to which value?
A) 220 friends
B) 560 friends
C) 810 friends
D) 1,000 friends
Unlock Deck
Unlock for access to all 127 flashcards in this deck.
Unlock Deck
k this deck
29
Use the following to answer the questions below:
The provided histogram displays the number of Facebook friends for students in a small statistics class.
-The median number of Facebook friends is likely closest to which value?
A) 300
B) 500
C) 700
D) 800
The provided histogram displays the number of Facebook friends for students in a small statistics class.
-The median number of Facebook friends is likely closest to which value?
A) 300
B) 500
C) 700
D) 800
Unlock Deck
Unlock for access to all 127 flashcards in this deck.
Unlock Deck
k this deck
30
Use the following to answer the questions below:
The finishing time for the top 100 men in a marathon are displayed in the provided figure.
-Which of the following best describes the distribution of times for the top 100 male finishers in the marathon?
A) Skewed to the left
B) Roughly symmetric
C) Skewed to the right
The finishing time for the top 100 men in a marathon are displayed in the provided figure.
-Which of the following best describes the distribution of times for the top 100 male finishers in the marathon?
A) Skewed to the left
B) Roughly symmetric
C) Skewed to the right
Unlock Deck
Unlock for access to all 127 flashcards in this deck.
Unlock Deck
k this deck
31
Use the following to answer the questions below:
The finishing time for the top 100 men in a marathon are displayed in the provided figure.
-The mean time for the top 100 males is closest to which value?
A) 148 minutes
B) 151 minutes
C) 140 minutes
D) 135 minutes
The finishing time for the top 100 men in a marathon are displayed in the provided figure.
-The mean time for the top 100 males is closest to which value?
A) 148 minutes
B) 151 minutes
C) 140 minutes
D) 135 minutes
Unlock Deck
Unlock for access to all 127 flashcards in this deck.
Unlock Deck
k this deck
32
Use the following to answer the questions below:
The finishing time for the top 100 men in a marathon are displayed in the provided figure.
-The median time for the top 100 males is closest to which value?
A) 156 minutes
B) 140 minutes
C) 145 minutes
D) 151 minutes
The finishing time for the top 100 men in a marathon are displayed in the provided figure.
-The median time for the top 100 males is closest to which value?
A) 156 minutes
B) 140 minutes
C) 145 minutes
D) 151 minutes
Unlock Deck
Unlock for access to all 127 flashcards in this deck.
Unlock Deck
k this deck
33
Use the following to answer the questions below:
The midrange is another way to measure of the center of a distribution. The midrange of a dataset is defined to be the average of the minimum and maximum values in the dataset.
-Calculate the midrange of this dataset.
The midrange is another way to measure of the center of a distribution. The midrange of a dataset is defined to be the average of the minimum and maximum values in the dataset.
-Calculate the midrange of this dataset.
Unlock Deck
Unlock for access to all 127 flashcards in this deck.
Unlock Deck
k this deck
34
Use the following to answer the questions below:
The midrange is another way to measure of the center of a distribution. The midrange of a dataset is defined to be the average of the minimum and maximum values in the dataset.
-In general, would you think that the midrange should be a resistant statistic?
The midrange is another way to measure of the center of a distribution. The midrange of a dataset is defined to be the average of the minimum and maximum values in the dataset.
-In general, would you think that the midrange should be a resistant statistic?
Unlock Deck
Unlock for access to all 127 flashcards in this deck.
Unlock Deck
k this deck
35
Which statistic is more resistant to outliers (or extreme data values)?
A) Mean
B) Median
A) Mean
B) Median
Unlock Deck
Unlock for access to all 127 flashcards in this deck.
Unlock Deck
k this deck
36
Which statistic is more resistant to outliers (or extreme data values)?
A) Interquartile Range
B) Standard Deviation
A) Interquartile Range
B) Standard Deviation
Unlock Deck
Unlock for access to all 127 flashcards in this deck.
Unlock Deck
k this deck
37
Use the dataset to compute the following summary statistics in the questions below.
- Median
-
Median Unlock Deck
Unlock for access to all 127 flashcards in this deck.
Unlock Deck
k this deck
38
Use the dataset to compute the following summary statistics in the questions below.
- Mean (rounded to two decimal places)
-
Mean (rounded to two decimal places) Unlock Deck
Unlock for access to all 127 flashcards in this deck.
Unlock Deck
k this deck
39
Use the dataset to compute the following summary statistics in the questions below.
- Q1
-
Q1 Unlock Deck
Unlock for access to all 127 flashcards in this deck.
Unlock Deck
k this deck
40
Use the dataset to compute the following summary statistics in the questions below.
- Q3
-
Q3 Unlock Deck
Unlock for access to all 127 flashcards in this deck.
Unlock Deck
k this deck
41
Use the dataset to compute the following summary statistics in the questions below.
- IQR
-
IQR Unlock Deck
Unlock for access to all 127 flashcards in this deck.
Unlock Deck
k this deck
42
Use the dataset to compute the following summary statistics in the questions below.
- Range
-
Range Unlock Deck
Unlock for access to all 127 flashcards in this deck.
Unlock Deck
k this deck
43
Each of the variables displayed in the histograms below has a mean of 14.5, a range of 8, and 59 observations. Rank the three variables according to their standard deviations, from the smallest to the largest.
A) A, B, C
B) B, A, C
C) C, B, A
D) A, C, B
A) A, B, C
B) B, A, C
C) C, B, A
D) A, C, B
Unlock Deck
Unlock for access to all 127 flashcards in this deck.
Unlock Deck
k this deck
44
Use the following statement to answer the questions below.
-The distribution of waiting times at the student health center is bell-shaped with a mean of 13 minutes and a standard deviation of 2. Give an interval that is likely to contain about 95% of wait times.
A) 9 to 17 minutes
B) 11 to 15 minutes
C) 7 to 19 minutes
D) 9 to 13 minutes
-The distribution of waiting times at the student health center is bell-shaped with a mean of 13 minutes and a standard deviation of 2. Give an interval that is likely to contain about 95% of wait times.
A) 9 to 17 minutes
B) 11 to 15 minutes
C) 7 to 19 minutes
D) 9 to 13 minutes
Unlock Deck
Unlock for access to all 127 flashcards in this deck.
Unlock Deck
k this deck
45
Use the following statement to answer the questions below.
-The distribution of waiting times at the student health center is bell-shaped with a mean of 10 minutes and a standard deviation of 3. Find the z-score of someone who waits 5 minutes. Round your z-score to two decimal places. Be sure to specifically indicate if a wait time of 5 minutes is unusual.
A) -1.67; The wait time is not unusual.
B) 1.67; The wait time is unusual.
C) -1.67; The wait time is unusual.
D) 1.67; The wait time is not unusual.
Unlock Deck
Unlock for access to all 127 flashcards in this deck.
Unlock Deck
k this deck
46
Use the following to answer the questions below:
Scores on an exam (out of 100 points) given in a large introductory statistics course are displayed in the provided histogram.
-Which best describes the shape of the distribution of exam scores?
A) Approximately symmetric
B) Skewed to the left
C) Skewed to the right
Scores on an exam (out of 100 points) given in a large introductory statistics course are displayed in the provided histogram.
-Which best describes the shape of the distribution of exam scores?
A) Approximately symmetric
B) Skewed to the left
C) Skewed to the right
Unlock Deck
Unlock for access to all 127 flashcards in this deck.
Unlock Deck
k this deck
47
Use the following to answer the questions below:
Scores on an exam (out of 100 points) given in a large introductory statistics course are displayed in the provided histogram.
-Based on the histogram, which value is likely the mean exam score?
A) 82
B) 88
C) 76
D) 92
Scores on an exam (out of 100 points) given in a large introductory statistics course are displayed in the provided histogram.
-Based on the histogram, which value is likely the mean exam score?
A) 82
B) 88
C) 76
D) 92
Unlock Deck
Unlock for access to all 127 flashcards in this deck.
Unlock Deck
k this deck
48
Use the following to answer the questions below:
Scores on an exam (out of 100 points) given in a large introductory statistics course are displayed in the provided histogram.
-Based on the histogram of exam scores, which value is likely the median exam score?
A) 92
B) 88
C) 82
D) 72
Scores on an exam (out of 100 points) given in a large introductory statistics course are displayed in the provided histogram.
-Based on the histogram of exam scores, which value is likely the median exam score?
A) 92
B) 88
C) 82
D) 72
Unlock Deck
Unlock for access to all 127 flashcards in this deck.
Unlock Deck
k this deck
49
Use the following to answer the questions below:
Scores on an exam (out of 100 points) given in a large introductory statistics course are displayed in the provided histogram.
-Based on the histogram, the standard deviation of the exam scores is likely closest to which of these values?
A) 0.5
B) 10
C) 5
D) 1
Scores on an exam (out of 100 points) given in a large introductory statistics course are displayed in the provided histogram.
-Based on the histogram, the standard deviation of the exam scores is likely closest to which of these values?
A) 0.5
B) 10
C) 5
D) 1
Unlock Deck
Unlock for access to all 127 flashcards in this deck.
Unlock Deck
k this deck
50
Use the following to answer the questions below:
One of the symptoms of the flu is an elevated pulse rate. Pulse rates (in beats per minute) for patients with the flu are provided.
-Give the sample mean pulse rate. Use two decimal places in your answer.
A) 89.35 beats per minute
B) 90 beats per minute
C) 92.5 beats per minute
D) 89 beats per minute
Unlock Deck
Unlock for access to all 127 flashcards in this deck.
Unlock Deck
k this deck
51
Use the following to answer the questions below:
One of the symptoms of the flu is an elevated pulse rate. Pulse rates (in beats per minute) for patients with the flu are provided.
-Find the standard deviation of the pulse rates. Use two decimal places in your answer.
A) 7.85 beats per minute
B) 8.27 beats per minute
C) 7.33 beats per minute
D) 8.19 beats per minute
Unlock Deck
Unlock for access to all 127 flashcards in this deck.
Unlock Deck
k this deck
52
Use the following to answer the questions below:
One of the symptoms of the flu is an elevated pulse rate. Pulse rates (in beats per minute) for patients with the flu are provided.
-Give the five-number summary of these pulse rates.
One of the symptoms of the flu is an elevated pulse rate. Pulse rates (in beats per minute) for patients with the flu are provided.
-Give the five-number summary of these pulse rates.
Unlock Deck
Unlock for access to all 127 flashcards in this deck.
Unlock Deck
k this deck
53
Use the following to answer the questions below:
One of the symptoms of the flu is an elevated pulse rate. Pulse rates (in beats per minute) for patients with the flu are provided.
-Are there any outliers? If so, which data points? Clearly show your work to justify your answer.
One of the symptoms of the flu is an elevated pulse rate. Pulse rates (in beats per minute) for patients with the flu are provided.
-Are there any outliers? If so, which data points? Clearly show your work to justify your answer.
Unlock Deck
Unlock for access to all 127 flashcards in this deck.
Unlock Deck
k this deck
54
Use the following to answer the questions below:
Match the five-number summary to the appropriate boxplot.
- 15, 19, 20, 25, 28
Match the five-number summary to the appropriate boxplot.
- 15, 19, 20, 25, 28
Unlock Deck
Unlock for access to all 127 flashcards in this deck.
Unlock Deck
k this deck
55
Use the following to answer the questions below:
Match the five-number summary to the appropriate boxplot.
- 1, 3, 4, 6, 8
Match the five-number summary to the appropriate boxplot.
- 1, 3, 4, 6, 8
Unlock Deck
Unlock for access to all 127 flashcards in this deck.
Unlock Deck
k this deck
56
Use the following to answer the questions below:
Match the five-number summary to the appropriate boxplot.
- 3, 10, 12, 13, 19
Match the five-number summary to the appropriate boxplot.
- 3, 10, 12, 13, 19
Unlock Deck
Unlock for access to all 127 flashcards in this deck.
Unlock Deck
k this deck
57
Use the following to answer the questions below:
Match the five-number summary to the appropriate boxplot.
- 5, 8, 9, 11, 14
Match the five-number summary to the appropriate boxplot.
- 5, 8, 9, 11, 14
Unlock Deck
Unlock for access to all 127 flashcards in this deck.
Unlock Deck
k this deck
58
Use the following to answer the questions below:
The provided Minitab output displays descriptive statistics for the amount of financial aid, in thousands of dollars, awarded to a sample of students at a large university.
-How many students are included in the sample?
The provided Minitab output displays descriptive statistics for the amount of financial aid, in thousands of dollars, awarded to a sample of students at a large university.
-How many students are included in the sample?
Unlock Deck
Unlock for access to all 127 flashcards in this deck.
Unlock Deck
k this deck
59
Use the following to answer the questions below:
The provided Minitab output displays descriptive statistics for the amount of financial aid, in thousands of dollars, awarded to a sample of students at a large university.
-Based on the mean and median financial aid amounts displayed in the summary, which of the following most likely describes the shape of the distribution of financial aid amounts?
A) Slightly skewed to the left
B) Roughly symmetric
C) Slightly skewed to the right
Unlock Deck
Unlock for access to all 127 flashcards in this deck.
Unlock Deck
k this deck
60
Use the following to answer the questions below:
The provided Minitab output displays descriptive statistics for the amount of financial aid, in thousands of dollars, awarded to a sample of students at a large university.
-Based on the output, give an interval that is certain to contain the 15th percentile of the distribution of financial aid amounts.
Unlock Deck
Unlock for access to all 127 flashcards in this deck.
Unlock Deck
k this deck
61
Use the following to answer the questions below:
The provided Minitab output displays descriptive statistics for the amount of financial aid, in thousands of dollars, awarded to a sample of students at a large university.
-Based on the output, give an interval that is certain to contain the 60th percentile of the distribution of financial aid amounts.
Unlock Deck
Unlock for access to all 127 flashcards in this deck.
Unlock Deck
k this deck
62
Use the following to answer the questions below:
The provided Minitab output displays descriptive statistics for the amount of financial aid, in thousands of dollars, awarded to a sample of students at a large university.
-What is the range of financial aid amounts?
The provided Minitab output displays descriptive statistics for the amount of financial aid, in thousands of dollars, awarded to a sample of students at a large university.
-What is the range of financial aid amounts?
Unlock Deck
Unlock for access to all 127 flashcards in this deck.
Unlock Deck
k this deck
63
Use the following to answer the questions below:
The provided Minitab output displays descriptive statistics for the amount of financial aid, in thousands of dollars, awarded to a sample of students at a large university.
-What is the IQR of financial aid amounts?
The provided Minitab output displays descriptive statistics for the amount of financial aid, in thousands of dollars, awarded to a sample of students at a large university.
-What is the IQR of financial aid amounts?
Unlock Deck
Unlock for access to all 127 flashcards in this deck.
Unlock Deck
k this deck
64
Use the following to answer the questions below:
The provided Minitab output displays descriptive statistics for the amount of financial aid, in thousands of dollars, awarded to a sample of students at a large university.
-Is the largest financial aid amount an outlier?
The provided Minitab output displays descriptive statistics for the amount of financial aid, in thousands of dollars, awarded to a sample of students at a large university.
-Is the largest financial aid amount an outlier?
Unlock Deck
Unlock for access to all 127 flashcards in this deck.
Unlock Deck
k this deck
65
Use the following to answer the questions below:
The provided Minitab output displays descriptive statistics for the amount of financial aid, in thousands of dollars, awarded to a sample of students at a large university.
-Find and interpret the z-score for the smallest financial aid amount.
The provided Minitab output displays descriptive statistics for the amount of financial aid, in thousands of dollars, awarded to a sample of students at a large university.
-Find and interpret the z-score for the smallest financial aid amount.
Unlock Deck
Unlock for access to all 127 flashcards in this deck.
Unlock Deck
k this deck
66
Use the following to answer the questions below:
Students in an introductory statistics course were asked to count the number of scars on their dominant hand (the one they write with the most). The results are displayed in the provided boxplot.
-From the boxplot you can identify how many students are in the class.
Students in an introductory statistics course were asked to count the number of scars on their dominant hand (the one they write with the most). The results are displayed in the provided boxplot.
-From the boxplot you can identify how many students are in the class.
Unlock Deck
Unlock for access to all 127 flashcards in this deck.
Unlock Deck
k this deck
67
Use the following to answer the questions below:
Students in an introductory statistics course were asked to count the number of scars on their dominant hand (the one they write with the most). The results are displayed in the provided boxplot.
-Use the boxplot to estimate the median number of scars that students in the class have on their dominant hand.
Unlock Deck
Unlock for access to all 127 flashcards in this deck.
Unlock Deck
k this deck
68
Use the following to answer the questions below:
Students in an introductory statistics course were asked to count the number of scars on their dominant hand (the one they write with the most). The results are displayed in the provided boxplot.
-The distribution of the number of scars would be classified as
A) skewed to the left.
B) roughly symmetric.
C) skewed to the right.
Unlock Deck
Unlock for access to all 127 flashcards in this deck.
Unlock Deck
k this deck
69
Use the following to answer the questions below:
Students in an introductory statistics course were asked to count the number of scars on their dominant hand (the one they write with the most). The results are displayed in the provided boxplot.
-Calculate the IQR for the distribution of the number of scars students have.
Students in an introductory statistics course were asked to count the number of scars on their dominant hand (the one they write with the most). The results are displayed in the provided boxplot.
-Calculate the IQR for the distribution of the number of scars students have.
Unlock Deck
Unlock for access to all 127 flashcards in this deck.
Unlock Deck
k this deck
70
Use the following to answer the questions below:
Students in an introductory statistics course were asked to count the number of scars on their dominant hand (the one they write with the most). The results are displayed in the provided boxplot.
-Which answer best describes the following conclusion?
"There are no students with 7 scars on their dominant hand."
A) True
B) False
C) Cannot be determined
Unlock Deck
Unlock for access to all 127 flashcards in this deck.
Unlock Deck
k this deck
71
Use the following to answer the questions below:
Students in an introductory statistics course were asked to count the number of scars on their dominant hand (the one they write with the most). The results are displayed in the provided boxplot.
-Which answer best describes the following conclusion?
"There are no students with 2 scars on their dominant hand."
A) True
B) False
C) Cannot be determined
Unlock Deck
Unlock for access to all 127 flashcards in this deck.
Unlock Deck
k this deck
72
Use the following to answer the questions below:
Students in an introductory statistics course were asked to count the number of scars on their dominant hand (the one they write with the most). The results are displayed in the provided boxplot.
-The mean can be determined exactly from the boxplot.
Students in an introductory statistics course were asked to count the number of scars on their dominant hand (the one they write with the most). The results are displayed in the provided boxplot.
-The mean can be determined exactly from the boxplot.
Unlock Deck
Unlock for access to all 127 flashcards in this deck.
Unlock Deck
k this deck
73
Use the following to answer the questions below:
The side-by-side boxplots compare the top 100 men's and women's finishing times in a marathon.
-Which group tends to finish the race faster?
A) Men
B) Women
The side-by-side boxplots compare the top 100 men's and women's finishing times in a marathon.
-Which group tends to finish the race faster?
A) Men
B) Women
Unlock Deck
Unlock for access to all 127 flashcards in this deck.
Unlock Deck
k this deck
74
Use the following to answer the questions below:
The side-by-side boxplots compare the top 100 men's and women's finishing times in a marathon.
-Which group has the larger spread in its race times?
A) Men
B) Women
The side-by-side boxplots compare the top 100 men's and women's finishing times in a marathon.
-Which group has the larger spread in its race times?
A) Men
B) Women
Unlock Deck
Unlock for access to all 127 flashcards in this deck.
Unlock Deck
k this deck
75
Use the following to answer the questions below:
The side-by-side boxplots compare the top 100 men's and women's finishing times in a marathon.
-Does there appear to be an association between gender and race time?
The side-by-side boxplots compare the top 100 men's and women's finishing times in a marathon.
-Does there appear to be an association between gender and race time?
Unlock Deck
Unlock for access to all 127 flashcards in this deck.
Unlock Deck
k this deck
76
Use the following to answer the questions below:
The states located in the Midwestern region of the country typically experience a large number of tornados every year. The number of tornadoes from 2000-2011 for four Midwestern states (Kansas, Nebraska, South Dakota, and Iowa) are displayed in the side-by-side boxplots.
-Which state tends to see the most tornadoes per year?
A) Kansas
B) Nebraska
C) South Dakota
D) Iowa
Unlock Deck
Unlock for access to all 127 flashcards in this deck.
Unlock Deck
k this deck
77
Use the following to answer the questions below:
The states located in the Midwestern region of the country typically experience a large number of tornados every year. The number of tornadoes from 2000-2011 for four Midwestern states (Kansas, Nebraska, South Dakota, and Iowa) are displayed in the side-by-side boxplots.
-Which state has the largest range?
A) Kansas
B) Nebraska
C) South Dakota
D) Iowa
Unlock Deck
Unlock for access to all 127 flashcards in this deck.
Unlock Deck
k this deck
78
Use the following to answer the questions below:
The states located in the Midwestern region of the country typically experience a large number of tornados every year. The number of tornadoes from 2000-2011 for four Midwestern states (Kansas, Nebraska, South Dakota, and Iowa) are displayed in the side-by-side boxplots.
-Which state tends to see the fewest tornadoes per year?
A) Kansas
B) Nebraska
C) South Dakota
D) Iowa
Unlock Deck
Unlock for access to all 127 flashcards in this deck.
Unlock Deck
k this deck
79
Use the following to answer the questions below:
The states located in the Midwestern region of the country typically experience a large number of tornados every year. The number of tornadoes from 2000-2011 for four Midwestern states (Kansas, Nebraska, South Dakota, and Iowa) are displayed in the side-by-side boxplots.
-Which state has the largest IQR?
A) Kansas
B) Nebraska
C) South Dakota
D) Iowa
Unlock Deck
Unlock for access to all 127 flashcards in this deck.
Unlock Deck
k this deck
80
Use the following to answer the questions below:
The states located in the Midwestern region of the country typically experience a large number of tornados every year. The number of tornadoes from 2000-2011 for four Midwestern states (Kansas, Nebraska, South Dakota, and Iowa) are displayed in the side-by-side boxplots.
-Which state has an outlier?
A) Kansas
B) Nebraska
C) South Dakota
D) Iowa
Unlock Deck
Unlock for access to all 127 flashcards in this deck.
Unlock Deck
k this deck
Unlock Deck
Unlock for access to all 127 flashcards in this deck.


