Exam 2: Describing Data
Exam 1: Collecting Data68 Questions
Exam 2: Describing Data127 Questions
Exam 3: Confidence Intervals149 Questions
Exam 4: Hypothesis Tests117 Questions
Exam 5: Approximating With a Distribution74 Questions
Exam 6: Inference for Means and Proportions166 Questions
Exam 7: CHI-Square Tests for Categorical Variables45 Questions
Exam 8: Anova to Compare Means53 Questions
Exam 9: Inference for Regression123 Questions
Exam 10: Multiple Regression72 Questions
Select questions type
Use the following to answer the questions below:
Match the correlation to the corresponding scatterplot.
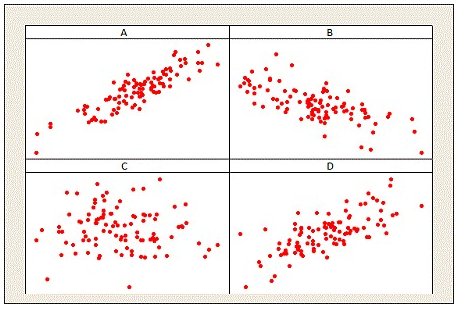 -________ 0.719
Free
(Short Answer)
4.8/5  (39)
(39)
Correct Answer: Verified
D
Use the following to answer the questions below:
February 12, 2009 marked the 200 th anniversary of Charles Darwin's birth. To celebrate, Gallup, a national polling organization, surveyed 1,018 Americans about their education level and their beliefs about the theory of evolution. The survey results are displayed in the provided two-way table.
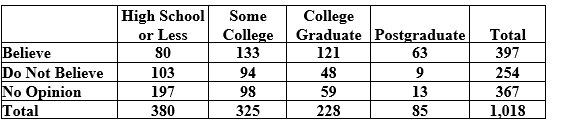 -What proportion of college graduates believe in the theory of evolution? Use four decimal places in your answer.
Free
(Short Answer)
4.8/5 (36)
Correct Answer:Verified
0.5307
If a distribution is roughly symmetric, which relationship between the mean and median is likely true?
Free
(Multiple Choice)
4.8/5 (46)
Correct Answer:Verified
B
Use the following to answer the questions below:
Students in an introductory statistics course were asked to count the number of scars on their dominant hand (the one they write with the most). The results are displayed in the provided boxplot.
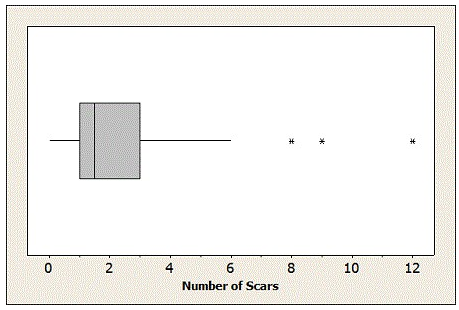 -The mean can be determined exactly from the boxplot.
(True/False)
4.9/5 (29)
Use the following to answer the questions below:
The side-by-side boxplots compare the top 100 men's and women's finishing times in a marathon.
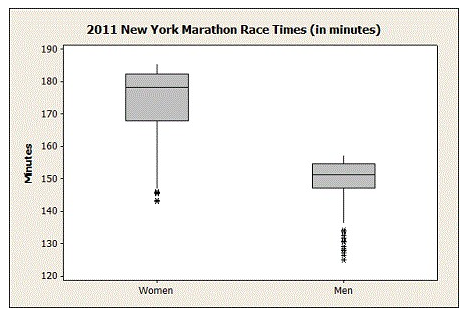 -Which group tends to finish the race faster?
(Multiple Choice)
4.8/5 (29)
Use the following to answer the questions below:
The finishing time for the top 100 men in a marathon are displayed in the provided figure.
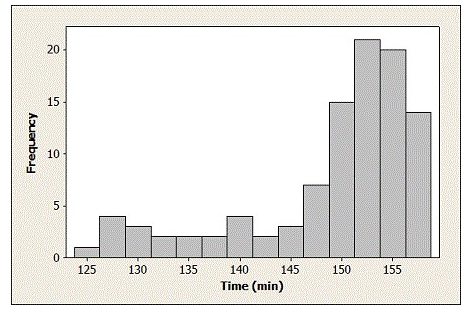 -Which of the following best describes the distribution of times for the top 100 male finishers in the marathon?
(Multiple Choice)
4.8/5 (44)
Use the following to answer the questions below:
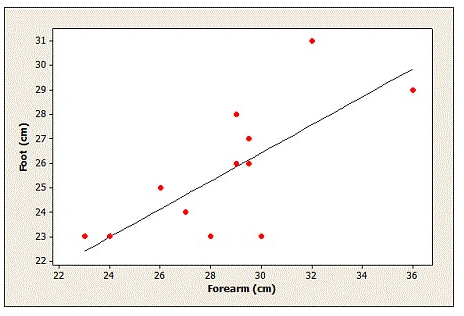
Students in a small statistics course collected data to determine if the length of the forearm could be used to predict the length of the foot (both measured in centimeters). Their data are displayed in the provided table.
 -Find the least squares regression equation for predicting foot length from forearm length.
(Multiple Choice)
4.8/5 (40)
If a distribution is heavily skewed to the right, which relationship between the mean and median is likely true?
(Multiple Choice)
4.9/5 (39)
Use the statement to answer the following questions below.
-A Fun-Size bag of M&M's contains 5 green, 4 red, 4 yellow, 3 orange, 4 blue, and 4 brown candies.
What proportion of the candies are yellow or orange? Use four decimal places in your answer.
(Short Answer)
4.9/5 (37)
Use the following to answer the questions below:
The states located in the Midwestern region of the country typically experience a large number of tornados every year. The number of tornadoes from 2000-2011 for four Midwestern states (Kansas, Nebraska, South Dakota, and Iowa) are displayed in the side-by-side boxplots.
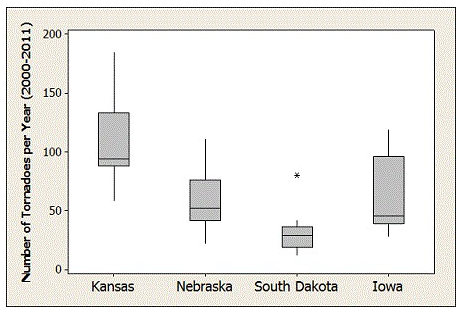 -Which state tends to see the most tornadoes per year?
(Multiple Choice)
4.9/5 (31)
Use the following to answer the questions below:
One of the symptoms of the flu is an elevated pulse rate. Pulse rates (in beats per minute) for patients with the flu are provided.
 -Are there any outliers? If so, which data points? Clearly show your work to justify your answer.
(Essay)
4.8/5 (35)
Use the following to answer the questions below:
Students in a small statistics course collected data to determine if the length of the forearm could be used to predict the length of the foot (both measured in centimeters). Their data are displayed in the provided table.
-Based on their goal (to predict foot length from forearm length), which variable is the explanatory variable?
(Multiple Choice)
4.8/5 (31)
Use the following to answer the questions below:
In a survey conducted by the Gallup organization September 6-9, 2012, 1,017 adults were asked, "In general, how much trust and confidence do you have in the mass media-such as newspapers, TV, and radio-when it comes to reporting the news fully, accurately, and fairly?" 81 said that they had a "great deal" of confidence, 325 said they had a "fair amount" of confidence, 397 said they had "not very much" confidence, and 214 said they had "no confidence at all."
-In the article, they discuss the association between political party and opinion about the media ("positive" = great deal/fair amount of confidence and "negative" = not very much confidence/none at all). The results, as percentages, are displayed in the side-by-side bar charts. Describe the association between political party and opinion about the media. Use the bar chart to estimate the proportion of individuals with positive opinions about the media for each political party.
? 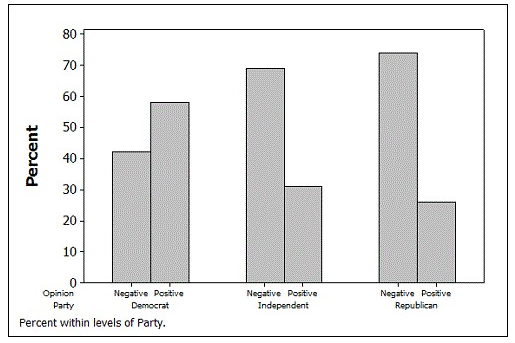
(Essay)
4.8/5 (28)
Use the following to answer the questions below:
Identify which graphical display might be appropriate in each case. Select all that apply.
-Investigate the number of text messages sent yesterday by students in your class.
(Multiple Choice)
4.9/5 (30)
Use the following to answer the questions below:
The finishing time for the top 100 men in a marathon are displayed in the provided figure.
-The median time for the top 100 males is closest to which value?
(Multiple Choice)
4.9/5 (26)
Use the following to answer the questions below:
The provided Minitab output displays descriptive statistics for the amount of financial aid, in thousands of dollars, awarded to a sample of students at a large university.
 -What is the range of financial aid amounts?
(Short Answer)
4.9/5 (29)
Use the following to answer the questions below:
The provided Minitab output displays descriptive statistics for the amount of financial aid, in thousands of dollars, awarded to a sample of students at a large university.
-What is the IQR of financial aid amounts?
(Short Answer)
4.9/5 (27)
Use the following to answer the questions below:
The finishing time for the top 100 men in a marathon are displayed in the provided figure.
-The mean time for the top 100 males is closest to which value?
(Multiple Choice)
4.8/5 (43)
Use the following to answer the questions below:
Students in a small statistics course collected data to determine if the length of the forearm could be used to predict the length of the foot (both measured in centimeters). Their data are displayed in the provided table.
-A scatterplot of the data with the least squares regression line is shown. What are the coordinates of the point with the most extreme positive residual?
(Multiple Choice)
4.9/5 (29)
Use the following to answer the questions below:
A student working an independent research project wants to investigate if there is an association between the amount of sleep someone gets and their body mass index (BMI) - an indicator of body fatness. For a sample of 45 students, she records their BMI and the average amount of sleep they get on weeknights over a two-week period.
-Suppose the student found a correlation of -0.413 between amount of sleep and BMI. Would it be appropriate for her to conclude that getting more sleep causes individuals to have a lower BMI?
(True/False)
4.8/5 (34)
Filters
- Essay(0)
- Multiple Choice(0)
- Short Answer(0)
- True False(0)
- Matching(0)