Deck 4: Exponential Functions
Full screen (f)
Question
Question
Question
Question
Question
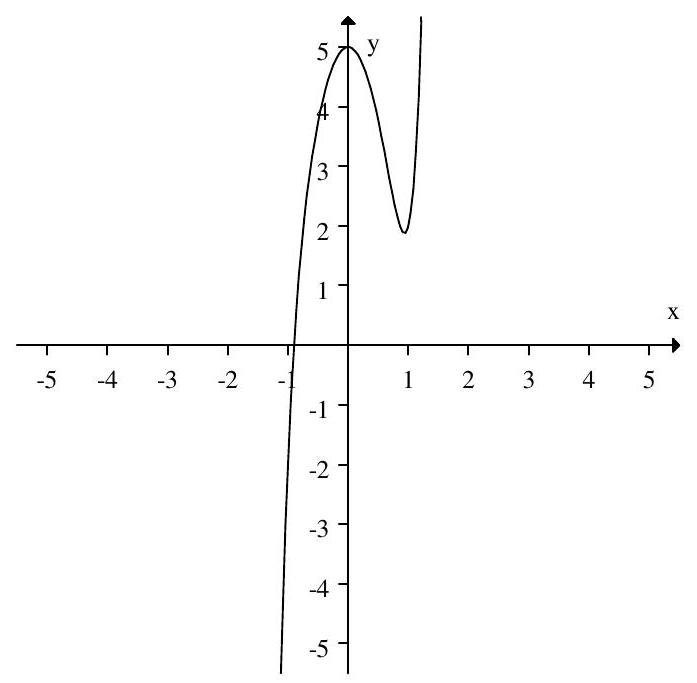
Which of the graphs in the following figure is the graph of ?
Question
Question
Question
Question
Question
Question
Question
Question
Question
Question
Question
Question
Question
Question
Question
Match the graph to its equation.
A)
B)
C)
D)
A)
B)
C)
D)
Question
Match the graph to its equation.
A)
B)
C)
D)
A)
B)
C)
D)
Question
Match the graph to its equation.
A)
B)
C)
D)
A)
B)
C)
D)
Question
Question
Question
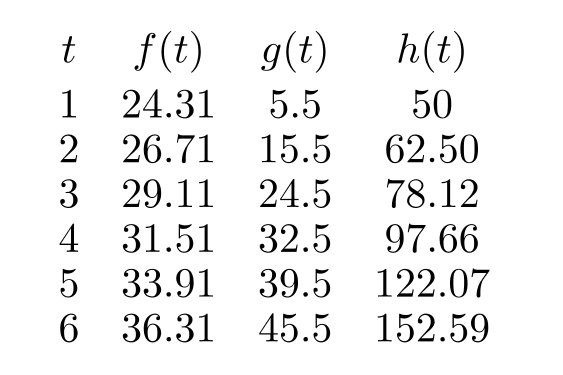
The following table gives values from an exponential or a linear function. Determine which, and find values for and so that if the function is linear, or if the function is exponential.
a= ---------------,b= ------------
a= ---------------,b= ------------
Question
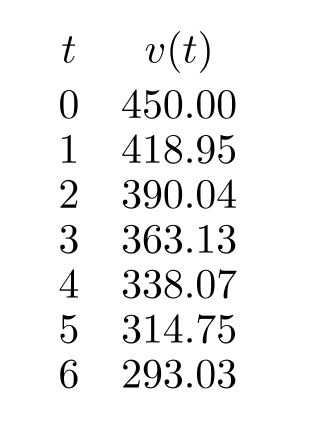
The table below shows , the dollar value of a share of a certain stock, as a function of , the time (in weeks) since the initial offering of the stock. A possible formula for is . Round the second answer to 3 decimal places.
Question
Question
Question
The graph below shows the quantity of a drug in a patient's bloodstream over a period of time , in minutes.
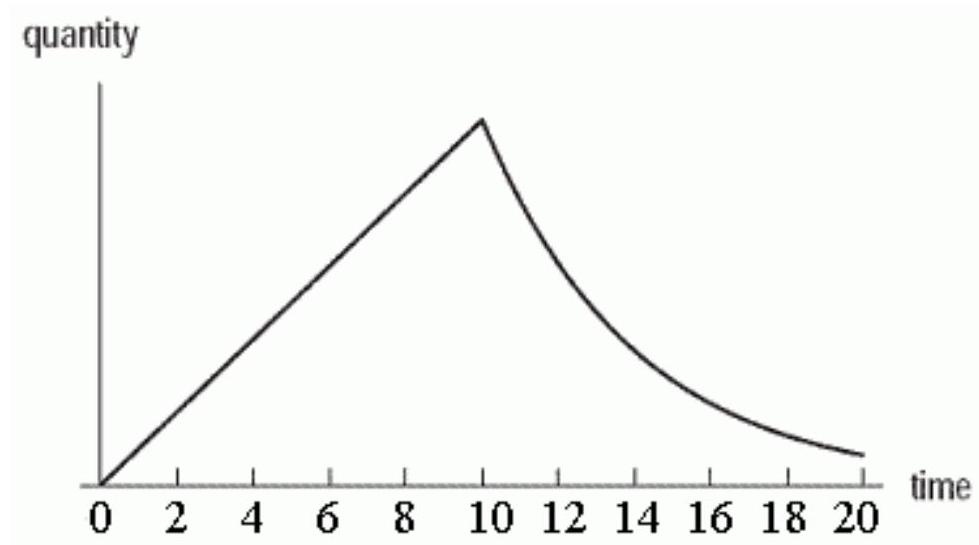
Which of the following scenarios best describes the graph?
A) The drug is injected over a 10 minute interval, during which the quantity increases linearly. After the 10 minutes, the injection is discontinued and the quantity then decays exponentially.
B) The drug is injected over a 10 minute interval, during which the quantity increases exponentially. After the 10 minutes, the injection is discontinued and the quantity then decays linearly.
C) The drug is injected all at once. The quantity first increases and then decreases linearly.
D) The drug is injected all at once. The quantity first increases and then decreases exponentially.
Question
Question
Question
Question
Question
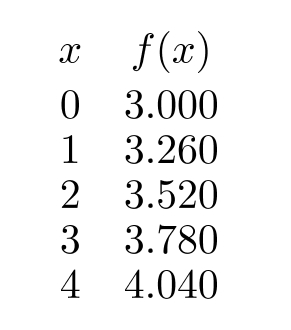
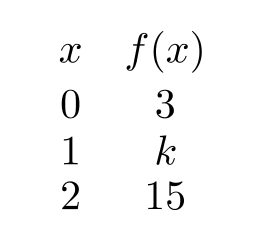
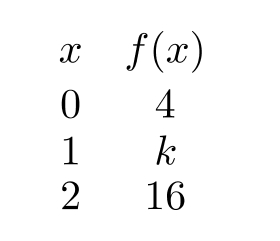
Let be given in the table below. Find the value of if is linear.
Question
Let be given in the table below. Find the value of if is exponential.
Question
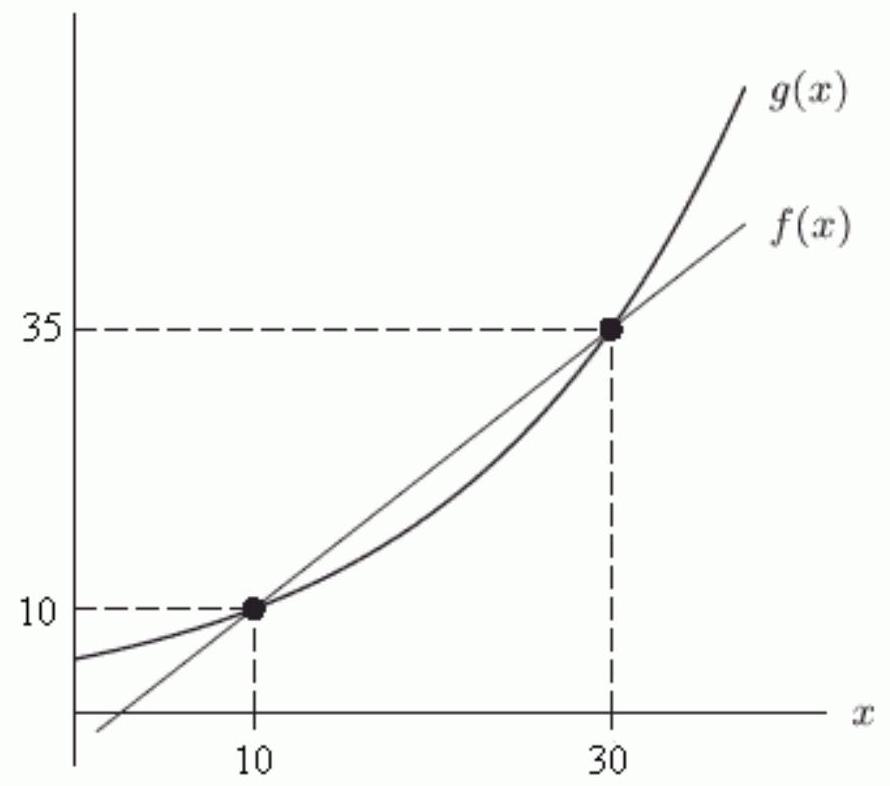
The following figure shows two functions, one linear and the other exponential. The formula for the linear one is f(x) =-----------+------------x, and the formula for the exponential one is . Round the first two answers to 2 decimal places and the last two answers to 3 decimal places.
Question
Each of the functions in the table below is increasing, but each increases in a different way. One is linear, one is exponential, and one is neither.
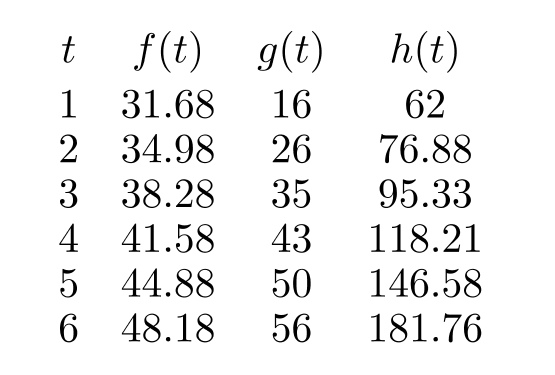
Which one is exponential: , or ?
Which one is exponential: , or ?
Question
Each of the functions in the table below is increasing, but each increases in a different way. One is linear, one is exponential, and one is neither.
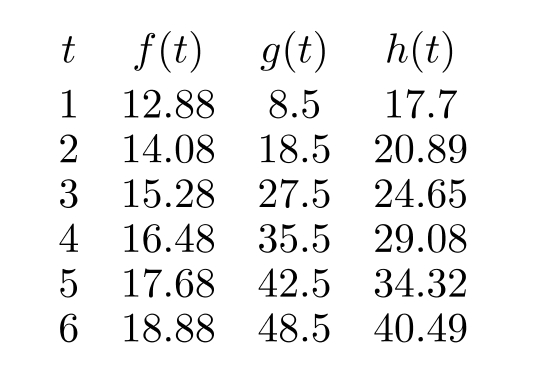
The following three graphs correspond with the functions in the table. Which is the graph of ?
A)

B)

C)
The following three graphs correspond with the functions in the table. Which is the graph of ?
A)
B)
C)
Question
Each of the functions in the table below is increasing, but each increases in a different way. One is linear, one is exponential, and one is neither.
The formula for the exponential one is Round your second answer to 2 decimal places.
The formula for the exponential one is Round your second answer to 2 decimal places.
Question
Question
Question
Question
Question
Question
Question
Question
The graph of the exponential function is shown below. The formula for
Question
The graph of the exponential function is shown below. Suppose represents a city's population, in thousands, years after 1995. Which of the following quantities are equivalent?
A)
B) Approximately -125 thousand
C) Approximately 387 thousand
D) The change in the city's population between 1999 and 2002
E)
F) The rate at which the population is declining between 1999 and 2002
A)
B) Approximately -125 thousand
C) Approximately 387 thousand
D) The change in the city's population between 1999 and 2002
E)
F) The rate at which the population is declining between 1999 and 2002
Question
Question
Question
Question
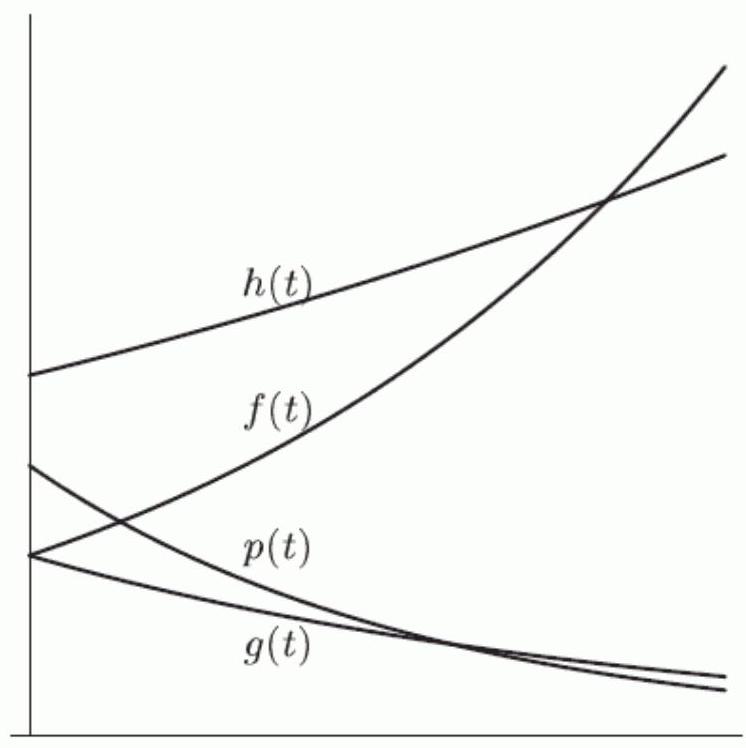
In the following figure, the functions , and can all be written in the form . Which one has the largest value for ?
Question
Question
Question
Question
Question
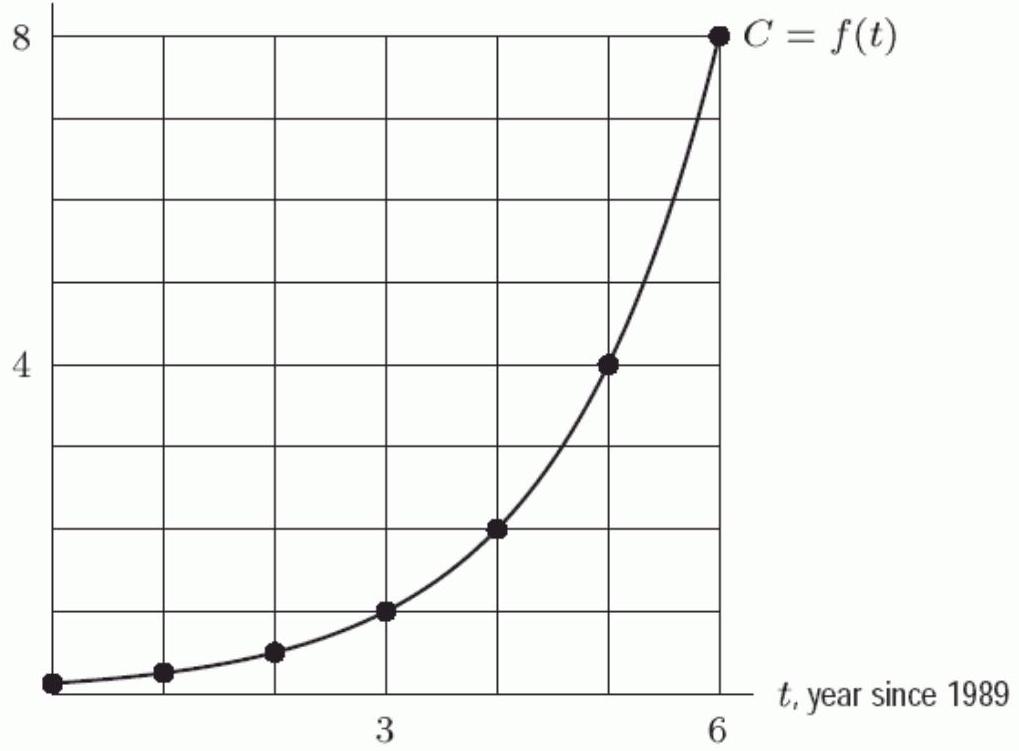
The following figure gives the graph of , where is the computer hard disk capacity (in hundreds of megabytes) that could be bought for years past 1989 . If the trend displayed in the graph continued, how many megabytes would a hard drive have in 1997? Round to the nearest hundred.
, capacity (in 100 s of megabytes)
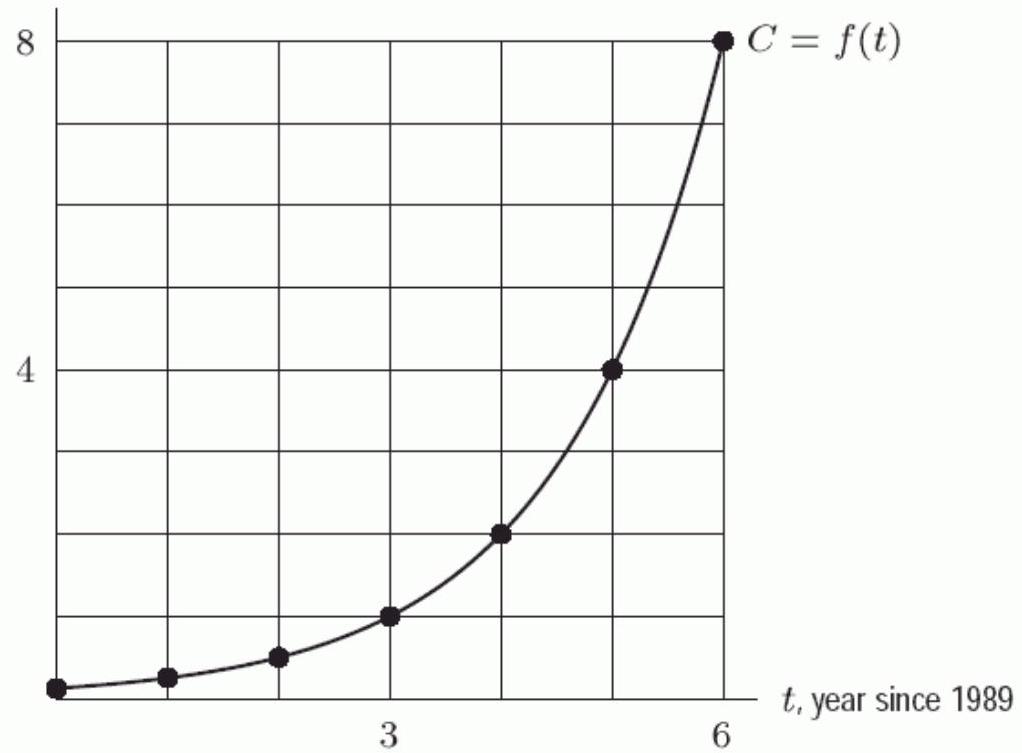
, capacity (in 100 s of megabytes)
Question
The following figure gives the graph of , where is the computer hard disk capacity (in hundreds of megabytes) that could be bought for years past 1989 . If the trend displayed in the graph continued, in what year would the capacity that can be bought for be 4,600 ?
Question
Question
Question
Question
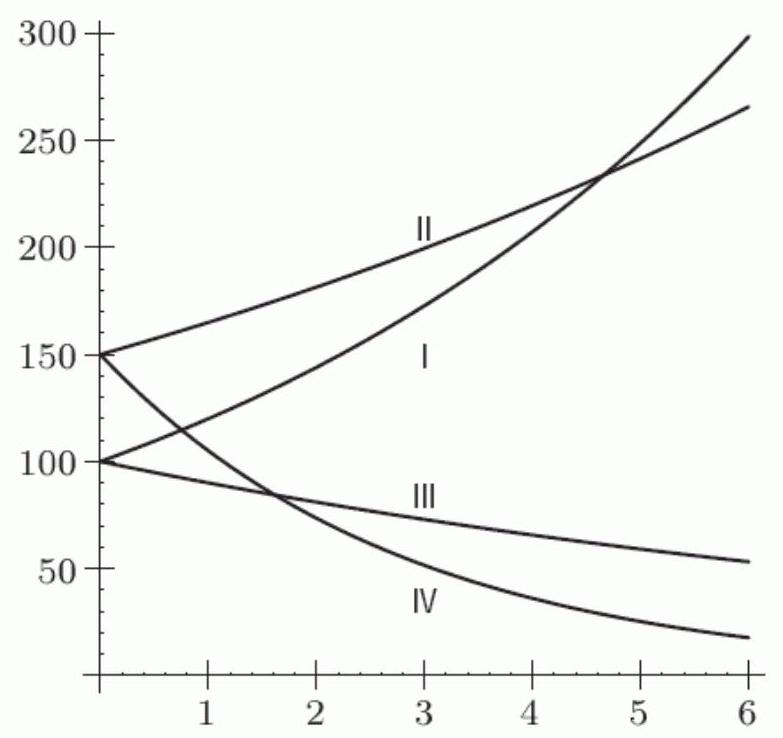
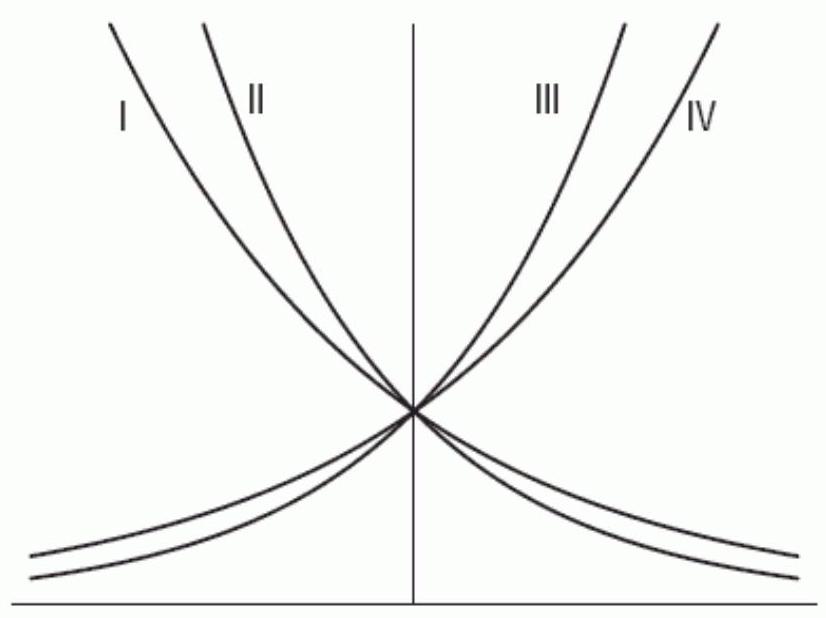
Consider the following figure, where Graph I has equation , Graph II has equation , Graph III has equation , and Graph IV has equation .
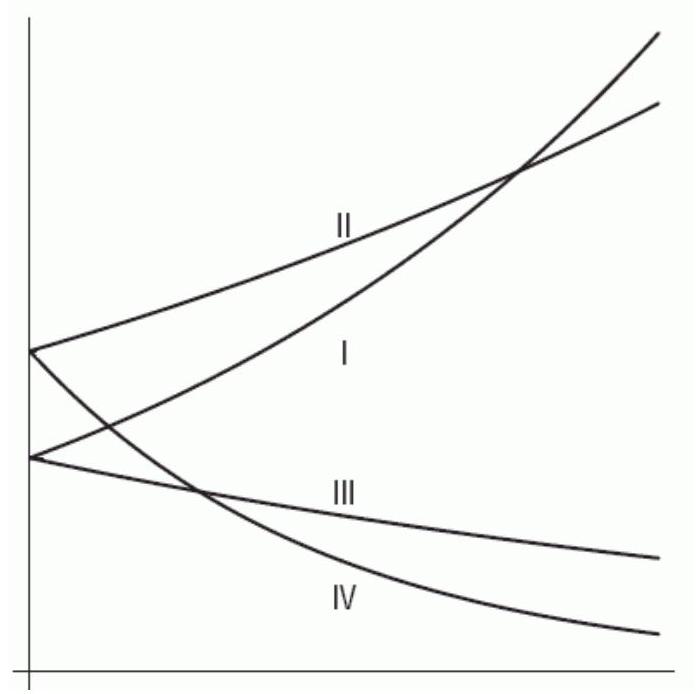
Is positive or negative?
Is positive or negative?
Question
Question
Question
Assume that all important features are shown in the following graph of .
What is ? For or , enter "inf" or "-inf".
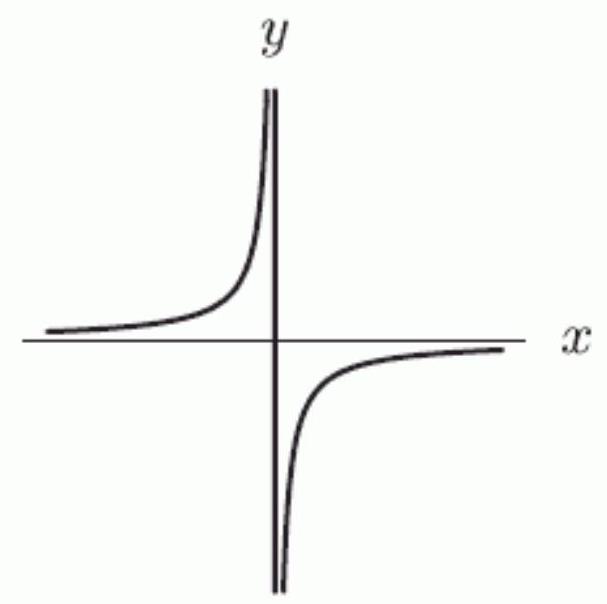
What is ? For or , enter "inf" or "-inf".
Question
Question
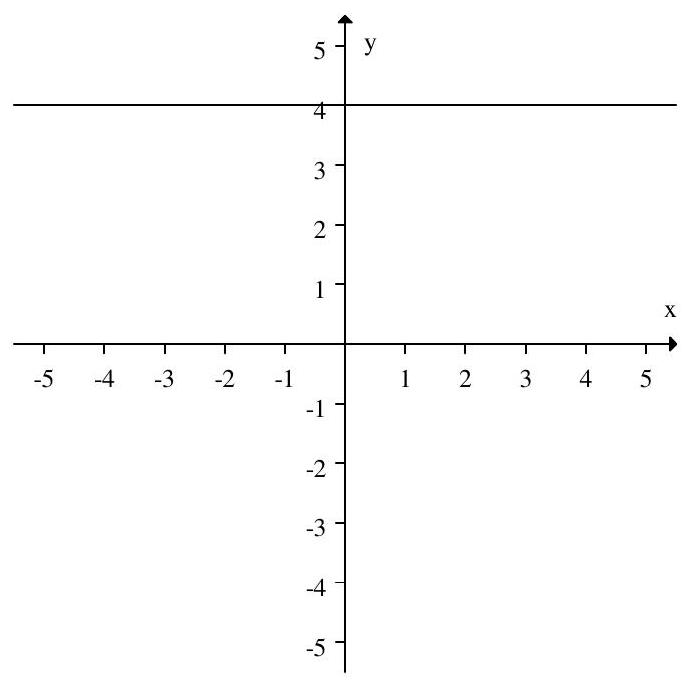
Is the function graphed exponential?
Question
Is the function graphed exponential?
Question
Question
Question
Question
Question
Question
Question
Question
Question
Question
Question
The figure below shows the graphs of the following functions:
(A)
(B)
(C)
(D)
Which one is the graph of A?
(A)
(B)
(C)
(D)
Which one is the graph of A?
Question

Unlock Deck
Sign up to unlock the cards in this deck!
Unlock Deck
Unlock Deck
1/94
Play
Full screen (f)
Deck 4: Exponential Functions
1
In the exponential formula , if then .
-10
2
In 2006, the cost of a particular piece of computer equipment was and going down at a rate of per year. Assuming this percentage remains constant, what is the formula for , the cost of this equipment in dollars, as a function of , the number of years since 2006 ?
A)
B)
C)
D)
A)
B)
C)
D)
3
If you start with , how much money will you have after a increase?
4
If you start with , how much money will you have after a increase followed by a decrease?
Unlock Deck
Unlock for access to all 94 flashcards in this deck.
Unlock Deck
k this deck
5
Which of the graphs in the following figure is the graph of ?
Unlock Deck
Unlock for access to all 94 flashcards in this deck.
Unlock Deck
k this deck
6
What is the growth factor if sales increase by each month?
Unlock Deck
Unlock for access to all 94 flashcards in this deck.
Unlock Deck
k this deck
7
The populations of 4 species of animals are given by the following equations:
Which species are shrinking in size?
A)
B)
C)
D)
Which species are shrinking in size?
A)
B)
C)
D)
Unlock Deck
Unlock for access to all 94 flashcards in this deck.
Unlock Deck
k this deck
8
The populations of 4 species of animals are given by the following equations:
What is the annual percent growth rate for the population that is growing the fastest?
What is the annual percent growth rate for the population that is growing the fastest?
Unlock Deck
Unlock for access to all 94 flashcards in this deck.
Unlock Deck
k this deck
9
The populations of 4 species of animals are given by the following equations:
What is the largest initial population of the 4 species?
What is the largest initial population of the 4 species?
Unlock Deck
Unlock for access to all 94 flashcards in this deck.
Unlock Deck
k this deck
10
The US population in 2005 was approximately 296.4 million. Assume the population increases at a rate of per year. How many million people would you expect to live in the United States in the year 2020? Round to 1 decimal place.
Unlock Deck
Unlock for access to all 94 flashcards in this deck.
Unlock Deck
k this deck
11
A quantity decreased from 100 to 95 . By what percentage did it decrease?
Unlock Deck
Unlock for access to all 94 flashcards in this deck.
Unlock Deck
k this deck
12
A store's sales of cassette tapes of music decreased by per year over a period of 5 years. By what total percent did sales of cassette tapes decrease over this time period? Round to 1 decimal place.
Unlock Deck
Unlock for access to all 94 flashcards in this deck.
Unlock Deck
k this deck
13
The population of a city has been growing at a rate of per year. If the population was 100,000 in 1990, what was the population in 1995? Round to the nearest whole number.
Unlock Deck
Unlock for access to all 94 flashcards in this deck.
Unlock Deck
k this deck
14
In some developing countries, the inflation rate has been as high as per day. What is the corresponding percent annual inflation rate? Round to the nearest whole number.
Unlock Deck
Unlock for access to all 94 flashcards in this deck.
Unlock Deck
k this deck
15
The price of an item increases due to inflation. Let be the price of the item as a function of time in years, with in 2004. What is the weekly inflation rate? Round to 2 decimal places.
Unlock Deck
Unlock for access to all 94 flashcards in this deck.
Unlock Deck
k this deck
16
The price of an item increases due to inflation. Let give the price of the item as a function of time in years, with in 2004. What is the practical interpretation of ?
A) The price in 2004 of an item that is now.
B) The price now of an item that was $70 in 2004.
C) The time at which the price reaches .
D) The price of the item after 70 years.
A) The price in 2004 of an item that is now.
B) The price now of an item that was $70 in 2004.
C) The time at which the price reaches .
D) The price of the item after 70 years.
Unlock Deck
Unlock for access to all 94 flashcards in this deck.
Unlock Deck
k this deck
17
The amount of pollution in a harbor hours after it was contaminated by illegal dumping is given by tons. What percentage of the pollution leaves the harbor each hour?
Unlock Deck
Unlock for access to all 94 flashcards in this deck.
Unlock Deck
k this deck
18
A radioactive substance decays by every year. Which of the following is the formula for the quantity, , of a 10 gram sample remaining after years?
A)
B)
C)
D)
A)
B)
C)
D)
Unlock Deck
Unlock for access to all 94 flashcards in this deck.
Unlock Deck
k this deck
19
Which equation has a rate of change of ?
A)
B)
C)
D)
A)
B)
C)
D)
Unlock Deck
Unlock for access to all 94 flashcards in this deck.
Unlock Deck
k this deck
20
Match the graph to its equation.
A)
B)
C)
D)
A)
B)
C)
D)
Unlock Deck
Unlock for access to all 94 flashcards in this deck.
Unlock Deck
k this deck
21
Match the graph to its equation.
A)
B)
C)
D)
A)
B)
C)
D)
Unlock Deck
Unlock for access to all 94 flashcards in this deck.
Unlock Deck
k this deck
22
Match the graph to its equation.
A)
B)
C)
D)
A)
B)
C)
D)
Unlock Deck
Unlock for access to all 94 flashcards in this deck.
Unlock Deck
k this deck
23
Which of the following formulas are exponential?
A)
B)
C)
D)
E)
F)
G)
A)
B)
C)
D)
E)
F)
G)
Unlock Deck
Unlock for access to all 94 flashcards in this deck.
Unlock Deck
k this deck
24
The average life expectancy in a country tends to increase by the same percentage each year. Should a linear or an exponential function be used to model this scenario?
Unlock Deck
Unlock for access to all 94 flashcards in this deck.
Unlock Deck
k this deck
25
The following table gives values from an exponential or a linear function. Determine which, and find values for and so that if the function is linear, or if the function is exponential.
a= ---------------,b= ------------
a= ---------------,b= ------------
Unlock Deck
Unlock for access to all 94 flashcards in this deck.
Unlock Deck
k this deck
26
The table below shows , the dollar value of a share of a certain stock, as a function of , the time (in weeks) since the initial offering of the stock. A possible formula for is . Round the second answer to 3 decimal places.
Unlock Deck
Unlock for access to all 94 flashcards in this deck.
Unlock Deck
k this deck
27
A population has size 3,500 at time , with in years. If the population grows by 80 people per year, what is the formula for , the population at time ?
A)
B)
C)
D)
A)
B)
C)
D)
Unlock Deck
Unlock for access to all 94 flashcards in this deck.
Unlock Deck
k this deck
28
A population has size 3,000 at time , with in years. If the population grows by per year, what is the formula for , the population at time ?
A)
B)
C)
D)
A)
B)
C)
D)
Unlock Deck
Unlock for access to all 94 flashcards in this deck.
Unlock Deck
k this deck
29
The graph below shows the quantity of a drug in a patient's bloodstream over a period of time , in minutes.
Which of the following scenarios best describes the graph?
A) The drug is injected over a 10 minute interval, during which the quantity increases linearly. After the 10 minutes, the injection is discontinued and the quantity then decays exponentially.
B) The drug is injected over a 10 minute interval, during which the quantity increases exponentially. After the 10 minutes, the injection is discontinued and the quantity then decays linearly.
C) The drug is injected all at once. The quantity first increases and then decreases linearly.
D) The drug is injected all at once. The quantity first increases and then decreases exponentially.
Unlock Deck
Unlock for access to all 94 flashcards in this deck.
Unlock Deck
k this deck
30
Kevin buys a new CD player for , and finds two years later when he wants to sell it that it is only worth . Assuming the value of the CD player decreases exponentially, the formula for , the value of the CD player after years, is given by . Round your second answer to 2 decimal places.
Unlock Deck
Unlock for access to all 94 flashcards in this deck.
Unlock Deck
k this deck
31
A biologist measures the amount of contaminant in a lake 2 hours after a chemical spill and again 15 hours after the spill. She sets up a possible model to determine , the amount of the chemical remaining in the lake as a function of , the time in hours since the spill. The model assumes the contaminant is leaving the lake at a constant rate, which she determines to be 6 tons\hour. She estimates that the lake will be free from the contaminant 35 hours after the spill. How many tons of the contaminant were in the lake at the 15 hour reading?
Unlock Deck
Unlock for access to all 94 flashcards in this deck.
Unlock Deck
k this deck
32
A biologist measures the amount of contaminant in a lake 2 hours after a chemical spill and again 11 hours after the spill. She sets up two possible models to determine , the amount of the chemical remaining in the lake as a function of , the time in hours since the spill. The first model assumes the contaminant is leaving the lake at a constant rate, which she determines to be 3 tons\hour. Using this model, she estimates that the lake will be free from the contaminant 20 hours after the spill. Thus, Q(2)= ---------- and Q(11)= ----------- The second model assumes that the amount of contaminant decreases exponentially. In this model, she finds that . Round both answers to 3 decimal places.
Unlock Deck
Unlock for access to all 94 flashcards in this deck.
Unlock Deck
k this deck
33
A biologist measures the amount of contaminant in a lake 3 hours after a chemical spill and again 11 hours after the spill. She sets up two possible models to determine , the amount of the chemical remaining in the lake as a function of , the time in hours since the spill. The first model assumes the contaminant is leaving the lake at a constant rate, which she determines to be 7 tons\hour. Using this model, she estimates that the lake will be free from the contaminant 24 hours after the spill. The second model assumes that the amount of contaminant decreases exponentially. She measures the spill a third time after 23 hours and finds that 44 tons remain. Which model seems best?
A) The linear one
B) The exponential one
A) The linear one
B) The exponential one
Unlock Deck
Unlock for access to all 94 flashcards in this deck.
Unlock Deck
k this deck
34
Let be given in the table below. Find the value of if is linear.
Unlock Deck
Unlock for access to all 94 flashcards in this deck.
Unlock Deck
k this deck
35
Let be given in the table below. Find the value of if is exponential.
Unlock Deck
Unlock for access to all 94 flashcards in this deck.
Unlock Deck
k this deck
36
The following figure shows two functions, one linear and the other exponential. The formula for the linear one is f(x) =-----------+------------x, and the formula for the exponential one is . Round the first two answers to 2 decimal places and the last two answers to 3 decimal places.
Unlock Deck
Unlock for access to all 94 flashcards in this deck.
Unlock Deck
k this deck
37
Each of the functions in the table below is increasing, but each increases in a different way. One is linear, one is exponential, and one is neither.
Which one is exponential: , or ?
Which one is exponential: , or ?
Unlock Deck
Unlock for access to all 94 flashcards in this deck.
Unlock Deck
k this deck
38
Each of the functions in the table below is increasing, but each increases in a different way. One is linear, one is exponential, and one is neither.
The following three graphs correspond with the functions in the table. Which is the graph of ?
A)
B)
C)
The following three graphs correspond with the functions in the table. Which is the graph of ?
A)
B)
C)
Unlock Deck
Unlock for access to all 94 flashcards in this deck.
Unlock Deck
k this deck
39
Each of the functions in the table below is increasing, but each increases in a different way. One is linear, one is exponential, and one is neither.
The formula for the exponential one is Round your second answer to 2 decimal places.
The formula for the exponential one is Round your second answer to 2 decimal places.
Unlock Deck
Unlock for access to all 94 flashcards in this deck.
Unlock Deck
k this deck
40
The population of a city is increasing exponentially. In 2000 , the city had a population of 40,000 . In 2005 , the population was 58,502. The formula for , the population of the town years after 2000 , is given by .Round your second answer to 3 decimal places.
Unlock Deck
Unlock for access to all 94 flashcards in this deck.
Unlock Deck
k this deck
41
The formula for the exponential function such that and is given by . Give both answers to 3 decimal places.
Unlock Deck
Unlock for access to all 94 flashcards in this deck.
Unlock Deck
k this deck
42
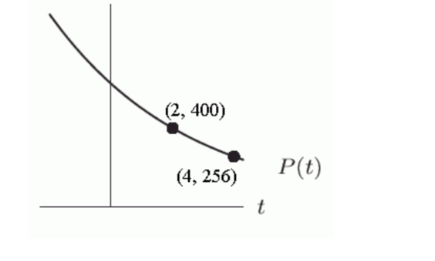
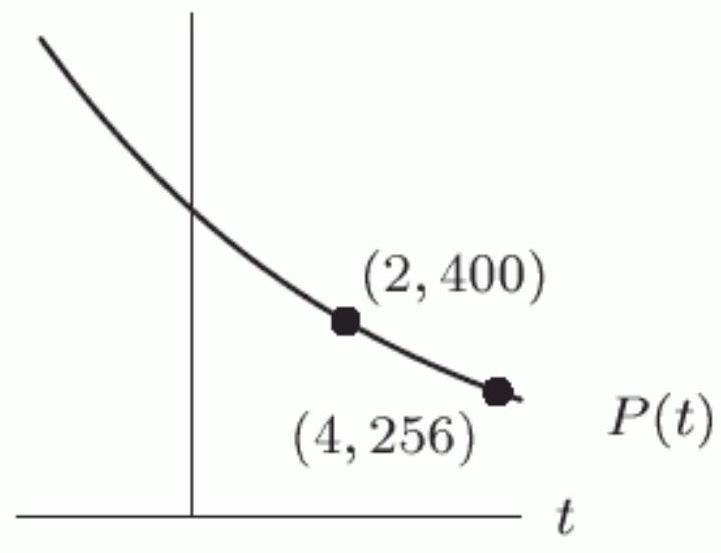
Find a possible formula for the exponential function such that the points and are on the graph.
Unlock Deck
Unlock for access to all 94 flashcards in this deck.
Unlock Deck
k this deck
43
Write the formula for the price of a gallon of gas in days if the price is on day and the price increases by per day.
Unlock Deck
Unlock for access to all 94 flashcards in this deck.
Unlock Deck
k this deck
44
Write the formula for the price of a gallon of gas in days if the price is on day and the price increases by per day.
Unlock Deck
Unlock for access to all 94 flashcards in this deck.
Unlock Deck
k this deck
45
One solution to the equation is . Use your calculator to estimate the other solution to 2 decimal places.
Unlock Deck
Unlock for access to all 94 flashcards in this deck.
Unlock Deck
k this deck
46
What is the maximum number of solutions the equation can have?
Unlock Deck
Unlock for access to all 94 flashcards in this deck.
Unlock Deck
k this deck
47
The graph of the exponential function is shown below. The formula for
Unlock Deck
Unlock for access to all 94 flashcards in this deck.
Unlock Deck
k this deck
48
The graph of the exponential function is shown below. Suppose represents a city's population, in thousands, years after 1995. Which of the following quantities are equivalent?
A)
B) Approximately -125 thousand
C) Approximately 387 thousand
D) The change in the city's population between 1999 and 2002
E)
F) The rate at which the population is declining between 1999 and 2002
A)
B) Approximately -125 thousand
C) Approximately 387 thousand
D) The change in the city's population between 1999 and 2002
E)
F) The rate at which the population is declining between 1999 and 2002
Unlock Deck
Unlock for access to all 94 flashcards in this deck.
Unlock Deck
k this deck
49
The US population in 2005 was approximately 296.4 million. Assume the population increases at a rate of per year. Some demographers believe that the ideal population of the United States is about 130 million. According to this model, in what year did this occur?
Unlock Deck
Unlock for access to all 94 flashcards in this deck.
Unlock Deck
k this deck
50
Find . For or , enter "inf" or "-inf".
Unlock Deck
Unlock for access to all 94 flashcards in this deck.
Unlock Deck
k this deck
51
Find . For or , enter "inf" or "-inf".
Unlock Deck
Unlock for access to all 94 flashcards in this deck.
Unlock Deck
k this deck
52
In the following figure, the functions , and can all be written in the form . Which one has the largest value for ?
Unlock Deck
Unlock for access to all 94 flashcards in this deck.
Unlock Deck
k this deck
53
Solve graphically for if . Round to 2 decimal places.
Unlock Deck
Unlock for access to all 94 flashcards in this deck.
Unlock Deck
k this deck
54
The price of an item increases due to inflation. Let give the price of the item as a function of time in years, with in 2004 . Estimate to 2 decimal places.
Unlock Deck
Unlock for access to all 94 flashcards in this deck.
Unlock Deck
k this deck
55
Suppose the amount of ozone in the atmosphere is decreasing exponentially at a continuous rate of per year. How many years will it take before one-third of the ozone has disappeared? Round to the nearest year.
Unlock Deck
Unlock for access to all 94 flashcards in this deck.
Unlock Deck
k this deck
56
The population of a city is increasing exponentially. In 2000 , the city had a population of 70,000. In 2003, the population was 89,870 . Let be the population of the town years after 2000 . Use a graph of to estimate the year in which the population will reach 250,000 .
Unlock Deck
Unlock for access to all 94 flashcards in this deck.
Unlock Deck
k this deck
57
The following figure gives the graph of , where is the computer hard disk capacity (in hundreds of megabytes) that could be bought for years past 1989 . If the trend displayed in the graph continued, how many megabytes would a hard drive have in 1997? Round to the nearest hundred.
, capacity (in 100 s of megabytes)
, capacity (in 100 s of megabytes)
Unlock Deck
Unlock for access to all 94 flashcards in this deck.
Unlock Deck
k this deck
58
The following figure gives the graph of , where is the computer hard disk capacity (in hundreds of megabytes) that could be bought for years past 1989 . If the trend displayed in the graph continued, in what year would the capacity that can be bought for be 4,600 ?
Unlock Deck
Unlock for access to all 94 flashcards in this deck.
Unlock Deck
k this deck
59
Which of the following characteristics describe the graph of ?
A) It is concave down.
B) It is concave up.
C) It crosses the -axis at 1 .
D) As .
E) As .
F) As .
G) As .
A) It is concave down.
B) It is concave up.
C) It crosses the -axis at 1 .
D) As .
E) As .
F) As .
G) As .
Unlock Deck
Unlock for access to all 94 flashcards in this deck.
Unlock Deck
k this deck
60
The amount of pollution in a harbor hours after it was contaminated by illegal dumping is given by tons. After how many hours is there less than 10 tons of pollution in the harbor? Round to 1 decimal place.
Unlock Deck
Unlock for access to all 94 flashcards in this deck.
Unlock Deck
k this deck
61
What is the horizontal asymptote of as ?
A)
B)
C)
D) There isn't one
A)
B)
C)
D) There isn't one
Unlock Deck
Unlock for access to all 94 flashcards in this deck.
Unlock Deck
k this deck
62
Consider the following figure, where Graph I has equation , Graph II has equation , Graph III has equation , and Graph IV has equation .
Is positive or negative?
Is positive or negative?
Unlock Deck
Unlock for access to all 94 flashcards in this deck.
Unlock Deck
k this deck
63
Let be the intersection of the graphs of the two exponential functions and , where . If is increased, does increase, decrease, or stay the same?
Unlock Deck
Unlock for access to all 94 flashcards in this deck.
Unlock Deck
k this deck
64
Let be the intersection of the graphs of the two exponential functions and , where . If is increased, does increase, decrease, or stay the same?
Unlock Deck
Unlock for access to all 94 flashcards in this deck.
Unlock Deck
k this deck
65
Assume that all important features are shown in the following graph of .
What is ? For or , enter "inf" or "-inf".
What is ? For or , enter "inf" or "-inf".
Unlock Deck
Unlock for access to all 94 flashcards in this deck.
Unlock Deck
k this deck
66
The graph of has a horizontal asymptote at ---------. (If there is no horizontal asymptote, enter "DNE".)
Unlock Deck
Unlock for access to all 94 flashcards in this deck.
Unlock Deck
k this deck
67
Is the function graphed exponential?
Unlock Deck
Unlock for access to all 94 flashcards in this deck.
Unlock Deck
k this deck
68
Is the function graphed exponential?
Unlock Deck
Unlock for access to all 94 flashcards in this deck.
Unlock Deck
k this deck
69
Solve for if .
Unlock Deck
Unlock for access to all 94 flashcards in this deck.
Unlock Deck
k this deck
70
An investment grows according to the formula . How many years will it take for the original investment to triple? Round to 1 decimal place.
Unlock Deck
Unlock for access to all 94 flashcards in this deck.
Unlock Deck
k this deck
71
The price of an item increases due to inflation. Let give the price of the item as a function of time in years, with in 2004. At what continuous annual rate is the price increasing? Round to 2 decimal places.
Unlock Deck
Unlock for access to all 94 flashcards in this deck.
Unlock Deck
k this deck
72
Is the formula for a function representing a quantity which begins at in year and grows at a constant annual rate of given by
Unlock Deck
Unlock for access to all 94 flashcards in this deck.
Unlock Deck
k this deck
73
Is the formula for a function representing a quantity which begins at in year and grows at a continuous annual rate of given by
Unlock Deck
Unlock for access to all 94 flashcards in this deck.
Unlock Deck
k this deck
74
Is the formula for a function representing a quantity which begins at an amount larger than in year and grows at a continuous annual rate of given by ?
Unlock Deck
Unlock for access to all 94 flashcards in this deck.
Unlock Deck
k this deck
75
Is the formula for a function representing a quantity which begins at in year and grows at a continuous annual rate of given by
Unlock Deck
Unlock for access to all 94 flashcards in this deck.
Unlock Deck
k this deck
76
Let give the size of a population of animals in year . What will the population be after 12 years? Round to the nearest whole number.
Unlock Deck
Unlock for access to all 94 flashcards in this deck.
Unlock Deck
k this deck
77
Let give the size of a population of animals in year . After how many years will the population be approximately 10,099 ? Round to the nearest year.
Unlock Deck
Unlock for access to all 94 flashcards in this deck.
Unlock Deck
k this deck
78
The US population in 2005 was approximately 296.4 million. Assume the population increases at a rate of per year. What is the formula for , the population for the United States years after 2005?
A)
B)
C)
D)
A)
B)
C)
D)
Unlock Deck
Unlock for access to all 94 flashcards in this deck.
Unlock Deck
k this deck
79
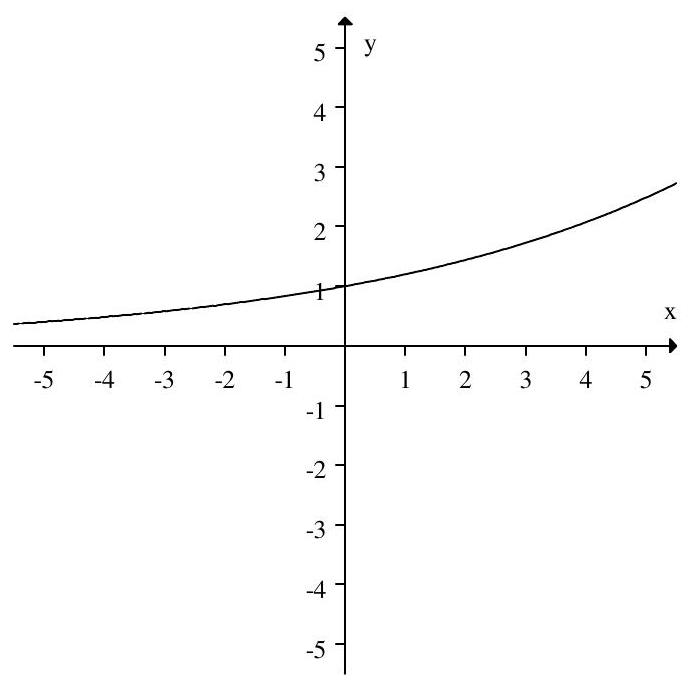
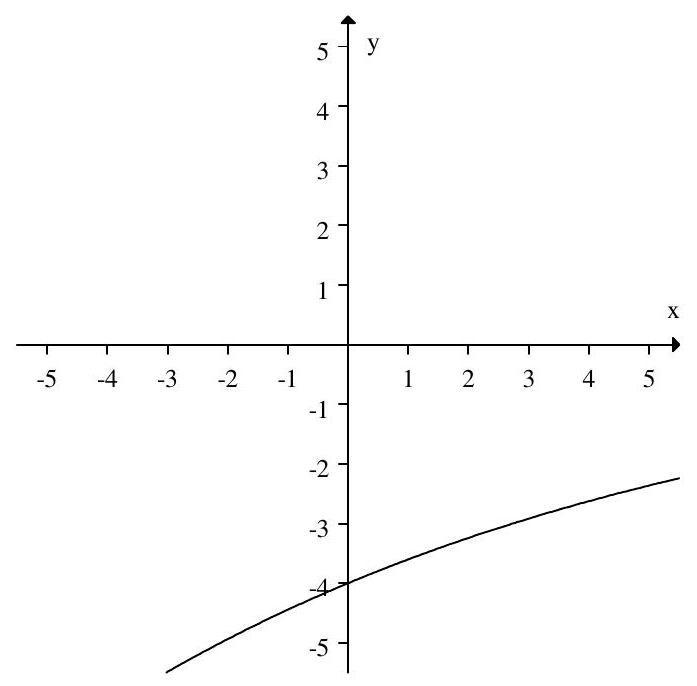
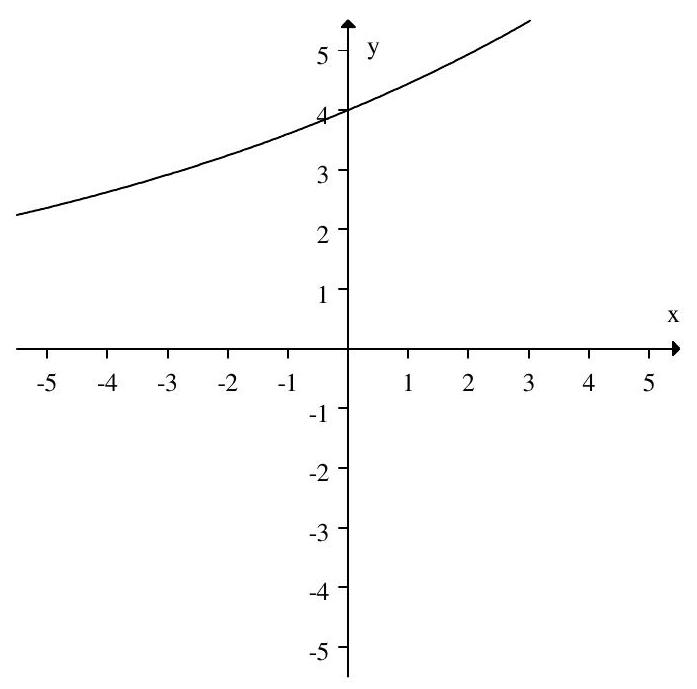
The figure below shows the graphs of the following functions:
(A)
(B)
(C)
(D)
Which one is the graph of A?
(A)
(B)
(C)
(D)
Which one is the graph of A?
Unlock Deck
Unlock for access to all 94 flashcards in this deck.
Unlock Deck
k this deck
80
What is ? If necessary, enter "inf" for and "-inf" for .
Unlock Deck
Unlock for access to all 94 flashcards in this deck.
Unlock Deck
k this deck
Unlock Deck
Unlock for access to all 94 flashcards in this deck.


