Deck 7: Managing Quality and Time to Create Value
Full screen (f)
Question
Question
Question
Question
Question
Question
Question
Question
Question
Question
Question
Question
Question
Question
Question
Question
Question
Question
Question
Question
Question
Question
Question
Question
Question
Question
Question
Question
Question
Question
Question
Question
Question
Question
Question
Question
Question
Question
Question
Question
Question
Question
Question
Question
Question
Question
Question
Question
Question
Question
Question
Question
Question
Question
Question
Question
Question
Question
Question
Question
Question
Question
Question
Question
Question
Question
Question
Question
Question
Question
Question
Question
Question
Question
Question
Identify the company or companies below that is (are) most likely using a traditional inventory system as opposed to a JIT system.
A) Alpha
B) Beta
C) Gamma
D) Both Alpha and Beta
A) Alpha
B) Beta
C) Gamma
D) Both Alpha and Beta
Question
Question
Use the following to answer questions:
Le Francois Company developed the following information for its first quarter cost of quality report:
-The total cost of prevention activities for Le Francois Company is:
A) $294,000
B) $224,000
C) $459,200
D) $504,000
Le Francois Company developed the following information for its first quarter cost of quality report:
-The total cost of prevention activities for Le Francois Company is:
A) $294,000
B) $224,000
C) $459,200
D) $504,000
Question
Use the following to answer questions:
Le Francois Company developed the following information for its first quarter cost of quality report:
-The relevant percentage to be used to express internal failure activities at Le Francois is:
A) 27.9%
B) 4.77%
C) 4.2%
D) 15.02%
Le Francois Company developed the following information for its first quarter cost of quality report:
-The relevant percentage to be used to express internal failure activities at Le Francois is:
A) 27.9%
B) 4.77%
C) 4.2%
D) 15.02%
Question
Use the following to answer questions:
Le Francois Company developed the following information for its first quarter cost of quality report:
-The total cost of external failure activities at Le Francois is:
A) $420,560
B) $15,960
C) $117,600
D) $175,000
Le Francois Company developed the following information for its first quarter cost of quality report:
-The total cost of external failure activities at Le Francois is:
A) $420,560
B) $15,960
C) $117,600
D) $175,000
Question
Use the following to answer questions:
Le Francois Company developed the following information for its first quarter cost of quality report:
-The relevant percentage to be used to express appraisal activities at Le Francois is:
A) 5.7%
B) 33.2%
C) 2.75%
D) 5%
Le Francois Company developed the following information for its first quarter cost of quality report:
-The relevant percentage to be used to express appraisal activities at Le Francois is:
A) 5.7%
B) 33.2%
C) 2.75%
D) 5%

Unlock Deck
Sign up to unlock the cards in this deck!
Unlock Deck
Unlock Deck
1/114
Play
Full screen (f)
Deck 7: Managing Quality and Time to Create Value
1
The return-on-quality (ROQ) view of quality management assumes that there is a tradeoff between the costs and benefits of improving quality.
True
2
A defect is an attribute of a product, either tangible or intangible, that falls short of customer expectations.
True
3
The optimum quality level maximizes total quality rather than total profits.
False
4
The optimum quality level is always higher than the maximum quality level.
Unlock Deck
Unlock for access to all 114 flashcards in this deck.
Unlock Deck
k this deck
5
Total quality management (TQM) assumes that improvements in quality, as defined by customers, will always result in improved organizational performance.
Unlock Deck
Unlock for access to all 114 flashcards in this deck.
Unlock Deck
k this deck
6
Two generally accepted quality dimensions are product or service attributes and profitability from an individual customer.
Unlock Deck
Unlock for access to all 114 flashcards in this deck.
Unlock Deck
k this deck
7
A run chart is a chart that shows trends in variations in products or service attributes over time by reflecting measures of important quality features taken at defined points in time.
Unlock Deck
Unlock for access to all 114 flashcards in this deck.
Unlock Deck
k this deck
8
The maximum and minimum desired levels on a control chart are called the upper control limit and the lower control limit.
Unlock Deck
Unlock for access to all 114 flashcards in this deck.
Unlock Deck
k this deck
9
A control chart describes variation in product or service attributes over time by measuring important quality features and comparing them to maximum and minimum desired levels.
Unlock Deck
Unlock for access to all 114 flashcards in this deck.
Unlock Deck
k this deck
10
A histogram is a chart that shows trends in variation in products or service attributes over time by reflecting measures of important quality features taken at defined points in time.
Unlock Deck
Unlock for access to all 114 flashcards in this deck.
Unlock Deck
k this deck
11
Cause-and effect-analysis involves formulating diagnostic signals that identify potential causes of product or service defects.
Unlock Deck
Unlock for access to all 114 flashcards in this deck.
Unlock Deck
k this deck
12
Lead indicator information usually identifies quality problems and diagnoses their cause(s).
Unlock Deck
Unlock for access to all 114 flashcards in this deck.
Unlock Deck
k this deck
13
A scatter diagram is a plot of two measures that may be related.
Unlock Deck
Unlock for access to all 114 flashcards in this deck.
Unlock Deck
k this deck
14
Errors due to inadequate or outdated work instructions can be best diagnosed using run and control charts.
Unlock Deck
Unlock for access to all 114 flashcards in this deck.
Unlock Deck
k this deck
15
A flowchart is a plot of two measures that may be related that helps to diagnose cause-and-effect between outcomes and activities that may drive them.
Unlock Deck
Unlock for access to all 114 flashcards in this deck.
Unlock Deck
k this deck
16
Variations in customer service leading to poor-quality service can be most effectively diagnosed using a histogram.
Unlock Deck
Unlock for access to all 114 flashcards in this deck.
Unlock Deck
k this deck
17
A Pareto chart prioritizes the causes of problems or defects as bars of varying height, in order of frequency or size.
Unlock Deck
Unlock for access to all 114 flashcards in this deck.
Unlock Deck
k this deck
18
Organizations usually sort costs of quality by quality activity and express them as a percentage of total costs.
Unlock Deck
Unlock for access to all 114 flashcards in this deck.
Unlock Deck
k this deck
19
Customer satisfaction is the degree to which expectations of attributes, customer service, and price have been or are expected to be met.
Unlock Deck
Unlock for access to all 114 flashcards in this deck.
Unlock Deck
k this deck
20
Wasted time would generally be categorized as an external failure activity.
Unlock Deck
Unlock for access to all 114 flashcards in this deck.
Unlock Deck
k this deck
21
Redoing customer service is classified as an external failure activity.
Unlock Deck
Unlock for access to all 114 flashcards in this deck.
Unlock Deck
k this deck
22
Field testing products in use at customer sites is classified as a prevention activity.
Unlock Deck
Unlock for access to all 114 flashcards in this deck.
Unlock Deck
k this deck
23
Performance measurement is classified as an appraisal activity.
Unlock Deck
Unlock for access to all 114 flashcards in this deck.
Unlock Deck
k this deck
24
Internal failure activities are required to correct defective processes, products, and services that are detected after they have been delivered to customers.
Unlock Deck
Unlock for access to all 114 flashcards in this deck.
Unlock Deck
k this deck
25
Engaging in marketing activities to improve a company's image that has been tarnished from poor product quality is an example of an external failure activity
Unlock Deck
Unlock for access to all 114 flashcards in this deck.
Unlock Deck
k this deck
26
The Malcolm Baldrige Quality Award is awarded to companies around the world that excel in quality improvement.
Unlock Deck
Unlock for access to all 114 flashcards in this deck.
Unlock Deck
k this deck
27
The Deming Prize is awarded to companies around the world that excel in quality improvement.
Unlock Deck
Unlock for access to all 114 flashcards in this deck.
Unlock Deck
k this deck
28
New product or service development time is the period between the first consideration of a product or service and its initial sale to the customer.
Unlock Deck
Unlock for access to all 114 flashcards in this deck.
Unlock Deck
k this deck
29
Production cycle time is the elapsed time between starting and finishing a process, including any time to correct mistakes.
Unlock Deck
Unlock for access to all 114 flashcards in this deck.
Unlock Deck
k this deck
30
Production cycle time does not factor in time to correct mistakes.
Unlock Deck
Unlock for access to all 114 flashcards in this deck.
Unlock Deck
k this deck
31
Throughput is the amount of goods and services produced and delivered to customers during a period of time measured in dollar terms or physical measures.
Unlock Deck
Unlock for access to all 114 flashcards in this deck.
Unlock Deck
k this deck
32
Total factor productivity is measured by dividing total cost of providing goods and services by the value of goods and services.
Unlock Deck
Unlock for access to all 114 flashcards in this deck.
Unlock Deck
k this deck
33
In computing average cycle time, companies should include the time of reworking defective units.
Unlock Deck
Unlock for access to all 114 flashcards in this deck.
Unlock Deck
k this deck
34
The throughput time ratio is the ratio of time spent adding customer value to products divided by total cycle time.
Unlock Deck
Unlock for access to all 114 flashcards in this deck.
Unlock Deck
k this deck
35
Cycle time is the time from the receipt of an order of a unit of existing product or service to its packaging and shipment to the customer.
Unlock Deck
Unlock for access to all 114 flashcards in this deck.
Unlock Deck
k this deck
36
New product development time is the period between the first consideration of a product and its initial sale to the customer.
Unlock Deck
Unlock for access to all 114 flashcards in this deck.
Unlock Deck
k this deck
37
The throughput time ratio measures the relative percentage of value-added time spent on processing a customer's order.
Unlock Deck
Unlock for access to all 114 flashcards in this deck.
Unlock Deck
k this deck
38
Effective production management results in higher cycle times and high throughput.
Unlock Deck
Unlock for access to all 114 flashcards in this deck.
Unlock Deck
k this deck
39
Total factor productivity is the value of goods and services divided by the cost of providing them.
Unlock Deck
Unlock for access to all 114 flashcards in this deck.
Unlock Deck
k this deck
40
Practical capacity is always more than theoretical capacity.
Unlock Deck
Unlock for access to all 114 flashcards in this deck.
Unlock Deck
k this deck
41
The highest possible value of the throughput time ratio is 200%.
Unlock Deck
Unlock for access to all 114 flashcards in this deck.
Unlock Deck
k this deck
42
The objective of just-in-time (JIT) is to eliminate all defects in products.
Unlock Deck
Unlock for access to all 114 flashcards in this deck.
Unlock Deck
k this deck
43
Just-in-time (JIT) processes have short cycle times.
Unlock Deck
Unlock for access to all 114 flashcards in this deck.
Unlock Deck
k this deck
44
Inventory carrying costs include receiving, handling, storage and obsolescence.
Unlock Deck
Unlock for access to all 114 flashcards in this deck.
Unlock Deck
k this deck
45
Companies using just-in-time inventory (JIT) systems generally experience lower inventory turnover than those not using JIT.
Unlock Deck
Unlock for access to all 114 flashcards in this deck.
Unlock Deck
k this deck
46
Just-in-time concepts do not apply to service organizations.
Unlock Deck
Unlock for access to all 114 flashcards in this deck.
Unlock Deck
k this deck
47
A company that has implemented a just-in-time manufacturing system is utilizing the "push"
philosophy of manufacturing.
philosophy of manufacturing.
Unlock Deck
Unlock for access to all 114 flashcards in this deck.
Unlock Deck
k this deck
48
In a just-in-time manufacturing system, a sales order will normally trigger a production order.
Unlock Deck
Unlock for access to all 114 flashcards in this deck.
Unlock Deck
k this deck
49
A statistical control chart displays customer response times against the historical mean and historical variation.
Unlock Deck
Unlock for access to all 114 flashcards in this deck.
Unlock Deck
k this deck
50
Control limits in a statistical control chart will always be symmetrical.
Unlock Deck
Unlock for access to all 114 flashcards in this deck.
Unlock Deck
k this deck
51
A process can be out of control even if attribute measures do not violate control limits.
Unlock Deck
Unlock for access to all 114 flashcards in this deck.
Unlock Deck
k this deck
52
Which of the following statements about quality is False?
A) The maximum quality level is almost always lower than the optimum quality level
B) Total delight represents a condition when a customer receives a product or service far exceeding his or her expectations of quality
C) Return on quality is the view that assumes there is a tradeoff between the costs and benefits of improving quality
D) Optimum quality level of products and services maximizes profits rather than quality
Unlock Deck
Unlock for access to all 114 flashcards in this deck.
Unlock Deck
k this deck
53
Which of the following statements is True about the return-on-quality (ROQ) view of quality management
A) Assumes that improvements in quality will always result in improved organizational performance
B) Assumes that there is a trade-off between the costs of quality and the benefits of improving quality
C) Has a goal of exceeding customers' quality expectations
D) Assumes that customers are willing to pay a premium for higher quality products and services
Unlock Deck
Unlock for access to all 114 flashcards in this deck.
Unlock Deck
k this deck
54
Which of the following is a tangible feature of a product or service?
A) Reputation
B) Taste
C) Style
D) Adherence to specifications
A) Reputation
B) Taste
C) Style
D) Adherence to specifications
Unlock Deck
Unlock for access to all 114 flashcards in this deck.
Unlock Deck
k this deck
55
Which of the following is an intangible feature of a product or service?
A) Performance
B) Adherence to specifications
C) Taste
D) Functionality
A) Performance
B) Adherence to specifications
C) Taste
D) Functionality
Unlock Deck
Unlock for access to all 114 flashcards in this deck.
Unlock Deck
k this deck
56
Which of the following is not an internal failure activity?
A) Disposal
B) Delaying processes
C) Warranty repairs
D) Reinspecting
A) Disposal
B) Delaying processes
C) Warranty repairs
D) Reinspecting
Unlock Deck
Unlock for access to all 114 flashcards in this deck.
Unlock Deck
k this deck
57
Which of the following is an external failure activity?
A) Disposing of scrap
B) Rework
C) Delaying processes
D) Restoration of reputation
A) Disposing of scrap
B) Rework
C) Delaying processes
D) Restoration of reputation
Unlock Deck
Unlock for access to all 114 flashcards in this deck.
Unlock Deck
k this deck
58
Which of the following is not an external failure activity?
A) Resolving customer complaints
B) Settling product liability
C) Disposing of scrap
D) Field replacements
A) Resolving customer complaints
B) Settling product liability
C) Disposing of scrap
D) Field replacements
Unlock Deck
Unlock for access to all 114 flashcards in this deck.
Unlock Deck
k this deck
59
Which of the following is an appraisal activity?
A) Disposing of Scrap
B) Performing Rework
C) Customer-complaint resolution
D) Inspecting processes
A) Disposing of Scrap
B) Performing Rework
C) Customer-complaint resolution
D) Inspecting processes
Unlock Deck
Unlock for access to all 114 flashcards in this deck.
Unlock Deck
k this deck
60
Which of the following statements describes a histogram?
A) Shows trends in variation in product or service attributes over time by reflecting measures of importan quality features taken at defined points in time
B) Displays frequency distribution of an attribute's measures around an average attribute value
C) Describes variation in product or service attributes over time by measuring important quality feature and comparing to maximum and minimum desired levels
D) Plots two measures that may be related to diagnose cause and effect outcomes and activities that may drive them
Unlock Deck
Unlock for access to all 114 flashcards in this deck.
Unlock Deck
k this deck
61
Which of the following statements describes a scatter diagram?
A) Shows trends in variation in product or service attributes over time by reflecting measures of
B) important quality features taken at defined points in time
C) Displays frequency distribution of an attribute's measures around an average attribute value
D) Describes variation in product or service attributes over time by measuring important quality features . and comparing to maximum and minimum desired levels
E) Plots two measures that may be related to diagnose cause and effect outcomes and activities that may drive them
Unlock Deck
Unlock for access to all 114 flashcards in this deck.
Unlock Deck
k this deck
62
Which of the following statements describes a run chart?
A) Shows trends in variation in product or service attributes over time by reflecting measures of importan quality features taken at defined points in time
B) Displays frequency distribution of an attribute's measures around an average attribute value
C) Plots two measures that may be related to diagnose cause and effect outcomes and activities that may drive them
Unlock Deck
Unlock for access to all 114 flashcards in this deck.
Unlock Deck
k this deck
63
Which of the following statements describes a control chart?
A) Shows trends in variation in product or service attributes over time by reflecting measures of important quality features taken at defined points in time
B) Displays frequency distribution of an attribute's measures around an average attribute value
C) Describes variation in product or service attributes over time by measuring important quality features and comparing to maximum and minimum desired levels
D) Plots two measures that may be related to diagnose cause and effect outcomes and activities that may drive them
Unlock Deck
Unlock for access to all 114 flashcards in this deck.
Unlock Deck
k this deck
64
Which of the following statements describes a flowchart?
A) Shows trends in variation in product or service attributes over time by reflecting measures of important quality features taken at defined points in time
B) Displays frequency distribution of an attribute's measures around an average attribute value
C) Reflects cause and effect and sequential linkages among process activities
D) Plots two measures that may be related to diagnose cause and effect outcomes and activities that may drive them
Unlock Deck
Unlock for access to all 114 flashcards in this deck.
Unlock Deck
k this deck
65
Which of the following statements describes a Pareto chart?
A) Prioritizes the causes of problems or defects as bars of varying height, in order of frequency or size
B) Displays frequency distribution of an attribute's measures around an average attribute value
C) Reflects cause and effect and sequential linkages among process activities
D) Plots two measures that may be related to diagnose cause and effect outcomes and activities that may drive them
Unlock Deck
Unlock for access to all 114 flashcards in this deck.
Unlock Deck
k this deck
66
Cook Corporation is trying to identify potential causes of product or service defects. Which of the following will be most useful to Cook:
A) Flowchart
B) Pareto chart
C) Cause-and-effect diagram
D) Run chart
A) Flowchart
B) Pareto chart
C) Cause-and-effect diagram
D) Run chart
Unlock Deck
Unlock for access to all 114 flashcards in this deck.
Unlock Deck
k this deck
67
Shaw Company is trying to identify the most frequent causes of its quality problems so that it can concentrate on those that offer the greatest potential for improvement. The quality tool that would be most useful to Shaw is:
A) Flowchart
B) Pareto chart
C) Cause-and-effect diagram
D) Run chart
A) Flowchart
B) Pareto chart
C) Cause-and-effect diagram
D) Run chart
Unlock Deck
Unlock for access to all 114 flashcards in this deck.
Unlock Deck
k this deck
68
Brice Corporation suspects that improper information given to customers by customer service is related to the time spent by employees in responding to customer service calls. The quality tool that would be most useful to Brice in diagnosing this relationship is:
A) Flowchart
B) Pareto chart
C) Cause-and-effect diagram
D) Scatter diagram
A) Flowchart
B) Pareto chart
C) Cause-and-effect diagram
D) Scatter diagram
Unlock Deck
Unlock for access to all 114 flashcards in this deck.
Unlock Deck
k this deck
69
The Malcolm Baldrige Award:
A) Is awarded to companies around the world that excel in quality improvement
B) Is awarded to the company that does the best job of adhering to ISO 9000 standards
C) Recognizes U.S. firms with outstanding records of quality improvements and quality management
D) Is required to received ISO 9000 certification
Unlock Deck
Unlock for access to all 114 flashcards in this deck.
Unlock Deck
k this deck
70
The Deming Prize:
A) Is awarded to companies around the world that excel in quality improvement
B) Is awarded to the company that does the best job of adhering to ISO 9000 standards
C) Recognizes U.S. firms with outstanding records of quality improvements and quality management
D) Is required to received ISO 9000 certification
Unlock Deck
Unlock for access to all 114 flashcards in this deck.
Unlock Deck
k this deck
71
Which of the following will not reduce customer response time?
A) Electronic ordering
B) Eliminating non-value-added activities
C) Increasing production cycle time
D) Eliminating bottlenecks
A) Electronic ordering
B) Eliminating non-value-added activities
C) Increasing production cycle time
D) Eliminating bottlenecks
Unlock Deck
Unlock for access to all 114 flashcards in this deck.
Unlock Deck
k this deck
72
Which of the following represents the throughput time ratio?
A) Ratio of time spent adding customer value to products and services divided by total cycle time
B) Ratio of total cycle time divided by time spent adding customer value to products and services
C) Ratio of outcomes of a process divided by the amount of resources necessary to complete the process
D) Ratio of amount of resources necessary to complete a process divided by the outcomes of a process
Unlock Deck
Unlock for access to all 114 flashcards in this deck.
Unlock Deck
k this deck
73
Dunn Corporation finds that 60% of the time spent in its manufacturing process is on non-value added activities such as moving parts and inspection. Dunn needs to improve:
A) Its throughput
B) Its customer-response time
C) Its throughput time ratio
D) Its average cycle time
A) Its throughput
B) Its customer-response time
C) Its throughput time ratio
D) Its average cycle time
Unlock Deck
Unlock for access to all 114 flashcards in this deck.
Unlock Deck
k this deck
74
Companies using just-in-time (JIT) inventory systems will generally have:
A) Higher inventory turnover and lower total sales than traditional companies
B) Higher inventory turnover and higher total sales than traditional companies
C) Lower inventory turnover and higher sales per employee than traditional companies
D) Higher inventory turnover and higher sales per employee than traditional companies
Unlock Deck
Unlock for access to all 114 flashcards in this deck.
Unlock Deck
k this deck
75
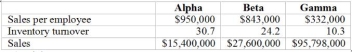
Identify the company or companies below that is (are) most likely using a traditional inventory system as opposed to a JIT system.
A) Alpha
B) Beta
C) Gamma
D) Both Alpha and Beta
A) Alpha
B) Beta
C) Gamma
D) Both Alpha and Beta
Unlock Deck
Unlock for access to all 114 flashcards in this deck.
Unlock Deck
k this deck
76
Which of the following is not one of the three dimensions of time that successful organizations must focus on?
A) The length of time of the average workweek
B) Customer response time
C) Cycle time
D) Service development time
A) The length of time of the average workweek
B) Customer response time
C) Cycle time
D) Service development time
Unlock Deck
Unlock for access to all 114 flashcards in this deck.
Unlock Deck
k this deck
77
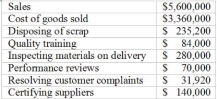
Use the following to answer questions:
Le Francois Company developed the following information for its first quarter cost of quality report:
-The total cost of prevention activities for Le Francois Company is:
A) $294,000
B) $224,000
C) $459,200
D) $504,000
Le Francois Company developed the following information for its first quarter cost of quality report:
-The total cost of prevention activities for Le Francois Company is:
A) $294,000
B) $224,000
C) $459,200
D) $504,000
Unlock Deck
Unlock for access to all 114 flashcards in this deck.
Unlock Deck
k this deck
78
Use the following to answer questions:
Le Francois Company developed the following information for its first quarter cost of quality report:
-The relevant percentage to be used to express internal failure activities at Le Francois is:
A) 27.9%
B) 4.77%
C) 4.2%
D) 15.02%
Le Francois Company developed the following information for its first quarter cost of quality report:
-The relevant percentage to be used to express internal failure activities at Le Francois is:
A) 27.9%
B) 4.77%
C) 4.2%
D) 15.02%
Unlock Deck
Unlock for access to all 114 flashcards in this deck.
Unlock Deck
k this deck
79
Use the following to answer questions:
Le Francois Company developed the following information for its first quarter cost of quality report:
-The total cost of external failure activities at Le Francois is:
A) $420,560
B) $15,960
C) $117,600
D) $175,000
Le Francois Company developed the following information for its first quarter cost of quality report:
-The total cost of external failure activities at Le Francois is:
A) $420,560
B) $15,960
C) $117,600
D) $175,000
Unlock Deck
Unlock for access to all 114 flashcards in this deck.
Unlock Deck
k this deck
80
Use the following to answer questions:
Le Francois Company developed the following information for its first quarter cost of quality report:
-The relevant percentage to be used to express appraisal activities at Le Francois is:
A) 5.7%
B) 33.2%
C) 2.75%
D) 5%
Le Francois Company developed the following information for its first quarter cost of quality report:
-The relevant percentage to be used to express appraisal activities at Le Francois is:
A) 5.7%
B) 33.2%
C) 2.75%
D) 5%
Unlock Deck
Unlock for access to all 114 flashcards in this deck.
Unlock Deck
k this deck
Unlock Deck
Unlock for access to all 114 flashcards in this deck.


