Deck 5: Data, Graphs, and Statistics
Full screen (f)
Question
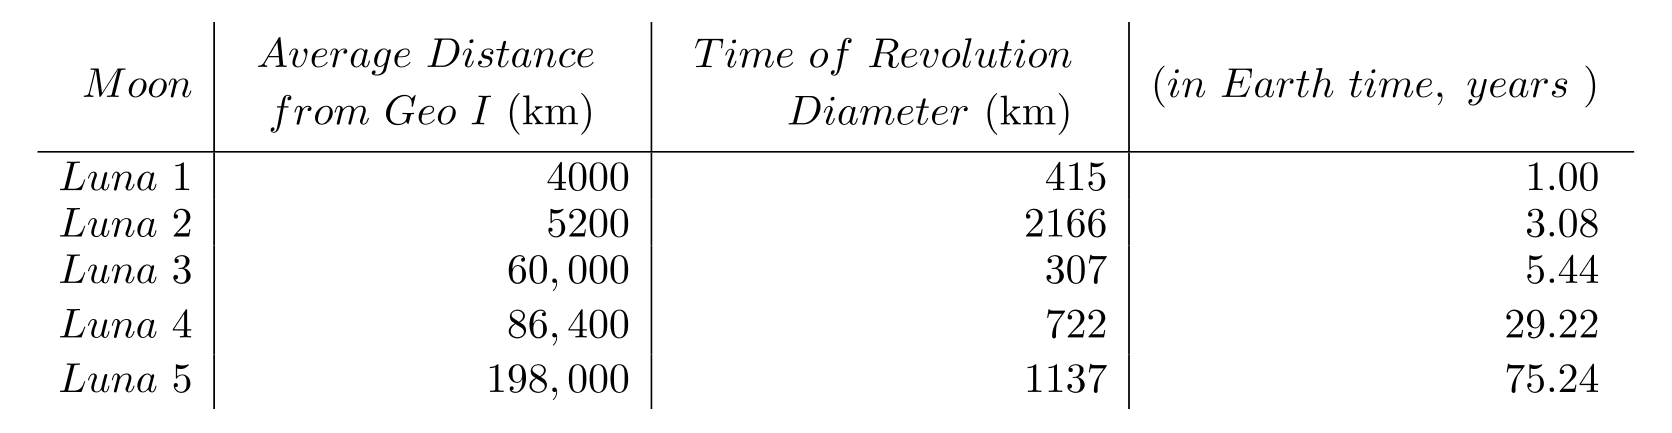
The following table contains information about moons orbiting a planet named Geo I. Use the table to solve the problem.
-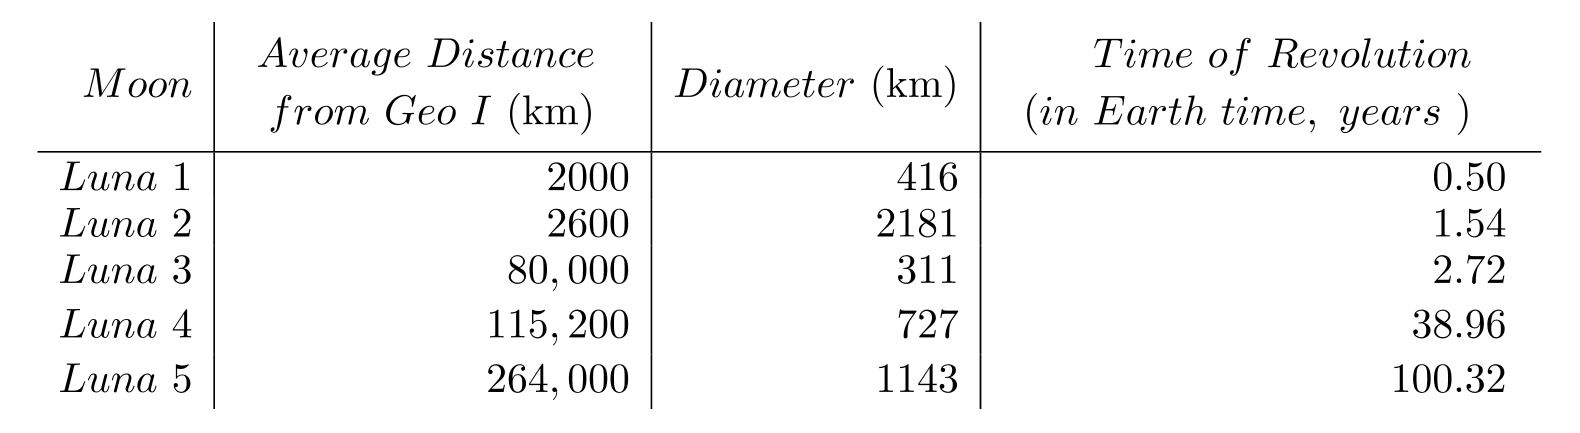
Find the average distance from Geo I to its moon Luna 1.
A)
B)
C)
D)
-
Find the average distance from Geo I to its moon Luna 1.
A)
B)
C)
D)
Question
The following table contains information about moons orbiting a planet named Geo I. Use the table to solve the problem.
- What is the time of revolution around Geo 1 of the moon Luna 4?
A) 724 years
B) 0.77 years
C) 29.22 years
D) 75.24 years
-
What is the time of revolution around Geo 1 of the moon Luna 4?A) 724 years
B) 0.77 years
C) 29.22 years
D) 75.24 years
Question
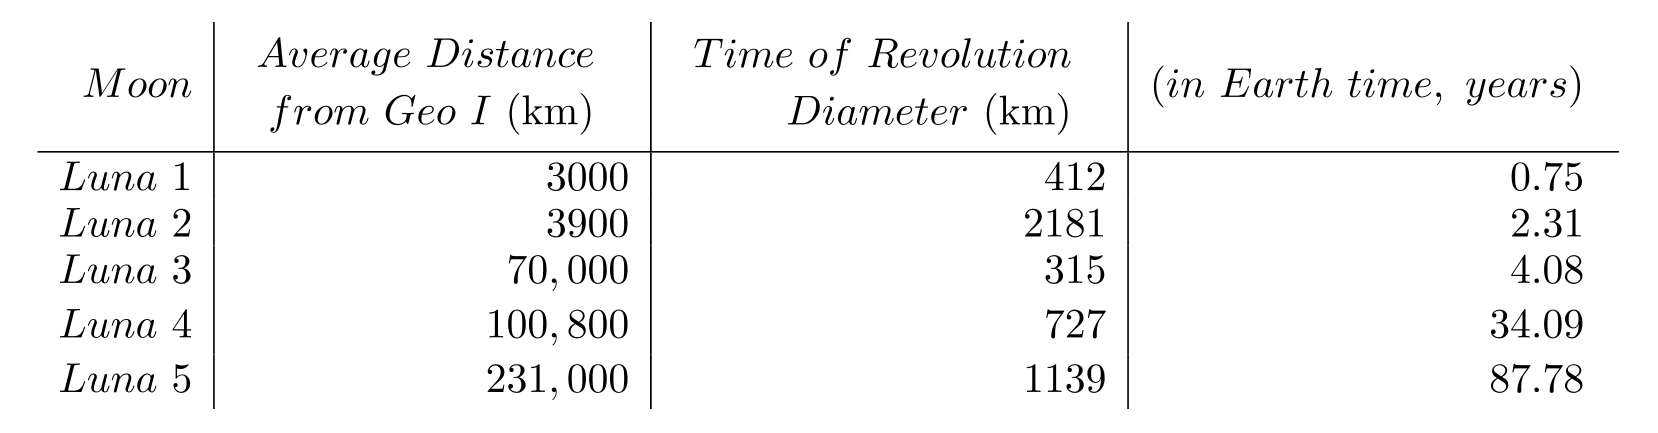
The following table contains information about moons orbiting a planet named Geo I. Use the table to solve the problem.
-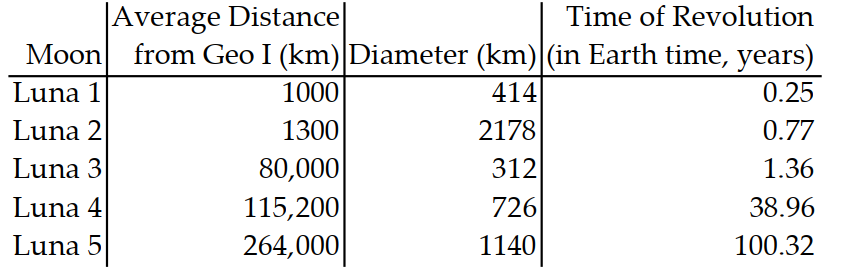
Which moon has a diameter of 312 kilometers?
A) Luna 3
B) Luna 1
C) Luna 2
D) Luna 4
-
Which moon has a diameter of 312 kilometers?
A) Luna 3
B) Luna 1
C) Luna 2
D) Luna 4
Question
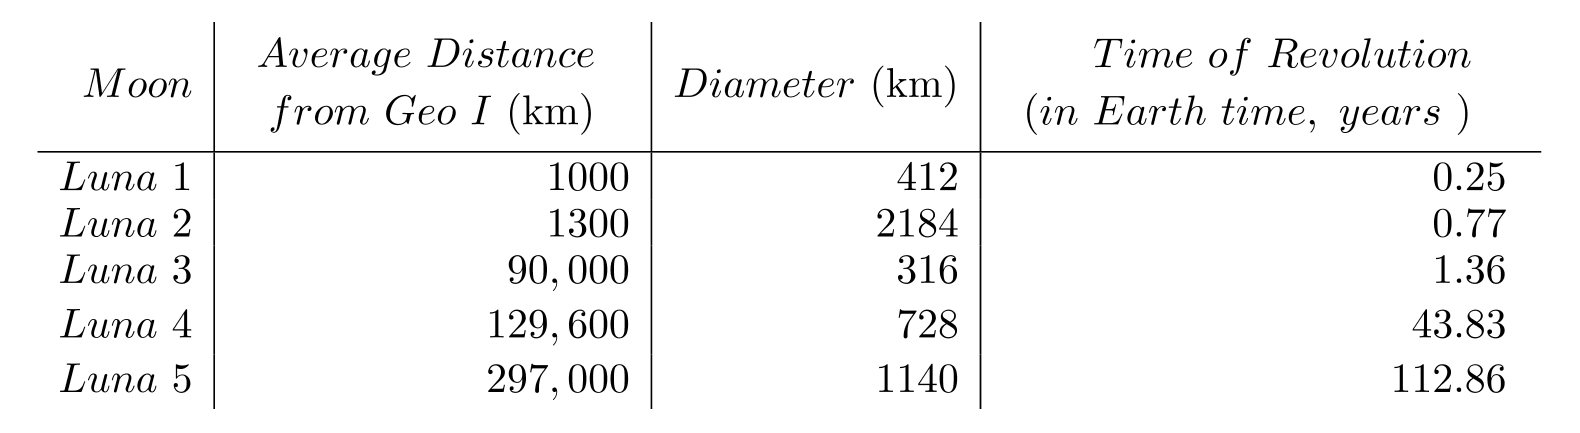
The following table contains information about moons orbiting a planet named Geo I. Use the table to solve the problem.
-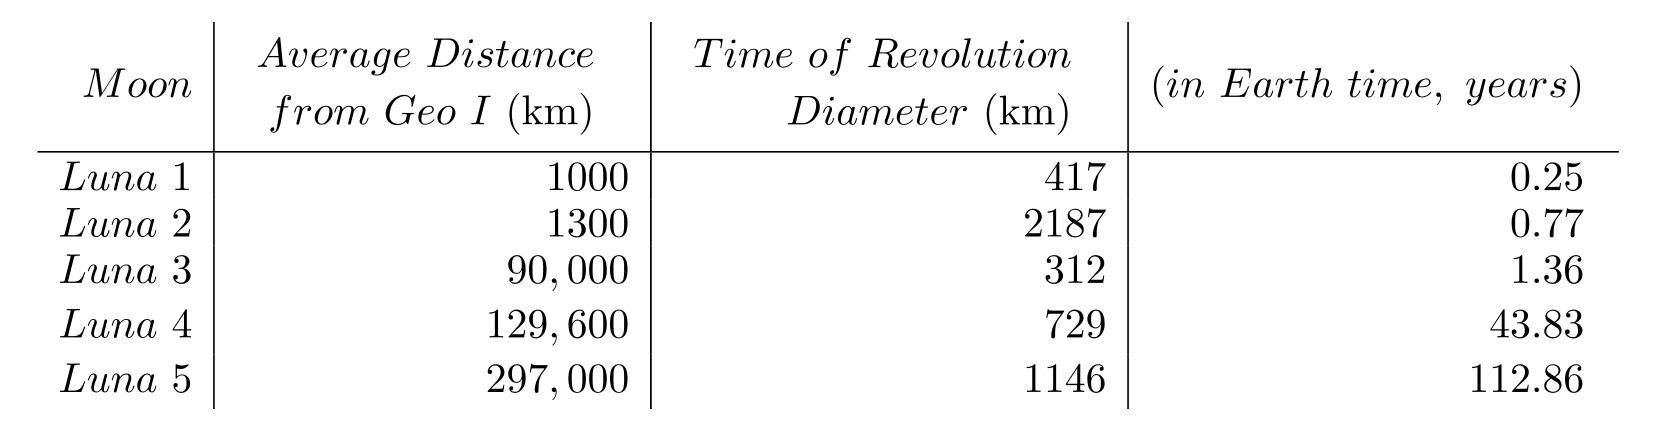 Which moons have average distance from Geo I less than ten thousand kilometers?
A) Luna 3, Luna 4, and Luna 5
B) None
C) Luna 1 and Luna 2
D) Luna 1 only
-
Which moons have average distance from Geo I less than ten thousand kilometers?A) Luna 3, Luna 4, and Luna 5
B) None
C) Luna 1 and Luna 2
D) Luna 1 only
Question
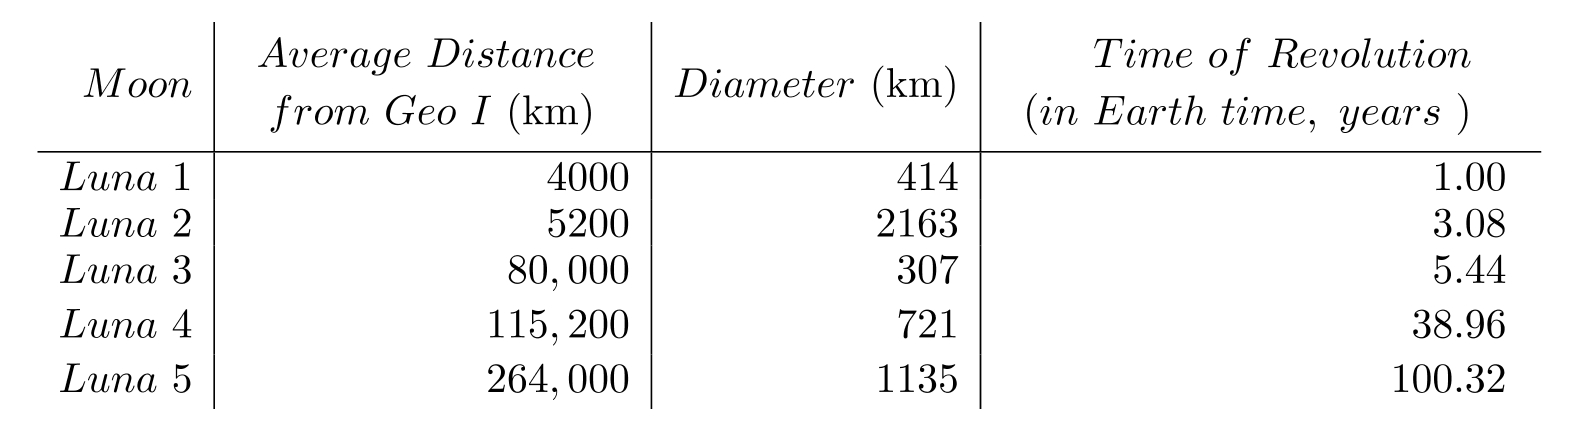
The following table contains information about moons orbiting a planet named Geo I. Use the table to solve the problem.
- How much further from Geo I is Luna 4 than Luna 2?
A)
B)
C)
D)
-
How much further from Geo I is Luna 4 than Luna 2?A)
B)
C)
D)
Question
The following table contains information about moons orbiting a planet named Geo I. Use the table to solve the problem.
-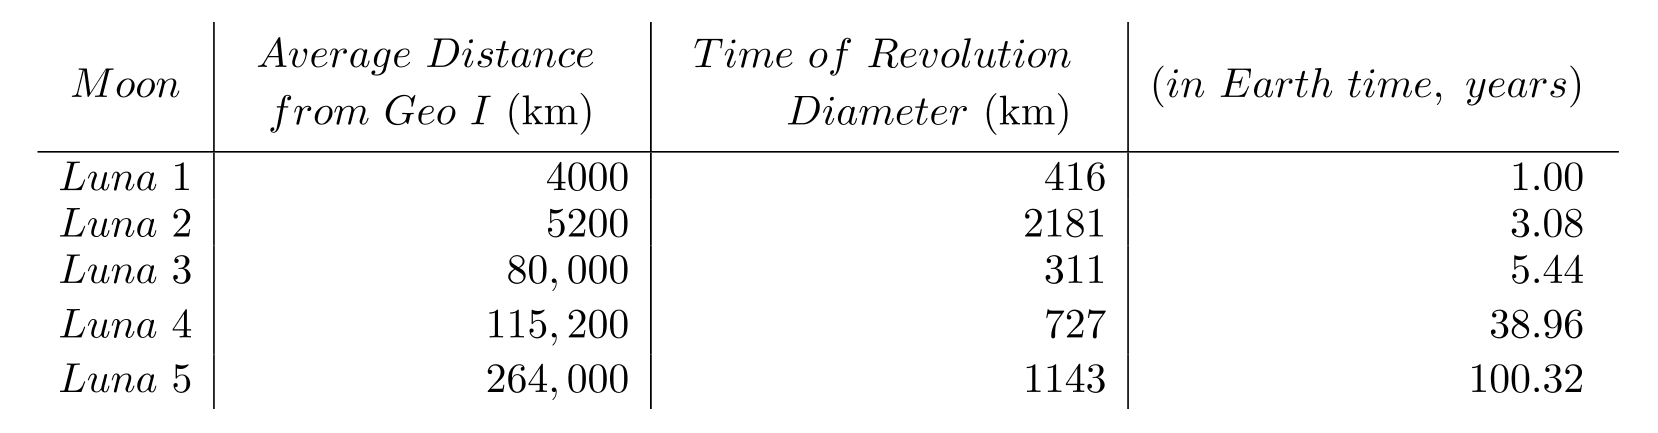 About how many Luna 3 diameters would it take to get one Luna 2 diameter?
A) 1870
B) 3
C) 7
D) 0.14
-
About how many Luna 3 diameters would it take to get one Luna 2 diameter?A) 1870
B) 3
C) 7
D) 0.14
Question
The following table contains information about moons orbiting a planet named Geo I. Use the table to solve the problem.
- What is the median of the average distance from Geo 1 of the moons?
A)
B)
C)
D)
-
What is the median of the average distance from Geo 1 of the moons?A)
B)
C)
D)
Question
The following table contains information about moons orbiting a planet named Geo I. Use the table to solve the problem.
- What is the average time of revolution of the moons?
A) 2.31 years
B) 4.08 years
C) 25.80 years
D) 954.80 years
-
What is the average time of revolution of the moons?A) 2.31 years
B) 4.08 years
C) 25.80 years
D) 954.80 years
Question
The following table contains information about moons orbiting a planet named Geo I. Use the table to solve the problem.
- What is the average of the diameters of the moons?
A)
B)
C)
D)
-
What is the average of the diameters of the moons?A)
B)
C)
D)
Question
The following table contains information about moons orbiting a planet named Geo I. Use the table to solve the problem.
- What is the mode of the diameters of the moons?
A)
B)
C)
D) No mode exists
-
What is the mode of the diameters of the moons?A)
B)
C)
D) No mode exists
Question
Use the pictograph to answer the question.
-For selected countries, this pictograph shows approximately how many kilograms of seafood are consumed by each person (per capita) annually.
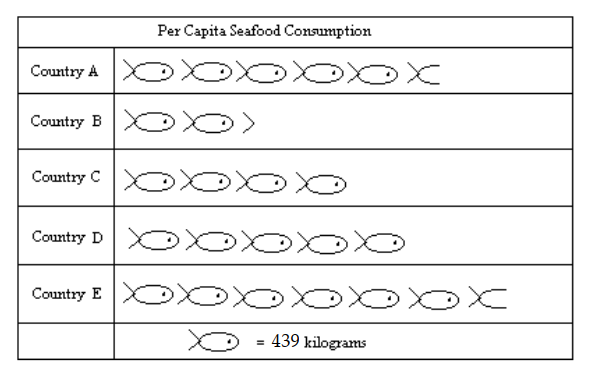
Which country consumes the most seafood?
A) Country A
B) Country E
C) Country B
D) Country C
-For selected countries, this pictograph shows approximately how many kilograms of seafood are consumed by each person (per capita) annually.
Which country consumes the most seafood?
A) Country A
B) Country E
C) Country B
D) Country C
Question
Use the pictograph to answer the question.
-For selected countries, this pictograph shows approximately how many kilograms of seafood are consumed by each person (per capita) annually.
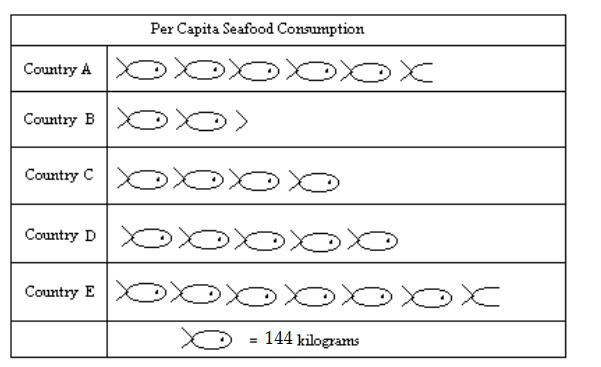
What is the approximate seafood consumption in Country E?
A) 900 kilograms
B) 972 kilograms
C) 864 kilograms
D) 1008 kilograms
-For selected countries, this pictograph shows approximately how many kilograms of seafood are consumed by each person (per capita) annually.
What is the approximate seafood consumption in Country E?
A) 900 kilograms
B) 972 kilograms
C) 864 kilograms
D) 1008 kilograms
Question
Use the pictograph to answer the question.
-For selected countries, this pictograph shows approximately how many kilograms of seafood are consumed by each person (per capita) annually.
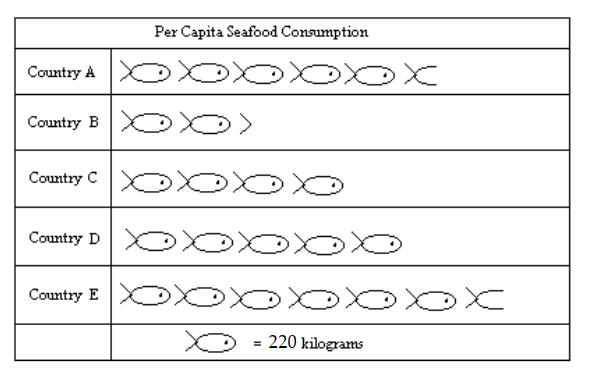
Approximately how many more kilograms of seafood is eaten per person in Country A than in Country B?
A) 660 kilograms
B) 715 kilograms
C) 770 kilograms
D) 550 kilograms
-For selected countries, this pictograph shows approximately how many kilograms of seafood are consumed by each person (per capita) annually.
Approximately how many more kilograms of seafood is eaten per person in Country A than in Country B?
A) 660 kilograms
B) 715 kilograms
C) 770 kilograms
D) 550 kilograms
Question
Use the pictograph to answer the question.
-For selected countries, this pictograph shows approximately how many kilograms of seafood are consumed by each person (per capita) annually.
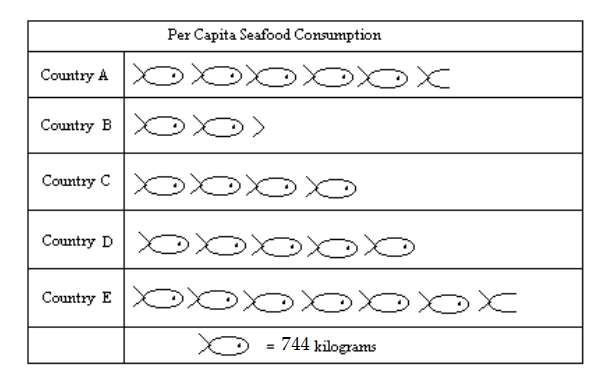
People in Country D eat approximately what percent more seafood than people in Country C?
A)
B)
C)
D)
-For selected countries, this pictograph shows approximately how many kilograms of seafood are consumed by each person (per capita) annually.
People in Country D eat approximately what percent more seafood than people in Country C?
A)
B)
C)
D)
Question
Use the pictograph to answer the question.
-This pictograph shows projected sales of compact disks (CDs) for a popular rock band for seven consecutive years.
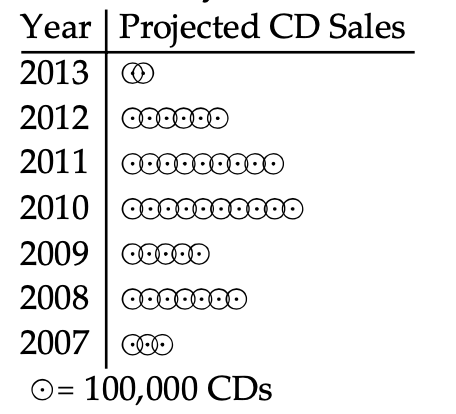
In which year will the greatest number of CDs be sold?
A) Not enough information is given.
B) 2008
C) 2010
D) 2013
-This pictograph shows projected sales of compact disks (CDs) for a popular rock band for seven consecutive years.
In which year will the greatest number of CDs be sold?
A) Not enough information is given.
B) 2008
C) 2010
D) 2013
Question
Use the pictograph to answer the question.
-This pictograph shows projected sales of compact disks (CDs) for a popular rock band for seven consecutive years.
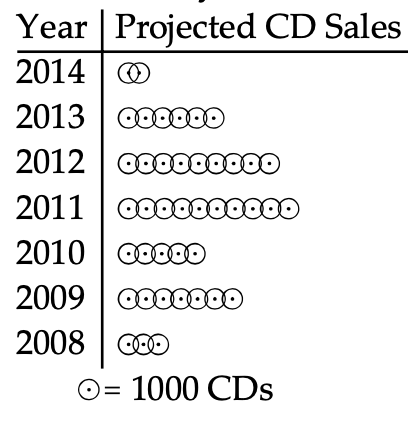
How many sales do symbols represent?
A) 2000
B) 2
C) Not enough information is given.
D) 1000
-This pictograph shows projected sales of compact disks (CDs) for a popular rock band for seven consecutive years.
How many sales do symbols represent?
A) 2000
B) 2
C) Not enough information is given.
D) 1000
Question
Use the pictograph to answer the question.
-This pictograph shows projected sales of compact disks (CDs) for a popular rock band for seven consecutive years.
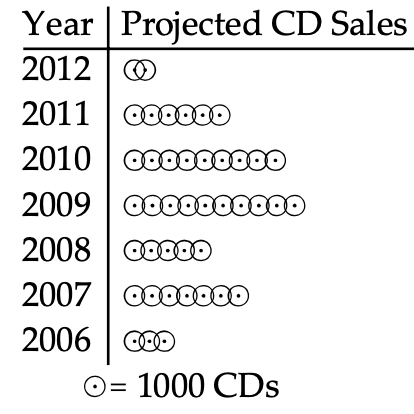
Approximately how many CDs will be sold in 2011?
A)
B)
C)
D)
-This pictograph shows projected sales of compact disks (CDs) for a popular rock band for seven consecutive years.
Approximately how many CDs will be sold in 2011?
A)
B)
C)
D)
Question
Use the pictograph to answer the question.
-This pictograph shows projected sales of compact disks (CDs) for a popular rock band for seven consecutive years.
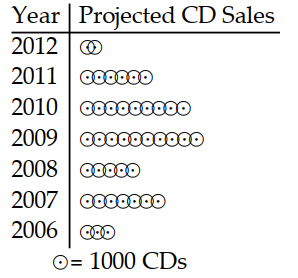
Approximately how many fewer CDs will be sold in 2008 than in 2010?
A)
B) 4 CDs
C)
D)
-This pictograph shows projected sales of compact disks (CDs) for a popular rock band for seven consecutive years.
Approximately how many fewer CDs will be sold in 2008 than in 2010?
A)
B) 4 CDs
C)
D)
Question
Use the pictograph to answer the question.
-This pictograph shows projected sales of compact disks (CDs) for a popular rock band for seven consecutive years.
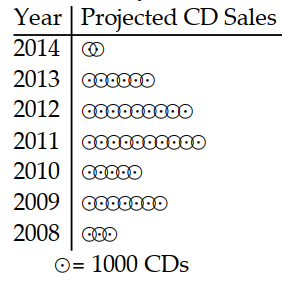
Between which two consecutive years is the greatest decline in sales indicated?
A) Between 2009 and 2010
B) Between 2013 and 2014
C) Between 2012 and 2013
D) Between 2010 and 2011
-This pictograph shows projected sales of compact disks (CDs) for a popular rock band for seven consecutive years.
Between which two consecutive years is the greatest decline in sales indicated?
A) Between 2009 and 2010
B) Between 2013 and 2014
C) Between 2012 and 2013
D) Between 2010 and 2011
Question
Use the circle graph to solve the problem.
-A survey of the 8354 vehicles on the campus of State University yielded the following circle graph.
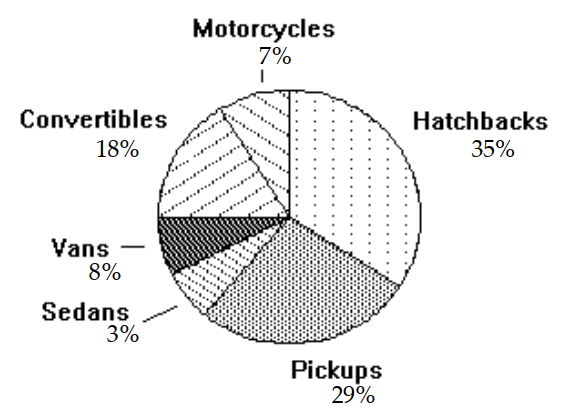
What percent of the vehicles are hatchbacks?
A)
B)
C)
D)
-A survey of the 8354 vehicles on the campus of State University yielded the following circle graph.
What percent of the vehicles are hatchbacks?
A)
B)
C)
D)
Question
Use the circle graph to solve the problem.
-A survey of the 3356 vehicles on the campus of State University yielded the following circle graph.
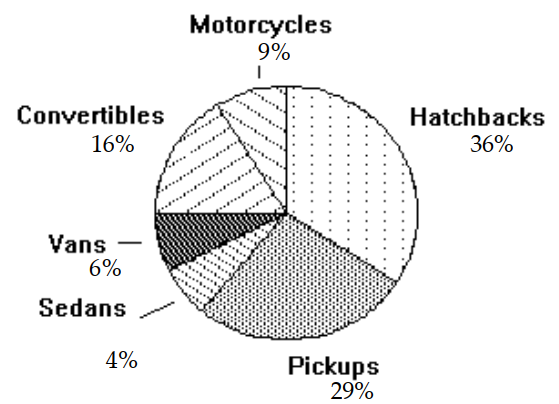
Together, what percent of the vehicles are either vans or convertibles?
A)
B)
C)
D)
-A survey of the 3356 vehicles on the campus of State University yielded the following circle graph.
Together, what percent of the vehicles are either vans or convertibles?
A)
B)
C)
D)
Question
Use the circle graph to solve the problem.
-The circle graph shows the percent of the total population of 19,800 of Springfield living in the given types of housing.
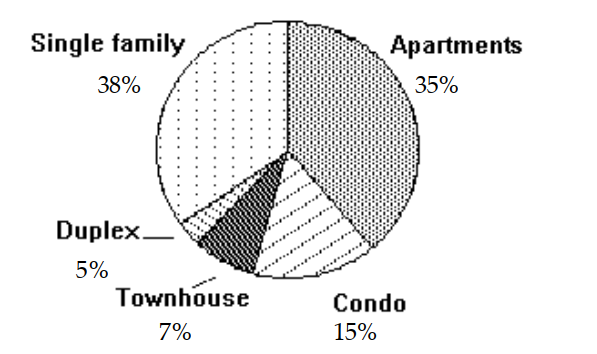
Find the number of people who live in duplexes. Round your result to the nearest whole number.
A) 18,810 people
B) 5 people
C) 990 people
D) 1980 people
-The circle graph shows the percent of the total population of 19,800 of Springfield living in the given types of housing.
Find the number of people who live in duplexes. Round your result to the nearest whole number.
A) 18,810 people
B) 5 people
C) 990 people
D) 1980 people
Question
Use the circle graph to solve the problem.
-There are 18,000 students attending the local university. The circle graph shows the percentage of those students who attend different sporting events.
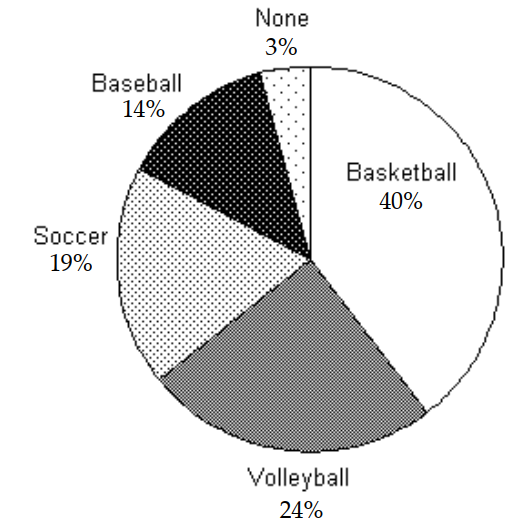
What percentage of students do not attend Soccer or Volleyball matches?
A)
B)
C)
D)
-There are 18,000 students attending the local university. The circle graph shows the percentage of those students who attend different sporting events.
What percentage of students do not attend Soccer or Volleyball matches?
A)
B)
C)
D)
Question
Use the circle graph to solve the problem.
-There are 6000 students attending the local university. The circle graph shows the percentage of those students who attend different sporting events.
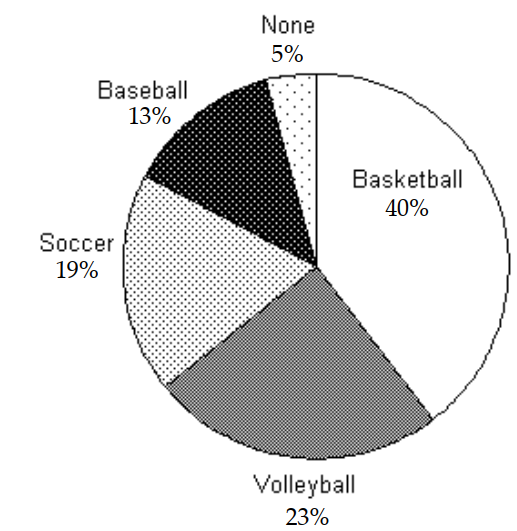
How many students attend Basketball and Baseball games?
A) 3180 students
B) 2400 students
C) 318,000 students
D) 780 students
-There are 6000 students attending the local university. The circle graph shows the percentage of those students who attend different sporting events.
How many students attend Basketball and Baseball games?
A) 3180 students
B) 2400 students
C) 318,000 students
D) 780 students
Question
Use the circle graph to solve the problem.
-The circle graph below gives the inventory of the women's department of a store.
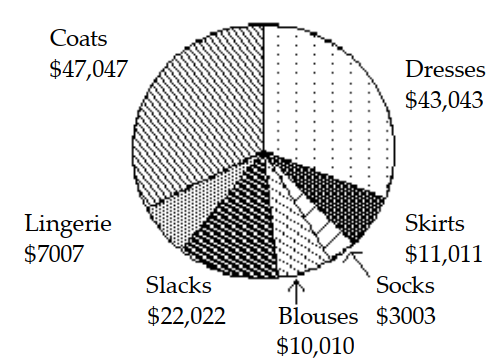
What is the total inventory?
A)
B)
C)
D)
-The circle graph below gives the inventory of the women's department of a store.
What is the total inventory?
A)
B)
C)
D)
Question
Use the circle graph to solve the problem.
-of apparel does the store have the smallest investment?
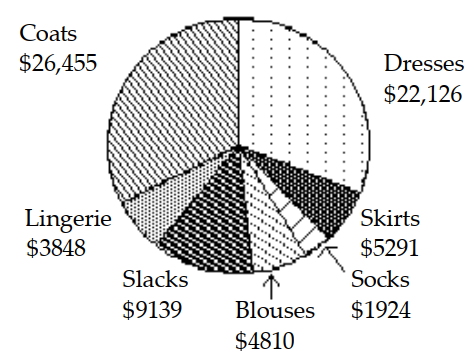
A) Socks
B) Lingerie
C) Coats
D) Skirts
-of apparel does the store have the smallest investment?
A) Socks
B) Lingerie
C) Coats
D) Skirts
Question
Use the circle graph to solve the problem.
-The circle graph below gives the number of students in the residence halls at the state university.
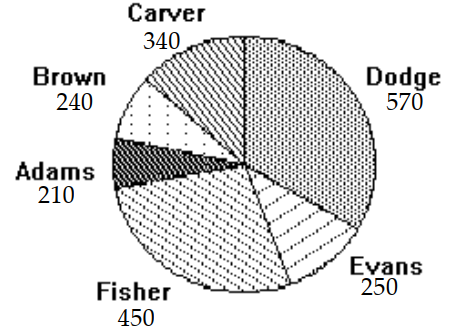
Which residence hall has the third highest number of students?
A) Carver
B) Dodge
C) Adams
D) Fisher
-The circle graph below gives the number of students in the residence halls at the state university.
Which residence hall has the third highest number of students?
A) Carver
B) Dodge
C) Adams
D) Fisher
Question
Use the circle graph to solve the problem.
-The circle graph below gives the number of residents in the residence halls at the state university.
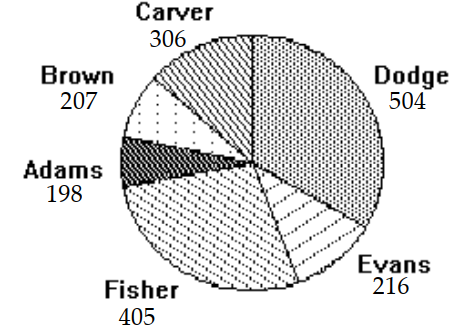
Write the ratio as a fraction in lowest terms of the number of residents at Fisher to the number of students at Brown.
A)
B)
C)
D)
-The circle graph below gives the number of residents in the residence halls at the state university.
Write the ratio as a fraction in lowest terms of the number of residents at Fisher to the number of students at Brown.
A)
B)
C)
D)
Question
The bar graph below shows the number of students by major in the College of Arts and Sciences. Answer the question.
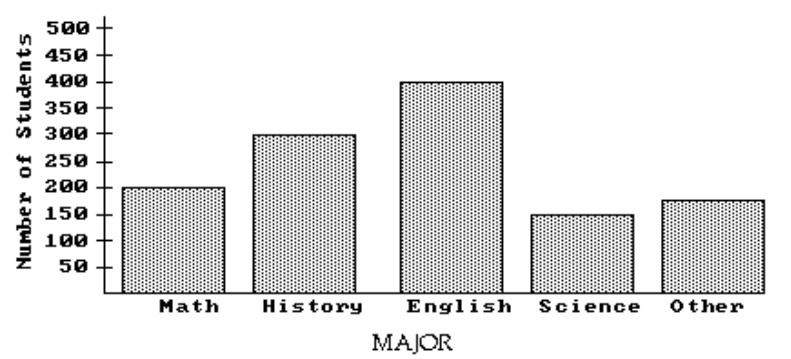
-How many students are majoring in Math?
A) 250
B) 150
C) 200
D) 300
-How many students are majoring in Math?
A) 250
B) 150
C) 200
D) 300
Question
The bar graph below shows the number of students by major in the College of Arts and Sciences. Answer the question.
-About how many students are in the College of Arts and Sciences?
A) 1100
B) 1225
C) 1050
D) 1325
-About how many students are in the College of Arts and Sciences?
A) 1100
B) 1225
C) 1050
D) 1325
Question
The bar graph below shows the number of students by major in the College of Arts and Sciences. Answer the question.
-Which major has the largest number of students?
A) Math
B) Science
C) History
D) English
-Which major has the largest number of students?
A) Math
B) Science
C) History
D) English
Question
The bar graph below shows the number of students by major in the College of Arts and Sciences. Answer the question.
-Which major has about 150 students?
A) English
B) History
C) Science
D) Math
-Which major has about 150 students?
A) English
B) History
C) Science
D) Math
Question
The bar graph below shows the number of students by major in the College of Arts and Sciences. Answer the question.
-How many more students are majoring in math than in science?
A) 10
B) 150
C) 100
D) 50
-How many more students are majoring in math than in science?
A) 10
B) 150
C) 100
D) 50
Question
The bar graph below shows the number of students by major in the College of Arts and Sciences. Answer the question.
-What is the average number of students taking Science, English, and Math? Round your answer to the nearest whole student if necessary.
A) 317 students
B) 250 students
C) 850 students
D) 188 students
-What is the average number of students taking Science, English, and Math? Round your answer to the nearest whole student if necessary.
A) 317 students
B) 250 students
C) 850 students
D) 188 students
Question
The bar graph below shows the number of students by major in the College of Arts and Sciences. Answer the question.
-What is the median number of students taking History, Science, and Math?
A) 300 students
B) 150 students
C) 400 students
D) 200 students
-What is the median number of students taking History, Science, and Math?
A) 300 students
B) 150 students
C) 400 students
D) 200 students
Question
The bar graph below shows the number of students by major in the College of Arts and Sciences. Answer the question.
-The science department spends about on equipment for each student majoring in science. How much should the science department budget for equipment?
A)
B)
C)
D)
-The science department spends about on equipment for each student majoring in science. How much should the science department budget for equipment?
A)
B)
C)
D)
Question
The bar graph below shows the number of students by major in the College of Arts and Sciences. Answer the question.
-The English department assigns a counselor to each student majoring in English. Each counselor is assigned 20 students. How many counselors are needed?
A) 24
B) 27
C) 22
D) 20
-The English department assigns a counselor to each student majoring in English. Each counselor is assigned 20 students. How many counselors are needed?
A) 24
B) 27
C) 22
D) 20
Question
The bar graph below shows the number of students by major in the College of Arts and Sciences. Answer the question.
-The science department is planning to buy some new equipment. They want to make sure that there is one of the new machines for every 5 students majoring in science. If each machine costs 450 , how much should they budget for the new equipment?
A)
B)
C)
D)
-The science department is planning to buy some new equipment. They want to make sure that there is one of the new machines for every 5 students majoring in science. If each machine costs 450 , how much should they budget for the new equipment?
A)
B)
C)
D)
Question
Refer to the double-bar graph below which shows the number of male and female athletes at a university over a four-year period. Solve the problem.
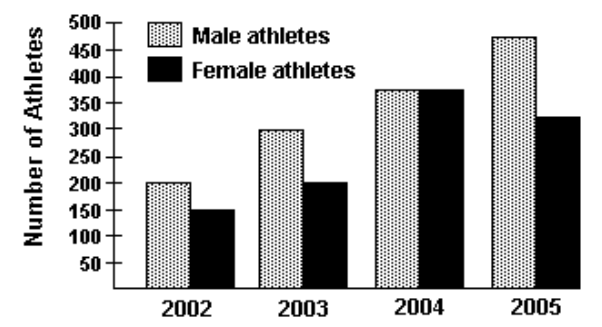
-Which year had the greatest number of female athletes? What was the total number of male athletes that year?
A) athletes
B) athletes
C) athletes
D) athletes
-Which year had the greatest number of female athletes? What was the total number of male athletes that year?
A) athletes
B) athletes
C) athletes
D) athletes
Question
Refer to the double-bar graph below which shows the number of male and female athletes at a university over a four-year period. Solve the problem.
-Find the increase in the number of female athletes from 2003 to 2004.
A) 175
B) 125
C) 375
D) 150
-Find the increase in the number of female athletes from 2003 to 2004.
A) 175
B) 125
C) 375
D) 150
Question
Refer to the double-bar graph below which shows the number of male and female athletes at a university over a four-year period. Solve the problem.
-Find the increase in the number of male athletes from 2004 to 2005.
A) 75
B) 475
C) 100
D) 50
-Find the increase in the number of male athletes from 2004 to 2005.
A) 75
B) 475
C) 100
D) 50
Question
Refer to the double-bar graph below which shows the number of male and female athletes at a university over a four-year period. Solve the problem.
-What was the percent of decrease in the number of female athletes from 2004 to 2005 ?
A)
B)
C)
D)
-What was the percent of decrease in the number of female athletes from 2004 to 2005 ?
A)
B)
C)
D)
Question
Refer to the double-bar graph below which shows the number of male and female athletes at a university over a four-year period. Solve the problem.
-What was the percent of increase in the number of male athletes from 2002 to 2003 ?
A)
B)
C)
D)
-What was the percent of increase in the number of male athletes from 2002 to 2003 ?
A)
B)
C)
D)
Question
Refer to the double-bar graph below which shows the number of male and female athletes at a university over a four-year period. Solve the problem.
-Which year had the same number of male and female athletes?
A) 2002
B) 2005
C) 2003
D) 2004
-Which year had the same number of male and female athletes?
A) 2002
B) 2005
C) 2003
D) 2004
Question
Refer to the double-bar graph below which shows the number of male and female athletes at a university over a four-year period. Solve the problem.
-In which year did the greatest difference between the number of male athlete and female athletes occur? Find the difference.
A) athletes
B) athletes
C) athletes
D) athletes
-In which year did the greatest difference between the number of male athlete and female athletes occur? Find the difference.
A) athletes
B) athletes
C) athletes
D) athletes
Question
Refer to the double-bar graph below which shows the number of male and female athletes at a university over a four-year period. Solve the problem.
-How many students were involved in athletics in 2003 ?
A) 400
B) 600
C) 500
D) 300
-How many students were involved in athletics in 2003 ?
A) 400
B) 600
C) 500
D) 300
Question
Refer to the double-bar graph below which shows the number of male and female athletes at a university over a four-year period. Solve the problem.
-Find the increase in the number of female athletes from 2003 to 2005.
A) 125
B) 225
C) 150
D) 175
-Find the increase in the number of female athletes from 2003 to 2005.
A) 125
B) 225
C) 150
D) 175
Question
Refer to the double-bar graph below which shows the number of male and female athletes at a university over a four-year period. Solve the problem.
-Find the increase in the number of male athletes from 2002 to 2004.
A) 175
B) 150
C) 275
D) 125
-Find the increase in the number of male athletes from 2002 to 2004.
A) 175
B) 150
C) 275
D) 125
Question
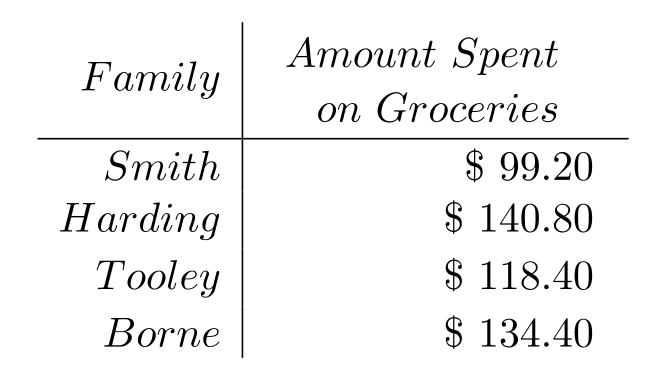
Construct a bar graph to represent the given data.
-The following table shows the average amount spent per week on groceries by four different families with three members.
-The following table shows the average amount spent per week on groceries by four different families with three members.
Question
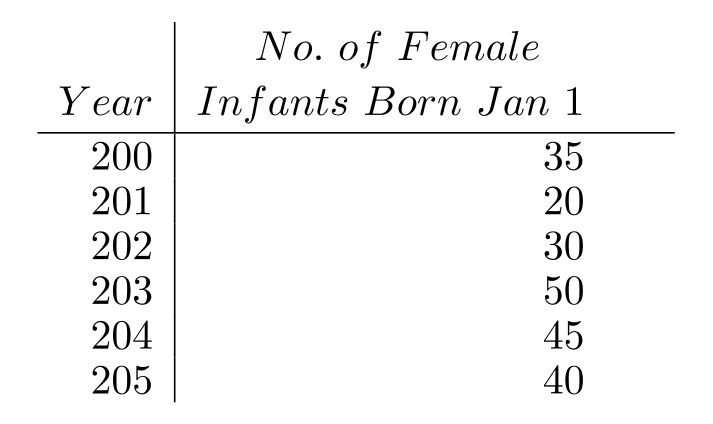
Construct a bar graph to represent the given data.
-The following table shows the number of female infants born at Hospital X on New Year's Day (Jan. 1).
-The following table shows the number of female infants born at Hospital X on New Year's Day (Jan. 1).
Question
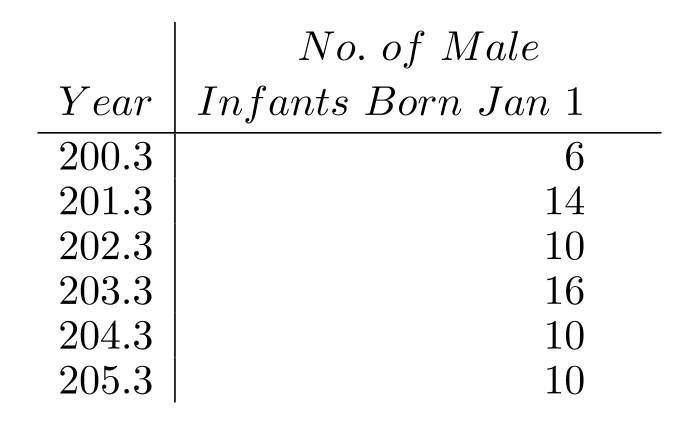
Construct a bar graph to represent the given data.
-The following table shows the number of male infants born at Hospital on New Year's Day (Jan. 1).
-The following table shows the number of male infants born at Hospital on New Year's Day (Jan. 1).
Question
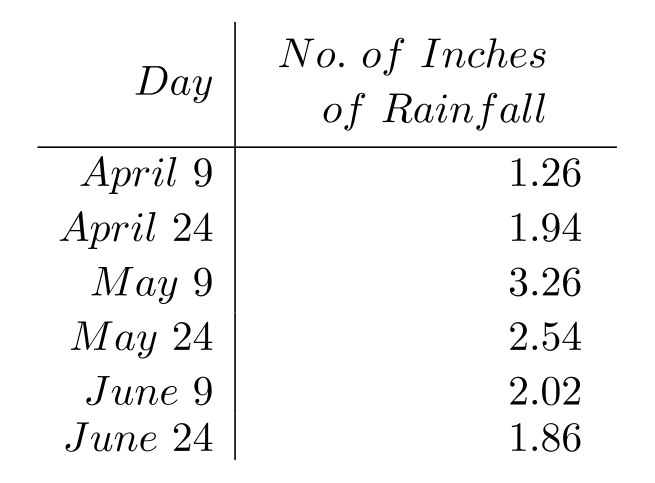
Construct a bar graph to represent the given data.
-The following table shows the number of inches of rainfall measured at City during the following days.
-The following table shows the number of inches of rainfall measured at City during the following days.
Question
Construct a bar graph to represent the given data.
-The following table shows the average number of grams of fat in various kinds of entrees served at Karma Kitchen.
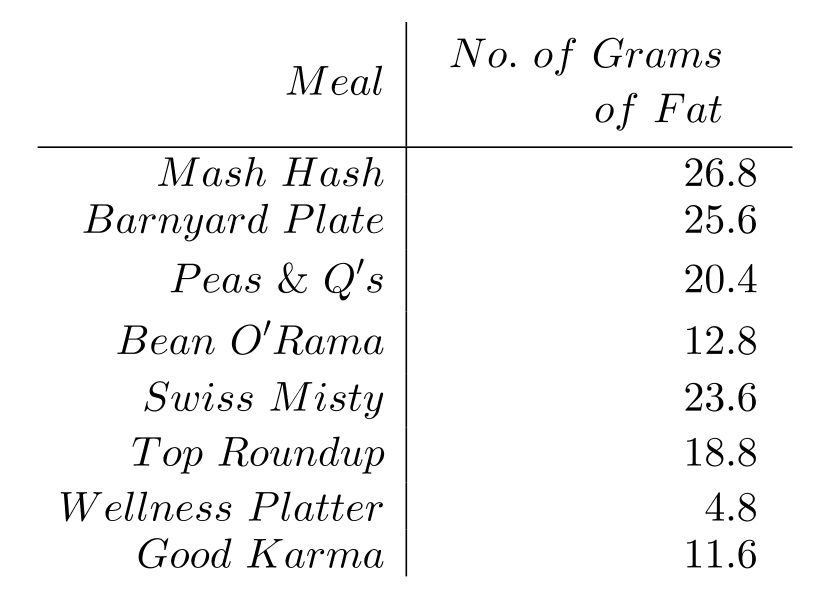
-The following table shows the average number of grams of fat in various kinds of entrees served at Karma Kitchen.
Question
Use the graph to answer the question.
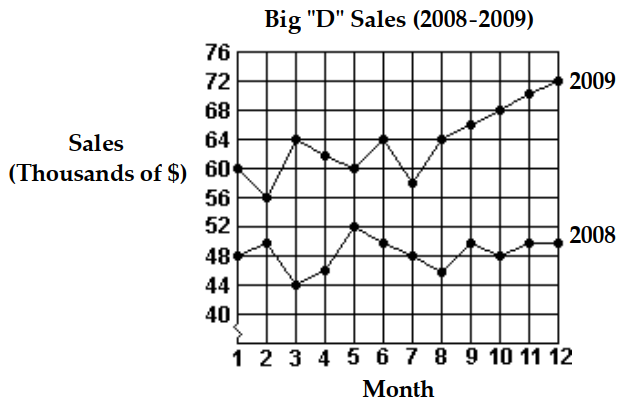
-Which month in 2008 had the lowest sales?
A) Month 3
B) Month 6
C) Month 2
D) Month 8
-Which month in 2008 had the lowest sales?
A) Month 3
B) Month 6
C) Month 2
D) Month 8
Question
Use the graph to answer the question.
-Which month in 2009 had the highest sales?
A) Month 3
B) Month 6
C) Month 12
D) Month 5
-Which month in 2009 had the highest sales?
A) Month 3
B) Month 6
C) Month 12
D) Month 5
Question
Use the graph to answer the question.
-What was the increase in sales between month 5 and month 6 of 2009?
A)
B)
C)
D)
-What was the increase in sales between month 5 and month 6 of 2009?
A)
B)
C)
D)
Question
Use the graph to answer the question.
-What were the total sales for the first 6 months of 2008?
A)
B)
C)
D)
-What were the total sales for the first 6 months of 2008?
A)
B)
C)
D)
Question
Use the graph to answer the question.
-What were the total sales for the first 6 months of 2009?
A)
B)
C)
D)
-What were the total sales for the first 6 months of 2009?
A)
B)
C)
D)
Question
Use the graph to answer the question.
-What were the total sales for 2008?
A)
B)
C)
D)
-What were the total sales for 2008?
A)
B)
C)
D)
Question
Use the graph to answer the question.
-What was the total increase in sales for the first 6 months from 2008 to 2009?
A)
B)
C)
D)
-What was the total increase in sales for the first 6 months from 2008 to 2009?
A)
B)
C)
D)
Question
Use the graph to answer the question.
-What was the total increase in sales from 2008 to 2009?
A)
B)
C)
D)
-What was the total increase in sales from 2008 to 2009?
A)
B)
C)
D)
Question
Use the graph to answer the question.
-What was the difference between the highest and lowest monthly sales in 2008?
A)
B)
C)
D)
-What was the difference between the highest and lowest monthly sales in 2008?
A)
B)
C)
D)
Question
Use the graph to answer the question.
-What was the percent of increase in sales between month 2 and month 12 of 2009 ? Round your answer to the nearest tenth.
A)
B)
C)
D)
\section*{SHORT ANSWER. Write the word or phrase that best completes each statement or answers the question.}
Make a line graph of the data in the table.
-What was the percent of increase in sales between month 2 and month 12 of 2009 ? Round your answer to the nearest tenth.
A)
B)
C)
D)
\section*{SHORT ANSWER. Write the word or phrase that best completes each statement or answers the question.}
Make a line graph of the data in the table.
Question
Make a line graph of the data in the table.
-The following table shows the average tuition for one semester at City X College over various years. Use time on the horizontal scale for your line graph.
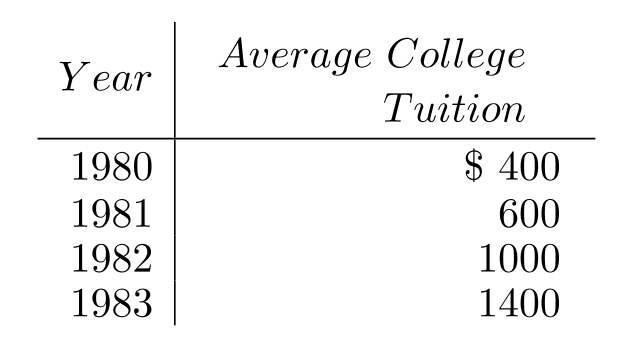
-The following table shows the average tuition for one semester at City X College over various years. Use time on the horizontal scale for your line graph.
Question
Make a line graph of the data in the table.
-The following table shows the number of computer sales made at Computer Buy over five months. Use time on the horizontal scale for your line graph.
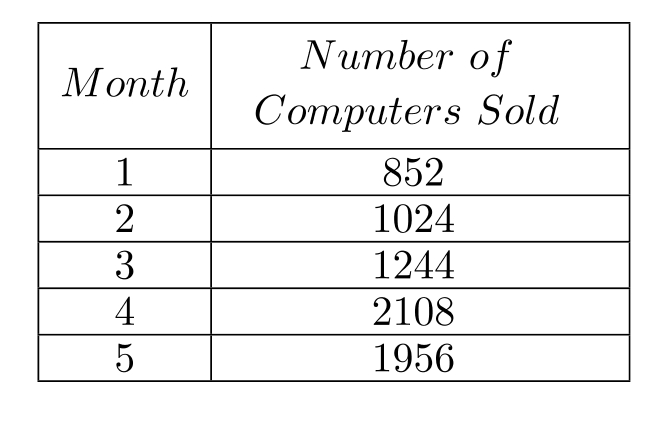
-The following table shows the number of computer sales made at Computer Buy over five months. Use time on the horizontal scale for your line graph.
Question
Make a line graph of the data in the table.
-The following table shows the median teacher's salary in District over several years. Use time on the horizontal scale for your line graph.
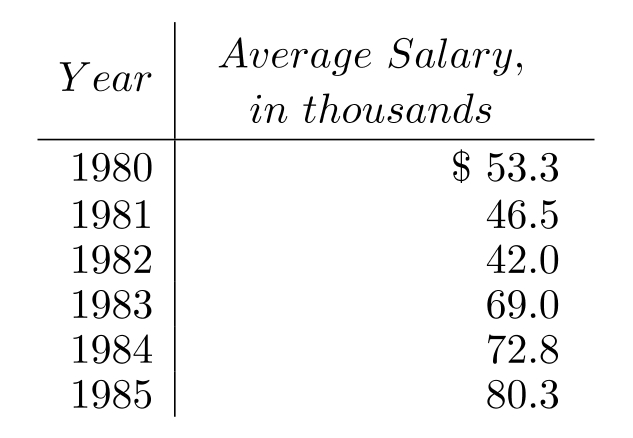
-The following table shows the median teacher's salary in District over several years. Use time on the horizontal scale for your line graph.
Question
Make a line graph of the data in the table.
-The following table gives the average cost of producing a music video over the given years. Use time on the horizontal scale for your line graph.
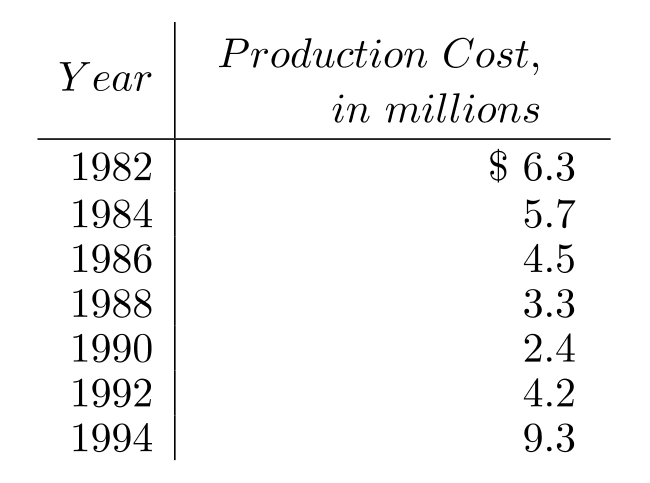
-The following table gives the average cost of producing a music video over the given years. Use time on the horizontal scale for your line graph.
Question
Make a line graph of the data in the table.
-The following table gives the total amount of precipitation during the given months. Use time on the horizontal scale for your line graph.
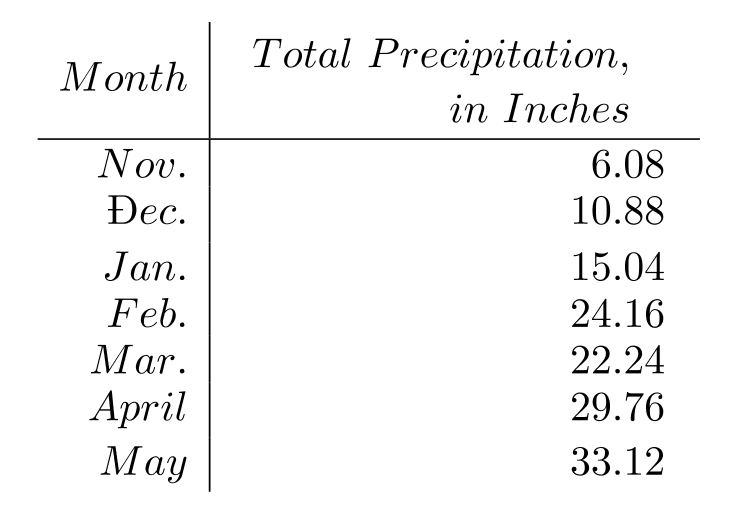
-The following table gives the total amount of precipitation during the given months. Use time on the horizontal scale for your line graph.
Question
Question
Question
Question
Question
Question
Question
Question
Question
Question
Question
Question

Unlock Deck
Sign up to unlock the cards in this deck!
Unlock Deck
Unlock Deck
1/157
Play
Full screen (f)
Deck 5: Data, Graphs, and Statistics
1
The following table contains information about moons orbiting a planet named Geo I. Use the table to solve the problem.
-
Find the average distance from Geo I to its moon Luna 1.
A)
B)
C)
D)
-
Find the average distance from Geo I to its moon Luna 1.
A)
B)
C)
D)
2
The following table contains information about moons orbiting a planet named Geo I. Use the table to solve the problem.
- What is the time of revolution around Geo 1 of the moon Luna 4?
A) 724 years
B) 0.77 years
C) 29.22 years
D) 75.24 years
-
What is the time of revolution around Geo 1 of the moon Luna 4?A) 724 years
B) 0.77 years
C) 29.22 years
D) 75.24 years
29.22 years
3
The following table contains information about moons orbiting a planet named Geo I. Use the table to solve the problem.
-
Which moon has a diameter of 312 kilometers?
A) Luna 3
B) Luna 1
C) Luna 2
D) Luna 4
-
Which moon has a diameter of 312 kilometers?
A) Luna 3
B) Luna 1
C) Luna 2
D) Luna 4
Luna 3
4
The following table contains information about moons orbiting a planet named Geo I. Use the table to solve the problem.
- Which moons have average distance from Geo I less than ten thousand kilometers?
A) Luna 3, Luna 4, and Luna 5
B) None
C) Luna 1 and Luna 2
D) Luna 1 only
-
Which moons have average distance from Geo I less than ten thousand kilometers?A) Luna 3, Luna 4, and Luna 5
B) None
C) Luna 1 and Luna 2
D) Luna 1 only
Unlock Deck
Unlock for access to all 157 flashcards in this deck.
Unlock Deck
k this deck
5
The following table contains information about moons orbiting a planet named Geo I. Use the table to solve the problem.
- How much further from Geo I is Luna 4 than Luna 2?
A)
B)
C)
D)
-
How much further from Geo I is Luna 4 than Luna 2?A)
B)
C)
D)
Unlock Deck
Unlock for access to all 157 flashcards in this deck.
Unlock Deck
k this deck
6
The following table contains information about moons orbiting a planet named Geo I. Use the table to solve the problem.
- About how many Luna 3 diameters would it take to get one Luna 2 diameter?
A) 1870
B) 3
C) 7
D) 0.14
-
About how many Luna 3 diameters would it take to get one Luna 2 diameter?A) 1870
B) 3
C) 7
D) 0.14
Unlock Deck
Unlock for access to all 157 flashcards in this deck.
Unlock Deck
k this deck
7
The following table contains information about moons orbiting a planet named Geo I. Use the table to solve the problem.
- What is the median of the average distance from Geo 1 of the moons?
A)
B)
C)
D)
-
What is the median of the average distance from Geo 1 of the moons?A)
B)
C)
D)
Unlock Deck
Unlock for access to all 157 flashcards in this deck.
Unlock Deck
k this deck
8
The following table contains information about moons orbiting a planet named Geo I. Use the table to solve the problem.
- What is the average time of revolution of the moons?
A) 2.31 years
B) 4.08 years
C) 25.80 years
D) 954.80 years
-
What is the average time of revolution of the moons?A) 2.31 years
B) 4.08 years
C) 25.80 years
D) 954.80 years
Unlock Deck
Unlock for access to all 157 flashcards in this deck.
Unlock Deck
k this deck
9
The following table contains information about moons orbiting a planet named Geo I. Use the table to solve the problem.
- What is the average of the diameters of the moons?
A)
B)
C)
D)
-
What is the average of the diameters of the moons?A)
B)
C)
D)
Unlock Deck
Unlock for access to all 157 flashcards in this deck.
Unlock Deck
k this deck
10
The following table contains information about moons orbiting a planet named Geo I. Use the table to solve the problem.
- What is the mode of the diameters of the moons?
A)
B)
C)
D) No mode exists
-
What is the mode of the diameters of the moons?A)
B)
C)
D) No mode exists
Unlock Deck
Unlock for access to all 157 flashcards in this deck.
Unlock Deck
k this deck
11
Use the pictograph to answer the question.
-For selected countries, this pictograph shows approximately how many kilograms of seafood are consumed by each person (per capita) annually.
Which country consumes the most seafood?
A) Country A
B) Country E
C) Country B
D) Country C
-For selected countries, this pictograph shows approximately how many kilograms of seafood are consumed by each person (per capita) annually.
Which country consumes the most seafood?
A) Country A
B) Country E
C) Country B
D) Country C
Unlock Deck
Unlock for access to all 157 flashcards in this deck.
Unlock Deck
k this deck
12
Use the pictograph to answer the question.
-For selected countries, this pictograph shows approximately how many kilograms of seafood are consumed by each person (per capita) annually.
What is the approximate seafood consumption in Country E?
A) 900 kilograms
B) 972 kilograms
C) 864 kilograms
D) 1008 kilograms
-For selected countries, this pictograph shows approximately how many kilograms of seafood are consumed by each person (per capita) annually.
What is the approximate seafood consumption in Country E?
A) 900 kilograms
B) 972 kilograms
C) 864 kilograms
D) 1008 kilograms
Unlock Deck
Unlock for access to all 157 flashcards in this deck.
Unlock Deck
k this deck
13
Use the pictograph to answer the question.
-For selected countries, this pictograph shows approximately how many kilograms of seafood are consumed by each person (per capita) annually.
Approximately how many more kilograms of seafood is eaten per person in Country A than in Country B?
A) 660 kilograms
B) 715 kilograms
C) 770 kilograms
D) 550 kilograms
Unlock Deck
Unlock for access to all 157 flashcards in this deck.
Unlock Deck
k this deck
14
Use the pictograph to answer the question.
-For selected countries, this pictograph shows approximately how many kilograms of seafood are consumed by each person (per capita) annually.
People in Country D eat approximately what percent more seafood than people in Country C?
A)
B)
C)
D)
-For selected countries, this pictograph shows approximately how many kilograms of seafood are consumed by each person (per capita) annually.
People in Country D eat approximately what percent more seafood than people in Country C?
A)
B)
C)
D)
Unlock Deck
Unlock for access to all 157 flashcards in this deck.
Unlock Deck
k this deck
15
Use the pictograph to answer the question.
-This pictograph shows projected sales of compact disks (CDs) for a popular rock band for seven consecutive years.
In which year will the greatest number of CDs be sold?
A) Not enough information is given.
B) 2008
C) 2010
D) 2013
-This pictograph shows projected sales of compact disks (CDs) for a popular rock band for seven consecutive years.
In which year will the greatest number of CDs be sold?
A) Not enough information is given.
B) 2008
C) 2010
D) 2013
Unlock Deck
Unlock for access to all 157 flashcards in this deck.
Unlock Deck
k this deck
16
Use the pictograph to answer the question.
-This pictograph shows projected sales of compact disks (CDs) for a popular rock band for seven consecutive years.
How many sales do symbols represent?
A) 2000
B) 2
C) Not enough information is given.
D) 1000
-This pictograph shows projected sales of compact disks (CDs) for a popular rock band for seven consecutive years.
How many sales do symbols represent?
A) 2000
B) 2
C) Not enough information is given.
D) 1000
Unlock Deck
Unlock for access to all 157 flashcards in this deck.
Unlock Deck
k this deck
17
Use the pictograph to answer the question.
-This pictograph shows projected sales of compact disks (CDs) for a popular rock band for seven consecutive years.
Approximately how many CDs will be sold in 2011?
A)
B)
C)
D)
-This pictograph shows projected sales of compact disks (CDs) for a popular rock band for seven consecutive years.
Approximately how many CDs will be sold in 2011?
A)
B)
C)
D)
Unlock Deck
Unlock for access to all 157 flashcards in this deck.
Unlock Deck
k this deck
18
Use the pictograph to answer the question.
-This pictograph shows projected sales of compact disks (CDs) for a popular rock band for seven consecutive years.
Approximately how many fewer CDs will be sold in 2008 than in 2010?
A)
B) 4 CDs
C)
D)
-This pictograph shows projected sales of compact disks (CDs) for a popular rock band for seven consecutive years.
Approximately how many fewer CDs will be sold in 2008 than in 2010?
A)
B) 4 CDs
C)
D)
Unlock Deck
Unlock for access to all 157 flashcards in this deck.
Unlock Deck
k this deck
19
Use the pictograph to answer the question.
-This pictograph shows projected sales of compact disks (CDs) for a popular rock band for seven consecutive years.
Between which two consecutive years is the greatest decline in sales indicated?
A) Between 2009 and 2010
B) Between 2013 and 2014
C) Between 2012 and 2013
D) Between 2010 and 2011
-This pictograph shows projected sales of compact disks (CDs) for a popular rock band for seven consecutive years.
Between which two consecutive years is the greatest decline in sales indicated?
A) Between 2009 and 2010
B) Between 2013 and 2014
C) Between 2012 and 2013
D) Between 2010 and 2011
Unlock Deck
Unlock for access to all 157 flashcards in this deck.
Unlock Deck
k this deck
20
Use the circle graph to solve the problem.
-A survey of the 8354 vehicles on the campus of State University yielded the following circle graph.
What percent of the vehicles are hatchbacks?
A)
B)
C)
D)
-A survey of the 8354 vehicles on the campus of State University yielded the following circle graph.
What percent of the vehicles are hatchbacks?
A)
B)
C)
D)
Unlock Deck
Unlock for access to all 157 flashcards in this deck.
Unlock Deck
k this deck
21
Use the circle graph to solve the problem.
-A survey of the 3356 vehicles on the campus of State University yielded the following circle graph.
Together, what percent of the vehicles are either vans or convertibles?
A)
B)
C)
D)
-A survey of the 3356 vehicles on the campus of State University yielded the following circle graph.
Together, what percent of the vehicles are either vans or convertibles?
A)
B)
C)
D)
Unlock Deck
Unlock for access to all 157 flashcards in this deck.
Unlock Deck
k this deck
22
Use the circle graph to solve the problem.
-The circle graph shows the percent of the total population of 19,800 of Springfield living in the given types of housing.
Find the number of people who live in duplexes. Round your result to the nearest whole number.
A) 18,810 people
B) 5 people
C) 990 people
D) 1980 people
-The circle graph shows the percent of the total population of 19,800 of Springfield living in the given types of housing.
Find the number of people who live in duplexes. Round your result to the nearest whole number.
A) 18,810 people
B) 5 people
C) 990 people
D) 1980 people
Unlock Deck
Unlock for access to all 157 flashcards in this deck.
Unlock Deck
k this deck
23
Use the circle graph to solve the problem.
-There are 18,000 students attending the local university. The circle graph shows the percentage of those students who attend different sporting events.
What percentage of students do not attend Soccer or Volleyball matches?
A)
B)
C)
D)
-There are 18,000 students attending the local university. The circle graph shows the percentage of those students who attend different sporting events.
What percentage of students do not attend Soccer or Volleyball matches?
A)
B)
C)
D)
Unlock Deck
Unlock for access to all 157 flashcards in this deck.
Unlock Deck
k this deck
24
Use the circle graph to solve the problem.
-There are 6000 students attending the local university. The circle graph shows the percentage of those students who attend different sporting events.
How many students attend Basketball and Baseball games?
A) 3180 students
B) 2400 students
C) 318,000 students
D) 780 students
-There are 6000 students attending the local university. The circle graph shows the percentage of those students who attend different sporting events.
How many students attend Basketball and Baseball games?
A) 3180 students
B) 2400 students
C) 318,000 students
D) 780 students
Unlock Deck
Unlock for access to all 157 flashcards in this deck.
Unlock Deck
k this deck
25
Use the circle graph to solve the problem.
-The circle graph below gives the inventory of the women's department of a store.
What is the total inventory?
A)
B)
C)
D)
-The circle graph below gives the inventory of the women's department of a store.
What is the total inventory?
A)
B)
C)
D)
Unlock Deck
Unlock for access to all 157 flashcards in this deck.
Unlock Deck
k this deck
26
Use the circle graph to solve the problem.
-of apparel does the store have the smallest investment?
A) Socks
B) Lingerie
C) Coats
D) Skirts
-of apparel does the store have the smallest investment?
A) Socks
B) Lingerie
C) Coats
D) Skirts
Unlock Deck
Unlock for access to all 157 flashcards in this deck.
Unlock Deck
k this deck
27
Use the circle graph to solve the problem.
-The circle graph below gives the number of students in the residence halls at the state university.
Which residence hall has the third highest number of students?
A) Carver
B) Dodge
C) Adams
D) Fisher
-The circle graph below gives the number of students in the residence halls at the state university.
Which residence hall has the third highest number of students?
A) Carver
B) Dodge
C) Adams
D) Fisher
Unlock Deck
Unlock for access to all 157 flashcards in this deck.
Unlock Deck
k this deck
28
Use the circle graph to solve the problem.
-The circle graph below gives the number of residents in the residence halls at the state university.
Write the ratio as a fraction in lowest terms of the number of residents at Fisher to the number of students at Brown.
A)
B)
C)
D)
-The circle graph below gives the number of residents in the residence halls at the state university.
Write the ratio as a fraction in lowest terms of the number of residents at Fisher to the number of students at Brown.
A)
B)
C)
D)
Unlock Deck
Unlock for access to all 157 flashcards in this deck.
Unlock Deck
k this deck
29
The bar graph below shows the number of students by major in the College of Arts and Sciences. Answer the question.
-How many students are majoring in Math?
A) 250
B) 150
C) 200
D) 300
-How many students are majoring in Math?
A) 250
B) 150
C) 200
D) 300
Unlock Deck
Unlock for access to all 157 flashcards in this deck.
Unlock Deck
k this deck
30
The bar graph below shows the number of students by major in the College of Arts and Sciences. Answer the question.
-About how many students are in the College of Arts and Sciences?
A) 1100
B) 1225
C) 1050
D) 1325
-About how many students are in the College of Arts and Sciences?
A) 1100
B) 1225
C) 1050
D) 1325
Unlock Deck
Unlock for access to all 157 flashcards in this deck.
Unlock Deck
k this deck
31
The bar graph below shows the number of students by major in the College of Arts and Sciences. Answer the question.
-Which major has the largest number of students?
A) Math
B) Science
C) History
D) English
-Which major has the largest number of students?
A) Math
B) Science
C) History
D) English
Unlock Deck
Unlock for access to all 157 flashcards in this deck.
Unlock Deck
k this deck
32
The bar graph below shows the number of students by major in the College of Arts and Sciences. Answer the question.
-Which major has about 150 students?
A) English
B) History
C) Science
D) Math
-Which major has about 150 students?
A) English
B) History
C) Science
D) Math
Unlock Deck
Unlock for access to all 157 flashcards in this deck.
Unlock Deck
k this deck
33
The bar graph below shows the number of students by major in the College of Arts and Sciences. Answer the question.
-How many more students are majoring in math than in science?
A) 10
B) 150
C) 100
D) 50
-How many more students are majoring in math than in science?
A) 10
B) 150
C) 100
D) 50
Unlock Deck
Unlock for access to all 157 flashcards in this deck.
Unlock Deck
k this deck
34
The bar graph below shows the number of students by major in the College of Arts and Sciences. Answer the question.
-What is the average number of students taking Science, English, and Math? Round your answer to the nearest whole student if necessary.
A) 317 students
B) 250 students
C) 850 students
D) 188 students
-What is the average number of students taking Science, English, and Math? Round your answer to the nearest whole student if necessary.
A) 317 students
B) 250 students
C) 850 students
D) 188 students
Unlock Deck
Unlock for access to all 157 flashcards in this deck.
Unlock Deck
k this deck
35
The bar graph below shows the number of students by major in the College of Arts and Sciences. Answer the question.
-What is the median number of students taking History, Science, and Math?
A) 300 students
B) 150 students
C) 400 students
D) 200 students
-What is the median number of students taking History, Science, and Math?
A) 300 students
B) 150 students
C) 400 students
D) 200 students
Unlock Deck
Unlock for access to all 157 flashcards in this deck.
Unlock Deck
k this deck
36
The bar graph below shows the number of students by major in the College of Arts and Sciences. Answer the question.
-The science department spends about on equipment for each student majoring in science. How much should the science department budget for equipment?
A)
B)
C)
D)
-The science department spends about on equipment for each student majoring in science. How much should the science department budget for equipment?
A)
B)
C)
D)
Unlock Deck
Unlock for access to all 157 flashcards in this deck.
Unlock Deck
k this deck
37
The bar graph below shows the number of students by major in the College of Arts and Sciences. Answer the question.
-The English department assigns a counselor to each student majoring in English. Each counselor is assigned 20 students. How many counselors are needed?
A) 24
B) 27
C) 22
D) 20
-The English department assigns a counselor to each student majoring in English. Each counselor is assigned 20 students. How many counselors are needed?
A) 24
B) 27
C) 22
D) 20
Unlock Deck
Unlock for access to all 157 flashcards in this deck.
Unlock Deck
k this deck
38
The bar graph below shows the number of students by major in the College of Arts and Sciences. Answer the question.
-The science department is planning to buy some new equipment. They want to make sure that there is one of the new machines for every 5 students majoring in science. If each machine costs 450 , how much should they budget for the new equipment?
A)
B)
C)
D)
-The science department is planning to buy some new equipment. They want to make sure that there is one of the new machines for every 5 students majoring in science. If each machine costs 450 , how much should they budget for the new equipment?
A)
B)
C)
D)
Unlock Deck
Unlock for access to all 157 flashcards in this deck.
Unlock Deck
k this deck
39
Refer to the double-bar graph below which shows the number of male and female athletes at a university over a four-year period. Solve the problem.
-Which year had the greatest number of female athletes? What was the total number of male athletes that year?
A) athletes
B) athletes
C) athletes
D) athletes
-Which year had the greatest number of female athletes? What was the total number of male athletes that year?
A) athletes
B) athletes
C) athletes
D) athletes
Unlock Deck
Unlock for access to all 157 flashcards in this deck.
Unlock Deck
k this deck
40
Refer to the double-bar graph below which shows the number of male and female athletes at a university over a four-year period. Solve the problem.
-Find the increase in the number of female athletes from 2003 to 2004.
A) 175
B) 125
C) 375
D) 150
-Find the increase in the number of female athletes from 2003 to 2004.
A) 175
B) 125
C) 375
D) 150
Unlock Deck
Unlock for access to all 157 flashcards in this deck.
Unlock Deck
k this deck
41
Refer to the double-bar graph below which shows the number of male and female athletes at a university over a four-year period. Solve the problem.
-Find the increase in the number of male athletes from 2004 to 2005.
A) 75
B) 475
C) 100
D) 50
-Find the increase in the number of male athletes from 2004 to 2005.
A) 75
B) 475
C) 100
D) 50
Unlock Deck
Unlock for access to all 157 flashcards in this deck.
Unlock Deck
k this deck
42
Refer to the double-bar graph below which shows the number of male and female athletes at a university over a four-year period. Solve the problem.
-What was the percent of decrease in the number of female athletes from 2004 to 2005 ?
A)
B)
C)
D)
-What was the percent of decrease in the number of female athletes from 2004 to 2005 ?
A)
B)
C)
D)
Unlock Deck
Unlock for access to all 157 flashcards in this deck.
Unlock Deck
k this deck
43
Refer to the double-bar graph below which shows the number of male and female athletes at a university over a four-year period. Solve the problem.
-What was the percent of increase in the number of male athletes from 2002 to 2003 ?
A)
B)
C)
D)
-What was the percent of increase in the number of male athletes from 2002 to 2003 ?
A)
B)
C)
D)
Unlock Deck
Unlock for access to all 157 flashcards in this deck.
Unlock Deck
k this deck
44
Refer to the double-bar graph below which shows the number of male and female athletes at a university over a four-year period. Solve the problem.
-Which year had the same number of male and female athletes?
A) 2002
B) 2005
C) 2003
D) 2004
-Which year had the same number of male and female athletes?
A) 2002
B) 2005
C) 2003
D) 2004
Unlock Deck
Unlock for access to all 157 flashcards in this deck.
Unlock Deck
k this deck
45
Refer to the double-bar graph below which shows the number of male and female athletes at a university over a four-year period. Solve the problem.
-In which year did the greatest difference between the number of male athlete and female athletes occur? Find the difference.
A) athletes
B) athletes
C) athletes
D) athletes
-In which year did the greatest difference between the number of male athlete and female athletes occur? Find the difference.
A) athletes
B) athletes
C) athletes
D) athletes
Unlock Deck
Unlock for access to all 157 flashcards in this deck.
Unlock Deck
k this deck
46
Refer to the double-bar graph below which shows the number of male and female athletes at a university over a four-year period. Solve the problem.
-How many students were involved in athletics in 2003 ?
A) 400
B) 600
C) 500
D) 300
-How many students were involved in athletics in 2003 ?
A) 400
B) 600
C) 500
D) 300
Unlock Deck
Unlock for access to all 157 flashcards in this deck.
Unlock Deck
k this deck
47
Refer to the double-bar graph below which shows the number of male and female athletes at a university over a four-year period. Solve the problem.
-Find the increase in the number of female athletes from 2003 to 2005.
A) 125
B) 225
C) 150
D) 175
-Find the increase in the number of female athletes from 2003 to 2005.
A) 125
B) 225
C) 150
D) 175
Unlock Deck
Unlock for access to all 157 flashcards in this deck.
Unlock Deck
k this deck
48
Refer to the double-bar graph below which shows the number of male and female athletes at a university over a four-year period. Solve the problem.
-Find the increase in the number of male athletes from 2002 to 2004.
A) 175
B) 150
C) 275
D) 125
-Find the increase in the number of male athletes from 2002 to 2004.
A) 175
B) 150
C) 275
D) 125
Unlock Deck
Unlock for access to all 157 flashcards in this deck.
Unlock Deck
k this deck
49
Construct a bar graph to represent the given data.
-The following table shows the average amount spent per week on groceries by four different families with three members.
-The following table shows the average amount spent per week on groceries by four different families with three members.
Unlock Deck
Unlock for access to all 157 flashcards in this deck.
Unlock Deck
k this deck
50
Construct a bar graph to represent the given data.
-The following table shows the number of female infants born at Hospital X on New Year's Day (Jan. 1).
-The following table shows the number of female infants born at Hospital X on New Year's Day (Jan. 1).
Unlock Deck
Unlock for access to all 157 flashcards in this deck.
Unlock Deck
k this deck
51
Construct a bar graph to represent the given data.
-The following table shows the number of male infants born at Hospital on New Year's Day (Jan. 1).
-The following table shows the number of male infants born at Hospital on New Year's Day (Jan. 1).
Unlock Deck
Unlock for access to all 157 flashcards in this deck.
Unlock Deck
k this deck
52
Construct a bar graph to represent the given data.
-The following table shows the number of inches of rainfall measured at City during the following days.
-The following table shows the number of inches of rainfall measured at City during the following days.
Unlock Deck
Unlock for access to all 157 flashcards in this deck.
Unlock Deck
k this deck
53
Construct a bar graph to represent the given data.
-The following table shows the average number of grams of fat in various kinds of entrees served at Karma Kitchen.
-The following table shows the average number of grams of fat in various kinds of entrees served at Karma Kitchen.
Unlock Deck
Unlock for access to all 157 flashcards in this deck.
Unlock Deck
k this deck
54
Use the graph to answer the question.
-Which month in 2008 had the lowest sales?
A) Month 3
B) Month 6
C) Month 2
D) Month 8
-Which month in 2008 had the lowest sales?
A) Month 3
B) Month 6
C) Month 2
D) Month 8
Unlock Deck
Unlock for access to all 157 flashcards in this deck.
Unlock Deck
k this deck
55
Use the graph to answer the question.
-Which month in 2009 had the highest sales?
A) Month 3
B) Month 6
C) Month 12
D) Month 5
-Which month in 2009 had the highest sales?
A) Month 3
B) Month 6
C) Month 12
D) Month 5
Unlock Deck
Unlock for access to all 157 flashcards in this deck.
Unlock Deck
k this deck
56
Use the graph to answer the question.
-What was the increase in sales between month 5 and month 6 of 2009?
A)
B)
C)
D)
-What was the increase in sales between month 5 and month 6 of 2009?
A)
B)
C)
D)
Unlock Deck
Unlock for access to all 157 flashcards in this deck.
Unlock Deck
k this deck
57
Use the graph to answer the question.
-What were the total sales for the first 6 months of 2008?
A)
B)
C)
D)
-What were the total sales for the first 6 months of 2008?
A)
B)
C)
D)
Unlock Deck
Unlock for access to all 157 flashcards in this deck.
Unlock Deck
k this deck
58
Use the graph to answer the question.
-What were the total sales for the first 6 months of 2009?
A)
B)
C)
D)
-What were the total sales for the first 6 months of 2009?
A)
B)
C)
D)
Unlock Deck
Unlock for access to all 157 flashcards in this deck.
Unlock Deck
k this deck
59
Use the graph to answer the question.
-What were the total sales for 2008?
A)
B)
C)
D)
-What were the total sales for 2008?
A)
B)
C)
D)
Unlock Deck
Unlock for access to all 157 flashcards in this deck.
Unlock Deck
k this deck
60
Use the graph to answer the question.
-What was the total increase in sales for the first 6 months from 2008 to 2009?
A)
B)
C)
D)
-What was the total increase in sales for the first 6 months from 2008 to 2009?
A)
B)
C)
D)
Unlock Deck
Unlock for access to all 157 flashcards in this deck.
Unlock Deck
k this deck
61
Use the graph to answer the question.
-What was the total increase in sales from 2008 to 2009?
A)
B)
C)
D)
-What was the total increase in sales from 2008 to 2009?
A)
B)
C)
D)
Unlock Deck
Unlock for access to all 157 flashcards in this deck.
Unlock Deck
k this deck
62
Use the graph to answer the question.
-What was the difference between the highest and lowest monthly sales in 2008?
A)
B)
C)
D)
-What was the difference between the highest and lowest monthly sales in 2008?
A)
B)
C)
D)
Unlock Deck
Unlock for access to all 157 flashcards in this deck.
Unlock Deck
k this deck
63
Use the graph to answer the question.
-What was the percent of increase in sales between month 2 and month 12 of 2009 ? Round your answer to the nearest tenth.
A)
B)
C)
D)
\section*{SHORT ANSWER. Write the word or phrase that best completes each statement or answers the question.}
Make a line graph of the data in the table.
-What was the percent of increase in sales between month 2 and month 12 of 2009 ? Round your answer to the nearest tenth.
A)
B)
C)
D)
\section*{SHORT ANSWER. Write the word or phrase that best completes each statement or answers the question.}
Make a line graph of the data in the table.
Unlock Deck
Unlock for access to all 157 flashcards in this deck.
Unlock Deck
k this deck
64
Make a line graph of the data in the table.
-The following table shows the average tuition for one semester at City X College over various years. Use time on the horizontal scale for your line graph.
-The following table shows the average tuition for one semester at City X College over various years. Use time on the horizontal scale for your line graph.
Unlock Deck
Unlock for access to all 157 flashcards in this deck.
Unlock Deck
k this deck
65
Make a line graph of the data in the table.
-The following table shows the number of computer sales made at Computer Buy over five months. Use time on the horizontal scale for your line graph.
-The following table shows the number of computer sales made at Computer Buy over five months. Use time on the horizontal scale for your line graph.
Unlock Deck
Unlock for access to all 157 flashcards in this deck.
Unlock Deck
k this deck
66
Make a line graph of the data in the table.
-The following table shows the median teacher's salary in District over several years. Use time on the horizontal scale for your line graph.
-The following table shows the median teacher's salary in District over several years. Use time on the horizontal scale for your line graph.
Unlock Deck
Unlock for access to all 157 flashcards in this deck.
Unlock Deck
k this deck
67
Make a line graph of the data in the table.
-The following table gives the average cost of producing a music video over the given years. Use time on the horizontal scale for your line graph.
-The following table gives the average cost of producing a music video over the given years. Use time on the horizontal scale for your line graph.
Unlock Deck
Unlock for access to all 157 flashcards in this deck.
Unlock Deck
k this deck
68
Make a line graph of the data in the table.
-The following table gives the total amount of precipitation during the given months. Use time on the horizontal scale for your line graph.
-The following table gives the total amount of precipitation during the given months. Use time on the horizontal scale for your line graph.
Unlock Deck
Unlock for access to all 157 flashcards in this deck.
Unlock Deck
k this deck
69
For the set of numbers, find the minimum, the maximum, and the range.
-
A) Minimum: 4 ;
Maximum: 41;
Range: 37
B) Minimum: 4;
Maximum: 41;
Range: 45
C) Minimum: 41;
Maximum: 4;
Range: 37
D) Minimum: 41;
Maximum: 4;
Range: 45
-
A) Minimum: 4 ;
Maximum: 41;
Range: 37
B) Minimum: 4;
Maximum: 41;
Range: 45
C) Minimum: 41;
Maximum: 4;
Range: 37
D) Minimum: 41;
Maximum: 4;
Range: 45
Unlock Deck
Unlock for access to all 157 flashcards in this deck.
Unlock Deck
k this deck
70
For the set of numbers, find the minimum, the maximum, and the range.
-
A) Minimum: 2;
Maximum: 109;
Range: 107
B) Minimum: 109;
Maximum: 2;
Range: 107
C) Minimum: 109;
Maximum: 13;
Range: 96
D) Minimum: 13;
Maximum: 109;
Range: 96
-
A) Minimum: 2;
Maximum: 109;
Range: 107
B) Minimum: 109;
Maximum: 2;
Range: 107
C) Minimum: 109;
Maximum: 13;
Range: 96
D) Minimum: 13;
Maximum: 109;
Range: 96
Unlock Deck
Unlock for access to all 157 flashcards in this deck.
Unlock Deck
k this deck
71
For the set of numbers, find the minimum, the maximum, and the range.
-1, 3, 1, 3, 3, 1, 3, 1
A) Minimum: 1 ;
Maximum: 3;
Range: 2
B) Minimum: 3;
Maximum: 1;
Range: 0
C) Minimum: 3;
Maximum: 1;
Range: 2
D) Minimum: 1;
Maximum: 3;
Range: 0
-1, 3, 1, 3, 3, 1, 3, 1
A) Minimum: 1 ;
Maximum: 3;
Range: 2
B) Minimum: 3;
Maximum: 1;
Range: 0
C) Minimum: 3;
Maximum: 1;
Range: 2
D) Minimum: 1;
Maximum: 3;
Range: 0
Unlock Deck
Unlock for access to all 157 flashcards in this deck.
Unlock Deck
k this deck
72
Find the mean.
-
A) 30
B) 36
C) None
D) 39
-
A) 30
B) 36
C) None
D) 39
Unlock Deck
Unlock for access to all 157 flashcards in this deck.
Unlock Deck
k this deck
73
Find the mean.
-
A) 43
B) 35
C) 40
D) 50
-
A) 43
B) 35
C) 40
D) 50
Unlock Deck
Unlock for access to all 157 flashcards in this deck.
Unlock Deck
k this deck
74
Find the mean.
-144, 168, 210, 108, 204, 246
A) 360
B) 162
C) 180
D) 300
-144, 168, 210, 108, 204, 246
A) 360
B) 162
C) 180
D) 300
Unlock Deck
Unlock for access to all 157 flashcards in this deck.
Unlock Deck
k this deck
75
Find the mean.
-
A) 7
B) 8.4
C) 9
D) 9.2
-
A) 7
B) 8.4
C) 9
D) 9.2
Unlock Deck
Unlock for access to all 157 flashcards in this deck.
Unlock Deck
k this deck
76
Find the mean.
-
A) 4.7
B) 6.100
C) 4.88
D) 24.40
-
A) 4.7
B) 6.100
C) 4.88
D) 24.40
Unlock Deck
Unlock for access to all 157 flashcards in this deck.
Unlock Deck
k this deck
77
Find the mean.
-
A)
B)
C)
D)
-
A)
B)
C)
D)
Unlock Deck
Unlock for access to all 157 flashcards in this deck.
Unlock Deck
k this deck
78
Find the mean.
-
A)
B)
C)
D)
-
A)
B)
C)
D)
Unlock Deck
Unlock for access to all 157 flashcards in this deck.
Unlock Deck
k this deck
79
Find the median for the set of numbers.
-
A) 16
B) 22
C) 25
D) 36
-
A) 16
B) 22
C) 25
D) 36
Unlock Deck
Unlock for access to all 157 flashcards in this deck.
Unlock Deck
k this deck
80
Find the median for the set of numbers.
-
A) 53
B) 38
C) 62
D) 49
-
A) 53
B) 38
C) 62
D) 49
Unlock Deck
Unlock for access to all 157 flashcards in this deck.
Unlock Deck
k this deck
Unlock Deck
Unlock for access to all 157 flashcards in this deck.


