Exam 5: Data, Graphs, and Statistics
Exam 1: Whole Numbers394 Questions
Exam 2: Fraction Notation352 Questions
Exam 3: Decimal Notation457 Questions
Exam 4: Percent Notation436 Questions
Exam 5: Data, Graphs, and Statistics157 Questions
Exam 6: Geometry317 Questions
Exam 7: Introduction to Real Numbers and Algebraic Expressions354 Questions
Exam 8: Solving Equations and Inequalities272 Questions
Exam 9: Graphs of Linear Equations190 Questions
Exam 10: Polynomials: Operations389 Questions
Exam 11: Polynomials: Factoring192 Questions
Exam 12: Rational Expressions and Equations199 Questions
Exam 13: Systems of Equations79 Questions
Exam 14: Radical Expressions and Equations149 Questions
Exam 15: Quadratic Equations185 Questions
Exam 16: Converting Units of Measurement459 Questions
Select questions type
Solve the problem.
-To get an A in biology, Fred must average 90 on six quizzes. Scores on the first five quizzes were , and 95 . What is the lowest score that Fred can get on the last quiz and still receive an A?
Free
(Multiple Choice)
4.8/5  (34)
(34)
Correct Answer: Verified
A
A deck of cards contains 52 cards. These cards consist of four suits - hearts, spades, clubs, and diamonds. Each suit contains one of each of the following: , jack, queen, king, and ace. Assume that one card is selected at random from a well-shuffled deck of cards.
-Find the probability that the card is a 2,3, or 5.
Free
(Multiple Choice)
4.8/5 (34)
Correct Answer:Verified
C
Solve the problem.
-An experiment is done to compare printer cartridge quality. Two kinds of printer cartridges were tested to see how many pages of text they could produce before needing to be replaced. Which type of printer cartridge is better?
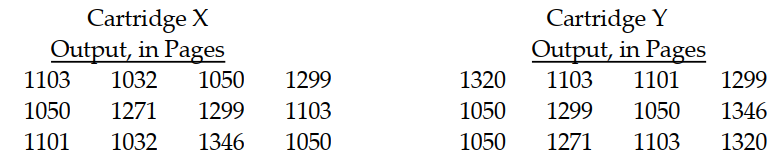
Free
(Multiple Choice)
4.9/5 (31)
Correct Answer:Verified
B
Solve the problem.
-Bengisu was pregnant 271 days and 264 days for her first two pregnancies. In order for Bengisu's average pregnancy to equal a national average of 267 days, how long must her third pregnancy last?
(Multiple Choice)
4.7/5 (37)
Solve the problem.
-To get a C in history, Nandan must average 73 on four tests. Scores on the first three tests were 77, and 62. What is the lowest score that Nandan can get on the last test and still receive a C?
(Multiple Choice)
4.8/5 (29)
Refer to the double-bar graph below which shows the number of male and female athletes at a university over a four-year period. Solve the problem.
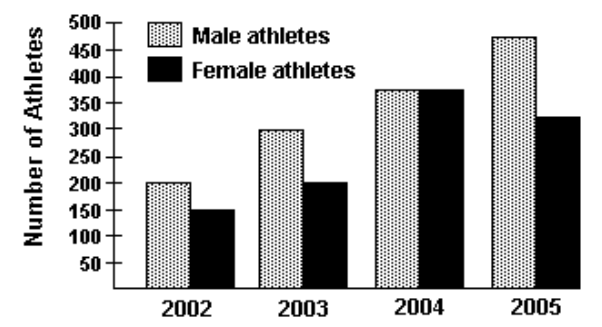 -Find the increase in the number of female athletes from 2003 to 2004.
(Multiple Choice)
4.7/5 (34)
Solve the problem.
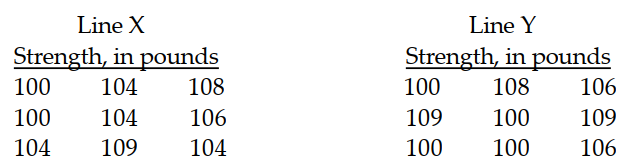
-An experiment is done to compare the strength of two types of fishing lines. Several lengths of each type were tested and the results are in the two tables below. Which type of fishing line is better?
(Multiple Choice)
4.7/5 (37)
Refer to the double-bar graph below which shows the number of male and female athletes at a university over a four-year period. Solve the problem.
-What was the percent of increase in the number of male athletes from 2002 to 2003 ?
(Multiple Choice)
4.9/5 (33)
The bar graph below shows the number of students by major in the College of Arts and Sciences. Answer the question.
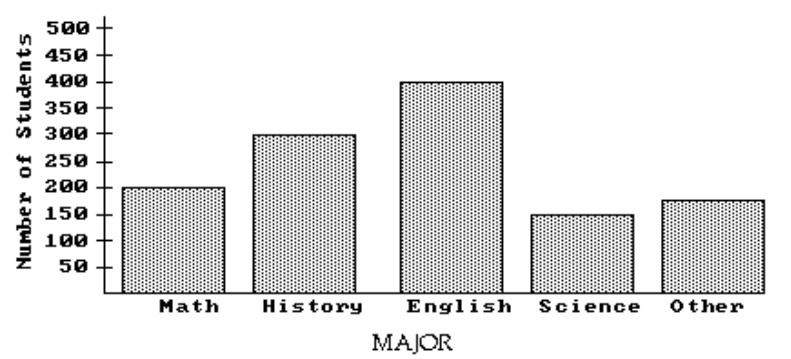 -About how many students are in the College of Arts and Sciences?
(Multiple Choice)
5.0/5 (30)
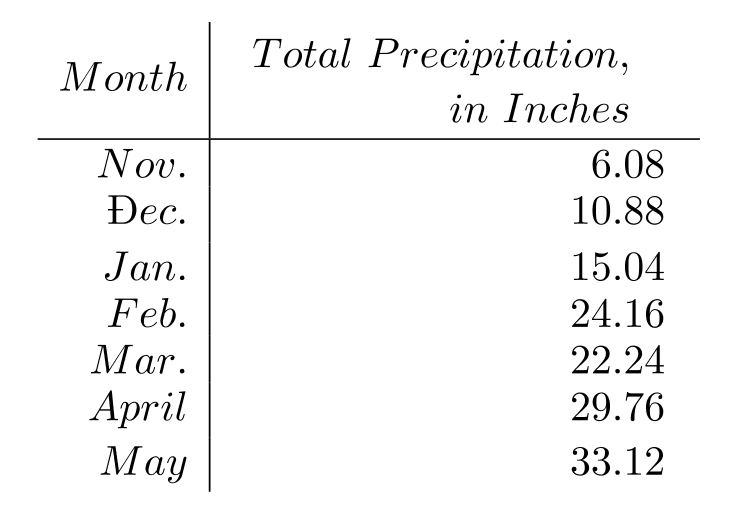
Make a line graph of the data in the table.
-The following table gives the total amount of precipitation during the given months. Use time on the horizontal scale for your line graph.
(Essay)
4.7/5 (36)
The following table contains information about moons orbiting a planet named Geo I. Use the table to solve the problem.
-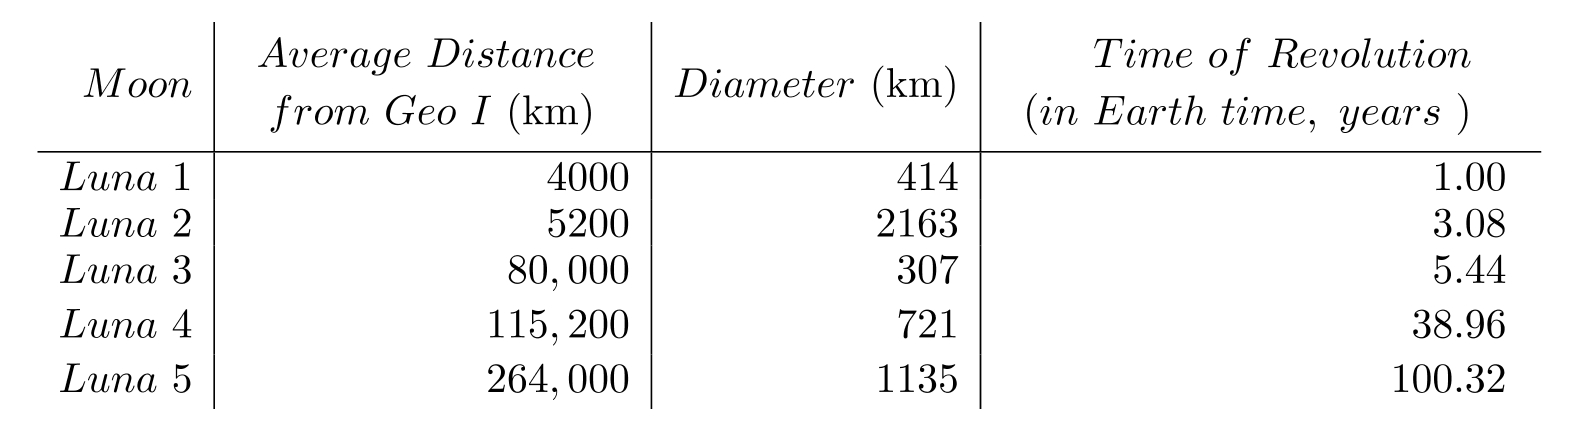 What is the mode of the diameters of the moons?
(Multiple Choice)
4.9/5 (39)
For the set of numbers, find the minimum, the maximum, and the range.
-
(Multiple Choice)
5.0/5 (29)
For the set of numbers, find the minimum, the maximum, and the range.
-1, 3, 1, 3, 3, 1, 3, 1
(Multiple Choice)
4.8/5 (34)
Find the probability of the event.
-If a single die is tossed once, find the probability of the following event. A 6
(Multiple Choice)
4.9/5 (33)
Use the pictograph to answer the question.
-For selected countries, this pictograph shows approximately how many kilograms of seafood are consumed by each person (per capita) annually.
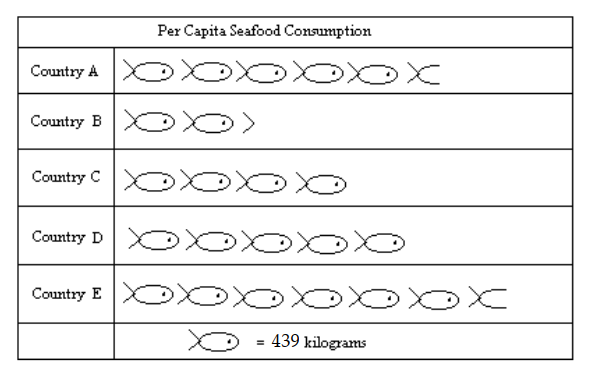 Which country consumes the most seafood?
(Multiple Choice)
4.9/5 (34)
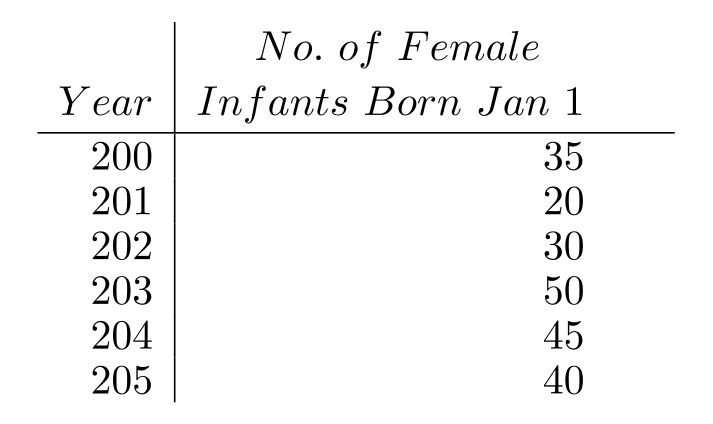
Construct a bar graph to represent the given data.
-The following table shows the number of female infants born at Hospital X on New Year's Day (Jan. 1).
(Essay)
4.9/5 (42)
Refer to the double-bar graph below which shows the number of male and female athletes at a university over a four-year period. Solve the problem.
-What was the percent of decrease in the number of female athletes from 2004 to 2005 ?
(Multiple Choice)
4.9/5 (35)
Refer to the double-bar graph below which shows the number of male and female athletes at a university over a four-year period. Solve the problem.
-In which year did the greatest difference between the number of male athlete and female athletes occur? Find the difference.
(Multiple Choice)
4.9/5 (41)
The following table contains information about moons orbiting a planet named Geo I. Use the table to solve the problem.
-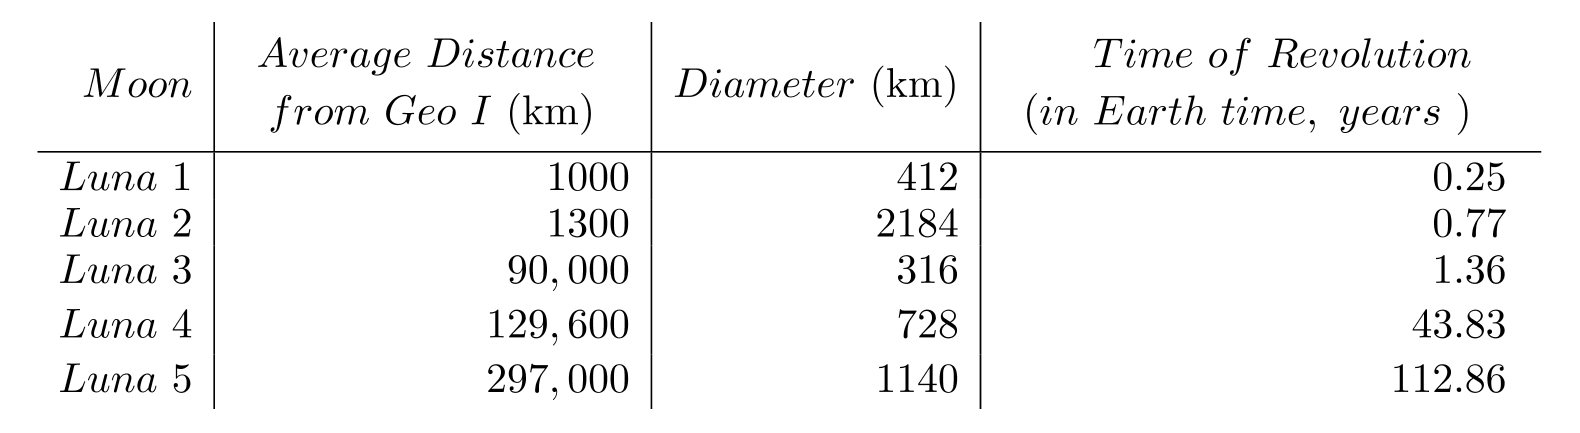 What is the average of the diameters of the moons?
(Multiple Choice)
4.9/5 (28)
Filters
- Essay(0)
- Multiple Choice(0)
- Short Answer(0)
- True False(0)
- Matching(0)