Deck 7: Demand Estimation and Forecasting
Full screen (f)
Question
refer to the following:
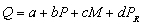
The estimated demand for a good is
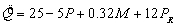
where Q is the quantity demanded of the good, P is the price of the good, M is income, and is the price of related good R.
-The coefficient on P
A) does not have the expected sign.
B) is negative as expected.
C) should have the same sign as the coefficient on .
.
D) should not be greater than one (in absolute value).
E) both b and d
The estimated demand for a good is
where Q is the quantity demanded of the good, P is the price of the good, M is income, and
is the price of related good R.-The coefficient on P
A) does not have the expected sign.
B) is negative as expected.
C) should have the same sign as the coefficient on
.D) should not be greater than one (in absolute value).
E) both b and d
Question
refer to the following:
The estimated demand for a good is
where Q is the quantity demanded of the good, P is the price of the good, M is income, and is the price of related good R.
-The good is
A) an inferior good since the coefficient on

Is positive.
B) a normal good since the coefficient on

Is positive.
C) an inferior good since the coefficient on M is greater than one.
D) a normal good since the coefficient on M is positive.
E) none of the above
The estimated demand for a good is
where Q is the quantity demanded of the good, P is the price of the good, M is income, and
is the price of related good R.-The good is
A) an inferior good since the coefficient on
Is positive.
B) a normal good since the coefficient on
Is positive.
C) an inferior good since the coefficient on M is greater than one.
D) a normal good since the coefficient on M is positive.
E) none of the above
Question
refer to the following:
The estimated demand for a good is
where Q is the quantity demanded of the good, P is the price of the good, M is income, and is the price of related good R.
-This good and the related good R are
A) complements since the coefficient on M is positive.
B) substitutes since the coefficient on M is positive.
C) complements since the coefficient on

Is positive.
D) substitutes since the coefficient on

Is positive.
The estimated demand for a good is
where Q is the quantity demanded of the good, P is the price of the good, M is income, and
is the price of related good R.-This good and the related good R are
A) complements since the coefficient on M is positive.
B) substitutes since the coefficient on M is positive.
C) complements since the coefficient on
Is positive.
D) substitutes since the coefficient on
Is positive.
Question
refer to the following:
The estimated demand for a good is
where Q is the quantity demanded of the good, P is the price of the good, M is income, and is the price of related good R.
-The coefficient on P
A) violates the law of demand.
B) is negative as dictated by the law of demand.
C) should not be greater than one (in absolute value).
D) should have the same sign as the coefficient on

E) both c and d
The estimated demand for a good is
where Q is the quantity demanded of the good, P is the price of the good, M is income, and
is the price of related good R.-The coefficient on P
A) violates the law of demand.
B) is negative as dictated by the law of demand.
C) should not be greater than one (in absolute value).
D) should have the same sign as the coefficient on
E) both c and d
Question
refer to the following:
The estimated demand for a good is
where Q is the quantity demanded of the good, P is the price of the good, M is income, and is the price of related good R.
-The good is
A) an inferior good since the coefficient on

Is negative.
B) a normal good since the coefficient on

Is negative.
C) a normal good since the coefficient on M is greater than one (in absolute value).
D) an inferior good since the coefficient on M is negative.
E) none of the above
The estimated demand for a good is
where Q is the quantity demanded of the good, P is the price of the good, M is income, and
is the price of related good R.-The good is
A) an inferior good since the coefficient on
Is negative.
B) a normal good since the coefficient on
Is negative.
C) a normal good since the coefficient on M is greater than one (in absolute value).
D) an inferior good since the coefficient on M is negative.
E) none of the above
Question
refer to the following:
The estimated demand for a good is
where Q is the quantity demanded of the good, P is the price of the good, M is income, and is the price of related good R.
-This good and good R are
A) complements since the coefficient on M is negative.
B) substitutes since the coefficient on M is negative.
C) complements since the coefficient on

Is negative.
D) substitutes since the coefficient on

Is negative.
E) none of the above
The estimated demand for a good is
where Q is the quantity demanded of the good, P is the price of the good, M is income, and
is the price of related good R.-This good and good R are
A) complements since the coefficient on M is negative.
B) substitutes since the coefficient on M is negative.
C) complements since the coefficient on
Is negative.
D) substitutes since the coefficient on
Is negative.
E) none of the above
Question
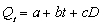
If demand is estimated using the empirical specification
, then an equivalent expression for demand is
A)
B)
C)
D)

E) none of the above
, then an equivalent expression for demand is
A)
B)
C)
D)
E) none of the above
Question
For a linear demand function,

, the income elasticity is
A) c.
B) c(M/Q).
C) c(Q/M).
D) -c.
E) -c(Q/ )
)
, the income elasticity is
A) c.
B) c(M/Q).
C) c(Q/M).
D) -c.
E) -c(Q/
) Question
For a nonlinear demand function of the form ,

, the estimated cross-price elasticity of demand is
A) d.
B) -d.
C) d(

/P))
D) -d(P/

))
E) d(Q/ ).
).
, the estimated cross-price elasticity of demand is
A) d.
B) -d.
C) d(
/P))
D) -d(P/
))
E) d(Q/
). Question
refer to the following:
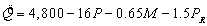
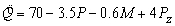
Build-Right Concrete Products produces specialty cement used in construction of highways. Build-Right is a price-setting firm and estimates the demand for its cement by the State Highway Department using a demand function in the nonlinear form:

where Q = yards of cement demanded monthly, P = the price of Build-Right's cement per yard, M = state tax revenues per capita, and = the price of asphalt per yard. The manager at Build-Right transforms the nonlinear relation into a linear relation for estimation. The estimation results are presented below:
?
-The estimated demand for cement is
A) elastic because = 4.0.
4.0.
B) elastic because = 2.0.
2.0.
C) elastic because = 1.5.
1.5.
D) inelastic because = 0.32.
0.32.
E) inelastic because = 0.8.
0.8.
Build-Right Concrete Products produces specialty cement used in construction of highways. Build-Right is a price-setting firm and estimates the demand for its cement by the State Highway Department using a demand function in the nonlinear form:
where Q = yards of cement demanded monthly, P = the price of Build-Right's cement per yard, M = state tax revenues per capita, and
= the price of asphalt per yard. The manager at Build-Right transforms the nonlinear relation into a linear relation for estimation. The estimation results are presented below:?
-The estimated demand for cement is
A) elastic because =
4.0.B) elastic because =
2.0.C) elastic because =
1.5.D) inelastic because =
0.32.E) inelastic because =
0.8. Question
refer to the following:
Build-Right Concrete Products produces specialty cement used in construction of highways. Build-Right is a price-setting firm and estimates the demand for its cement by the State Highway Department using a demand function in the nonlinear form:
where Q = yards of cement demanded monthly, P = the price of Build-Right's cement per yard, M = state tax revenues per capita, and = the price of asphalt per yard. The manager at Build-Right transforms the nonlinear relation into a linear relation for estimation. The estimation results are presented below:
?
-At the 1 percent level of significance, the number of degrees of freedom for a t-test is _____, and the critical value of the t-statistic is ________. Only parameter estimate(s) ________ is (are) NOT statistically significant at the 1 percent level of significance.
A) 30; 2.457;

B) 30; 2.750;
C) 34; 2.042;

D) 34; 2.042,

And

Build-Right Concrete Products produces specialty cement used in construction of highways. Build-Right is a price-setting firm and estimates the demand for its cement by the State Highway Department using a demand function in the nonlinear form:
where Q = yards of cement demanded monthly, P = the price of Build-Right's cement per yard, M = state tax revenues per capita, and
= the price of asphalt per yard. The manager at Build-Right transforms the nonlinear relation into a linear relation for estimation. The estimation results are presented below:?
-At the 1 percent level of significance, the number of degrees of freedom for a t-test is _____, and the critical value of the t-statistic is ________. Only parameter estimate(s) ________ is (are) NOT statistically significant at the 1 percent level of significance.
A) 30; 2.457;
B) 30; 2.750;
C) 34; 2.042;
D) 34; 2.042,
And
Question
refer to the following:
Build-Right Concrete Products produces specialty cement used in construction of highways. Build-Right is a price-setting firm and estimates the demand for its cement by the State Highway Department using a demand function in the nonlinear form:
where Q = yards of cement demanded monthly, P = the price of Build-Right's cement per yard, M = state tax revenues per capita, and = the price of asphalt per yard. The manager at Build-Right transforms the nonlinear relation into a linear relation for estimation. The estimation results are presented below:
?
-If the price of asphalt (

) decreases 20%, the estimated quantity of cement demanded will:
A) increase 12%
B) increase 6%
C) increase 1.2%
D) decrease 12%.
E) decrease 1.2%.
Build-Right Concrete Products produces specialty cement used in construction of highways. Build-Right is a price-setting firm and estimates the demand for its cement by the State Highway Department using a demand function in the nonlinear form:
where Q = yards of cement demanded monthly, P = the price of Build-Right's cement per yard, M = state tax revenues per capita, and
= the price of asphalt per yard. The manager at Build-Right transforms the nonlinear relation into a linear relation for estimation. The estimation results are presented below:?
-If the price of asphalt (
) decreases 20%, the estimated quantity of cement demanded will:
A) increase 12%
B) increase 6%
C) increase 1.2%
D) decrease 12%.
E) decrease 1.2%.
Question
The estimated demand for a good is
, where

= units of the good, P = price of the good, M = income, and

= price of related good Z. All parameter estimates are statistically significant. Which of the following statements are correct?
A) X is a normal good.
B) X is an inferior good.
C) X and Z are substitutes.
D) X and Z are complements.
E) both b and c
, where
= units of the good, P = price of the good, M = income, and
= price of related good Z. All parameter estimates are statistically significant. Which of the following statements are correct?
A) X is a normal good.
B) X is an inferior good.
C) X and Z are substitutes.
D) X and Z are complements.
E) both b and c
Question
refer to the following:
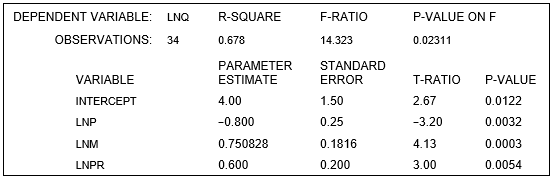
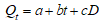
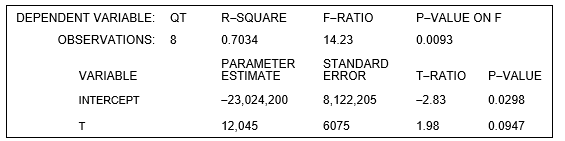
The following linear demand specification is estimated for Conlan Enterprises, a price-setting firm:
?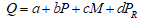
where Q is the quantity demanded of the product Conlan Enterprises sells, P is the price of that product, M is income, and PR is the price of a related product. The results of the estimation are presented below:
-At the 1% level of significance, the critical value of the F-statistic is equal to __________.
A) 0.7984
B) 4.57
C) 36.14
D) 2.763
E) -3.50
Question
refer to the following:
The following linear demand specification is estimated for Conlan Enterprises, a price-setting firm:
?
where Q is the quantity demanded of the product Conlan Enterprises sells, P is the price of that product, M is income, and PR is the price of a related product. The results of the estimation are presented below:
-At the 1% level of significance, which estimates are statistically significant?
A) All are statistically significant
B) All but are statistically significant
C) Only ,
,  are statistically significant
D) Only is statistically significant
E) All but and
and  are statistically significant
The following linear demand specification is estimated for Conlan Enterprises, a price-setting firm:
?
where Q is the quantity demanded of the product Conlan Enterprises sells, P is the price of that product, M is income, and PR is the price of a related product. The results of the estimation are presented below:
-At the 1% level of significance, which estimates are statistically significant?
A) All are statistically significant
B) All but
are statistically significantC) Only
, are statistically significantD) Only
is statistically significantE) All but
and are statistically significant Question
Question
Question
Question
refer to the following:
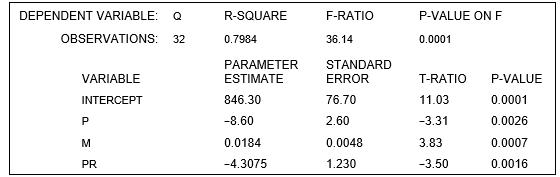
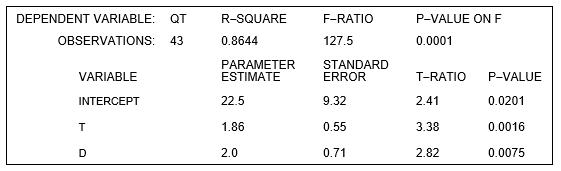
A consulting firm estimates the following quarterly sales forecasting model:
?
The equation is estimated using quarterly data from 2000I-2010III (t = 1,..., 43). The variable D is a dummy variable for the second quarter where:
D = 1 in the second quarter, and 0 otherwise.
The results of the estimation are:
?
-What is the estimated intercept of the trend line in the second quarter?
A) 22.50
B) 24.50
C) 24.36
D) 2.00
E) none of the above
Question
refer to the following:
A consulting firm estimates the following quarterly sales forecasting model:
?
The equation is estimated using quarterly data from 2000I-2010III (t = 1,..., 43). The variable D is a dummy variable for the second quarter where:
D = 1 in the second quarter, and 0 otherwise.
The results of the estimation are:
?
-What is the estimated intercept of the trend line in the third quarter?
A) 22.50
B) 24.50
C) 24.36
D) 2.00
E) none of the above
Question
refer to the following:
A consulting firm estimates the following quarterly sales forecasting model:
?
The equation is estimated using quarterly data from 2000I-2010III (t = 1,..., 43). The variable D is a dummy variable for the second quarter where:
D = 1 in the second quarter, and 0 otherwise.
The results of the estimation are:
?
-Using the estimated trend line, what is the predicted level of sales in 2010IV ?
A) 110.06
B) 106.20
C) 104.34
D) 102.2
E) none of the above
Question
refer to the following:
A consulting firm estimates the following quarterly sales forecasting model:
?
The equation is estimated using quarterly data from 2000I-2010III (t = 1,..., 43). The variable D is a dummy variable for the second quarter where:
D = 1 in the second quarter, and 0 otherwise.
The results of the estimation are:
?
-Using the estimated trend line, what is the predicted level of sales in 2011I ?
A) 110.06
B) 106.20
C) 104.34
D) 102.2
E) none of the above
Question
refer to the following:
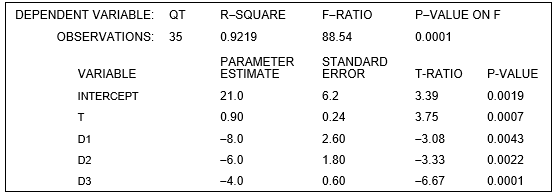
A forecaster used the regression equation
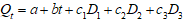
and quarterly sales data for 1993I-2010IV (t = 1, ..., 64) for an appliance manufacturer to obtain the results shown below. Q is quarterly sales, and D1, D2and D3are dummy variables for quarters I, II, and III.
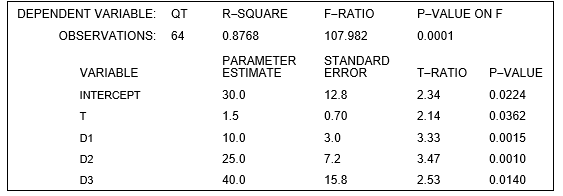
-At the 5 percent level of significance, is there a statistically significant trend in sales?
A) Yes, because 0.0362 < 0.05.
B) No, because 0.0362 > 0.01.
C) Yes, because 0.700 > 0.05.
D) Yes, because 2.14 >0.05.
E) both c and d
A forecaster used the regression equation
and quarterly sales data for 1993I-2010IV (t = 1, ..., 64) for an appliance manufacturer to obtain the results shown below. Q is quarterly sales, and D1, D2and D3are dummy variables for quarters I, II, and III.
-At the 5 percent level of significance, is there a statistically significant trend in sales?
A) Yes, because 0.0362 < 0.05.
B) No, because 0.0362 > 0.01.
C) Yes, because 0.700 > 0.05.
D) Yes, because 2.14 >0.05.
E) both c and d
Question
refer to the following:
A forecaster used the regression equation
and quarterly sales data for 1993I-2010IV (t = 1, ..., 64) for an appliance manufacturer to obtain the results shown below. Q is quarterly sales, and D1, D2and D3are dummy variables for quarters I, II, and III.
-What is the estimated intercept of the trend line in the second quarter?
A) 25
B) 26.6
C) 55
D) 65
None of the above
Question
refer to the following:
A forecaster used the regression equation
and quarterly sales data for 1993I-2010IV (t = 1, ..., 64) for an appliance manufacturer to obtain the results shown below. Q is quarterly sales, and D1, D2and D3are dummy variables for quarters I, II, and III.
-Using the estimation results given above, the predicted level of sales in 2011I is _______ units.
A) 137.5
B) 139
C) 133.5
D) 132
E) none of the above
Question
refer to the following:
A forecaster used the regression equation
and quarterly sales data for 1993I-2010IV (t = 1, ..., 64) for an appliance manufacturer to obtain the results shown below. Q is quarterly sales, and D1, D2and D3are dummy variables for quarters I, II, and III.
-Using the estimation results given above, the predicted level of sales in 2011II is _______ units.
A) 127.5
B) 137.5
C) 154
D) 155.5
E) none of the above
Question
refer to the following:
A forecaster used the regression equation
and quarterly sales data for 1993I-2010IV (t = 1, ..., 64) for an appliance manufacturer to obtain the results shown below. Q is quarterly sales, and D1, D2and D3are dummy variables for quarters I, II, and III.
-Using the estimation results given above, the predicted level of sales in 2011III is _______ units.
A) 141.5
B) 156
C) 172
D) 173.5
E) none of the above
Question
refer to the following:
A forecaster used the regression equation
and quarterly sales data for 1993I-2010IV (t = 1, ..., 64) for an appliance manufacturer to obtain the results shown below. Q is quarterly sales, and D1, D2and D3are dummy variables for quarters I, II, and III.
-Using the estimation results given above, the predicted level of sales in 2011IV is _______ units.
A) 125
B) 127.50
C) 132
D) 133.5
E) none of the above
Question
refer to the following:
The manufacturer of Beanie Baby dolls used quarterly price data for 2002I - 2010IV (t = 1, ..., 36) and the regression equation
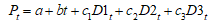
to forecast doll prices in the year 2011. Pt is the quarterly price of dolls, and D1t , D2t and D3t are dummy variables for quarters I, II, and III, respectively.
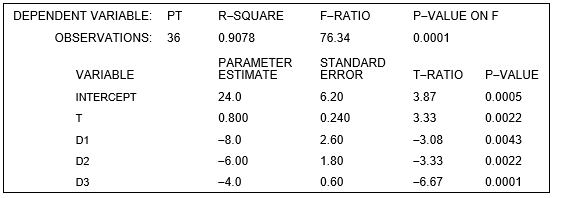
-At the 2 percent level of statistical significance, is there a statistically significant trend in the price of dolls?
A) Yes, because 0.0022 < 0.02.
B) No, because 0.0022 > 0.02.
C) Yes, because 0.800 > 0.02.
D) Yes, because 0.240 > 0.02.
E) Yes, because 3.33 > 0.02.
The manufacturer of Beanie Baby dolls used quarterly price data for 2002I - 2010IV (t = 1, ..., 36) and the regression equation
to forecast doll prices in the year 2011. Pt is the quarterly price of dolls, and D1t , D2t and D3t are dummy variables for quarters I, II, and III, respectively.
-At the 2 percent level of statistical significance, is there a statistically significant trend in the price of dolls?
A) Yes, because 0.0022 < 0.02.
B) No, because 0.0022 > 0.02.
C) Yes, because 0.800 > 0.02.
D) Yes, because 0.240 > 0.02.
E) Yes, because 3.33 > 0.02.
Question
refer to the following:
The manufacturer of Beanie Baby dolls used quarterly price data for 2002I - 2010IV (t = 1, ..., 36) and the regression equation
to forecast doll prices in the year 2011. Pt is the quarterly price of dolls, and D1t , D2t and D3t are dummy variables for quarters I, II, and III, respectively.
-The estimated QUARTERLY increase in price is ______, and the estimated ANNUAL increase in price is ______ .
A) $1.50; $6.00
B) $1.40; $4.00
C) $0.60; $2.40
D) $0.80; $3.20
E) none of the above
Question
refer to the following:
The manufacturer of Beanie Baby dolls used quarterly price data for 2002I - 2010IV (t = 1, ..., 36) and the regression equation
to forecast doll prices in the year 2011. Pt is the quarterly price of dolls, and D1t , D2t and D3t are dummy variables for quarters I, II, and III, respectively.
-What is the estimated intercept of the trend line in the 4th quarter?
A) 22.8
B) 16
C) 18
D) 20
E)None of the above
Question
refer to the following:
The manufacturer of Beanie Baby dolls used quarterly price data for 2002I - 2010IV (t = 1, ..., 36) and the regression equation
to forecast doll prices in the year 2011. Pt is the quarterly price of dolls, and D1t , D2t and D3t are dummy variables for quarters I, II, and III, respectively.
-Using the estimated time-series regression, predicted price in the 1st quarter of 2011 is
A) $53.60.
B) $45.60.
C) $56.00.
D) $37.60.
E) none of the above
Question
refer to the following:
The manufacturer of Beanie Baby dolls used quarterly price data for 2002I - 2010IV (t = 1, ..., 36) and the regression equation
to forecast doll prices in the year 2011. Pt is the quarterly price of dolls, and D1t , D2t and D3t are dummy variables for quarters I, II, and III, respectively.
-Using the estimated time-series regression, predicted price in the 2nd quarter of 2011 is
A) $48.40
B) $54.40
C) $40.40
D) $51.40
E) none of the above
Question
The estimated market demand for good X is 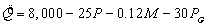 where
where  is the estimated number of units of good X demanded, P is the price of the good, M is income, and
  is the price of related good G. (All parameter estimates are statistically significant at the 1 percent level of significance.)
-Good X is a(n) ______________ good and goods X and G are _________________.
where is the estimated number of units of good X demanded, P is the price of the good, M is income, and is the price of related good G. (All parameter estimates are statistically significant at the 1 percent level of significance.)-Good X is a(n) ______________ good and goods X and G are _________________.
Question
The estimated market demand for good X is where is the estimated number of units of good X demanded, P is the price of the good, M is income, and is the price of related good G. (All parameter estimates are statistically significant at the 1 percent level of significance.)
-At P = $12, M = $30,000, and pG = $50, the predicted quantity demanded is _________ units of good X.
where is the estimated number of units of good X demanded, P is the price of the good, M is income, and is the price of related good G. (All parameter estimates are statistically significant at the 1 percent level of significance.)-At P = $12, M = $30,000, and pG = $50, the predicted quantity demanded is _________ units of good X.
Question
The estimated market demand for good X is where is the estimated number of units of good X demanded, P is the price of the good, M is income, and is the price of related good G. (All parameter estimates are statistically significant at the 1 percent level of significance.)
-At the values in part b, calculate estimates of the following elasticities:
(1) Price elasticity:  = _________.
(2) Cross-price elasticity: = __________.
(3) Income elasticity: = __________.
where is the estimated number of units of good X demanded, P is the price of the good, M is income, and is the price of related good G. (All parameter estimates are statistically significant at the 1 percent level of significance.)-At the values in part b, calculate estimates of the following elasticities:
(1) Price elasticity:
= _________.(2) Cross-price elasticity:
= __________.(3) Income elasticity:
= __________. Question
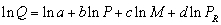
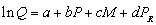
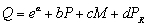
The empirical demand function is estimated in log-linear form as  where
where  is the estimated number of units of good X demanded, P is the price of X, M is income, and
  is the price of related good Y. (All parameters estimates are significantly different from zero at the 5 percent level.)
-Good X is a(n) ______________ good and goods X and Y are ____________________.
where is the estimated number of units of good X demanded, P is the price of X, M is income, and is the price of related good Y. (All parameters estimates are significantly different from zero at the 5 percent level.)-Good X is a(n) ______________ good and goods X and Y are ____________________.
Question
The empirical demand function is estimated in log-linear form as where is the estimated number of units of good X demanded, P is the price of X, M is income, and is the price of related good Y. (All parameters estimates are significantly different from zero at the 5 percent level.)
-Express the empirical demand function in the alternative (non-logarithmic) form:
 =_________________________.
where is the estimated number of units of good X demanded, P is the price of X, M is income, and is the price of related good Y. (All parameters estimates are significantly different from zero at the 5 percent level.)-Express the empirical demand function in the alternative (non-logarithmic) form:
=_________________________. Question
The empirical demand function is estimated in log-linear form as where is the estimated number of units of good X demanded, P is the price of X, M is income, and is the price of related good Y. (All parameters estimates are significantly different from zero at the 5 percent level.)
-At P = $3.55, M = $25,035, and PV = $5.07, the predicted quantity demanded is _________ units of good X.
where is the estimated number of units of good X demanded, P is the price of X, M is income, and is the price of related good Y. (All parameters estimates are significantly different from zero at the 5 percent level.)-At P = $3.55, M = $25,035, and PV = $5.07, the predicted quantity demanded is _________ units of good X.
Question
The empirical demand function is estimated in log-linear form as where is the estimated number of units of good X demanded, P is the price of X, M is income, and is the price of related good Y. (All parameters estimates are significantly different from zero at the 5 percent level.)
-Calculate the following elasticities:
(1) Price elasticity: = __________.
(2) Cross-price elasticity: = __________.
(3) Income elasticity: = __________.
where is the estimated number of units of good X demanded, P is the price of X, M is income, and is the price of related good Y. (All parameters estimates are significantly different from zero at the 5 percent level.)-Calculate the following elasticities:
(1) Price elasticity:
= __________.(2) Cross-price elasticity:
= __________.(3) Income elasticity:
= __________. Question
The following log-linear demand curve for a price-setting firm is estimated using the ordinary least-squares method:
 The estimation results are presented below:
?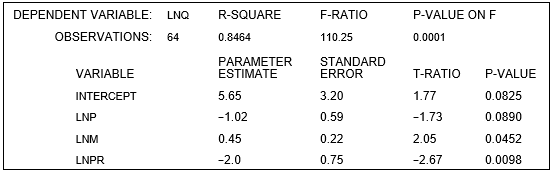
-The estimated demand equation can be expressed in logarithms as ln = ___________.
The estimation results are presented below:?
-The estimated demand equation can be expressed in logarithms as ln
= ___________. Question
The following log-linear demand curve for a price-setting firm is estimated using the ordinary least-squares method:
The estimation results are presented below:
-Good X is a(n) ______________ good and goods X and R are _________________.
The estimation results are presented below:
-Good X is a(n) ______________ good and goods X and R are _________________.
Question
The following log-linear demand curve for a price-setting firm is estimated using the ordinary least-squares method:
The estimation results are presented below:
-Find estimates for the following elasticities:
(1) Price elasticity: __________.
(2) Cross-price elasticity: __________.
(3) Income elasticity: __________.
The estimation results are presented below:
-Find estimates for the following elasticities:
(1) Price elasticity: __________.
(2) Cross-price elasticity: __________.
(3) Income elasticity: __________.
Question
The following log-linear demand curve for a price-setting firm is estimated using the ordinary least-squares method:
The estimation results are presented below:
-A 22 percent decrease in household income, holding all other things constant, will cause quantity demanded to _____________ (increase, decrease) by _____ percent.
The estimation results are presented below:
-A 22 percent decrease in household income, holding all other things constant, will cause quantity demanded to _____________ (increase, decrease) by _____ percent.
Question
The following log-linear demand curve for a price-setting firm is estimated using the ordinary least-squares method:
The estimation results are presented below:
-All else constant, a 22 percent increase in price causes quantity demanded _____________ (increase, decrease) by _____ percent.
The estimation results are presented below:
-All else constant, a 22 percent increase in price causes quantity demanded _____________ (increase, decrease) by _____ percent.
Question
The following log-linear demand curve for a price-setting firm is estimated using the ordinary least-squares method:
The estimation results are presented below:
-An 8 percent decrease in the price of R, holding all other variables constant, causes quantity demanded to _____________ (increase, decrease) by _____ percent.
The estimation results are presented below:
-An 8 percent decrease in the price of R, holding all other variables constant, causes quantity demanded to _____________ (increase, decrease) by _____ percent.
Question
Border Snacks Inc. produces and sells picante sauce, nacho chips, and queso dip. The company's marketing department estimated a linear demand function for Border's picante sauce: 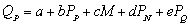 where
where  is the number of jars of picante sauce sold per month,
  is the price of picante sauce,
  is the price of a bag of nacho chips,
  is the price of a jar of queso dip, and M is consumer income. In the market served by Border Snacks, income is currently $16,000. The following regression results were obtained using 22 monthly observations:
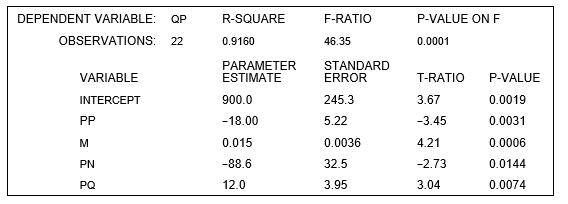
-The estimates indicate that picante sauce and nacho chips are _______. The estimates indicate that picante sauce and queso dip are _________. The estimates indicate that picante sauce is a(n) _________ good.
where is the number of jars of picante sauce sold per month, is the price of picante sauce, is the price of a bag of nacho chips, is the price of a jar of queso dip, and M is consumer income. In the market served by Border Snacks, income is currently $16,000. The following regression results were obtained using 22 monthly observations:
-The estimates indicate that picante sauce and nacho chips are _______. The estimates indicate that picante sauce and queso dip are _________. The estimates indicate that picante sauce is a(n) _________ good.
Question
Border Snacks Inc. produces and sells picante sauce, nacho chips, and queso dip. The company's marketing department estimated a linear demand function for Border's picante sauce: where is the number of jars of picante sauce sold per month, is the price of picante sauce, is the price of a bag of nacho chips, is the price of a jar of queso dip, and M is consumer income. In the market served by Border Snacks, income is currently $16,000. The following regression results were obtained using 22 monthly observations:
-Explain carefully and completely the meaning of the p-value for the parameter estimate on the price of nacho chips.
where is the number of jars of picante sauce sold per month, is the price of picante sauce, is the price of a bag of nacho chips, is the price of a jar of queso dip, and M is consumer income. In the market served by Border Snacks, income is currently $16,000. The following regression results were obtained using 22 monthly observations:
-Explain carefully and completely the meaning of the p-value for the parameter estimate on the price of nacho chips.
Question
Border Snacks Inc. produces and sells picante sauce, nacho chips, and queso dip. The company's marketing department estimated a linear demand function for Border's picante sauce: where is the number of jars of picante sauce sold per month, is the price of picante sauce, is the price of a bag of nacho chips, is the price of a jar of queso dip, and M is consumer income. In the market served by Border Snacks, income is currently $16,000. The following regression results were obtained using 22 monthly observations:
-If Border Snacks Inc. sets the price of picante at $6 per jar, the price of its nacho chips at $3 per bag, and the price of its queso dip at $8 per jar, sales of picante sauce is forecast to be ________________ jars per month. Show your work below:
where is the number of jars of picante sauce sold per month, is the price of picante sauce, is the price of a bag of nacho chips, is the price of a jar of queso dip, and M is consumer income. In the market served by Border Snacks, income is currently $16,000. The following regression results were obtained using 22 monthly observations:
-If Border Snacks Inc. sets the price of picante at $6 per jar, the price of its nacho chips at $3 per bag, and the price of its queso dip at $8 per jar, sales of picante sauce is forecast to be ________________ jars per month. Show your work below:
Question
Border Snacks Inc. produces and sells picante sauce, nacho chips, and queso dip. The company's marketing department estimated a linear demand function for Border's picante sauce: where is the number of jars of picante sauce sold per month, is the price of picante sauce, is the price of a bag of nacho chips, is the price of a jar of queso dip, and M is consumer income. In the market served by Border Snacks, income is currently $16,000. The following regression results were obtained using 22 monthly observations:
-At the prices set in part c above, the price elasticity of demand for picante sauce is calculated to be ____________________, and demand is ______________ at this point. Show your work below:
where is the number of jars of picante sauce sold per month, is the price of picante sauce, is the price of a bag of nacho chips, is the price of a jar of queso dip, and M is consumer income. In the market served by Border Snacks, income is currently $16,000. The following regression results were obtained using 22 monthly observations:
-At the prices set in part c above, the price elasticity of demand for picante sauce is calculated to be ____________________, and demand is ______________ at this point. Show your work below:
Question
Border Snacks Inc. produces and sells picante sauce, nacho chips, and queso dip. The company's marketing department estimated a linear demand function for Border's picante sauce: where is the number of jars of picante sauce sold per month, is the price of picante sauce, is the price of a bag of nacho chips, is the price of a jar of queso dip, and M is consumer income. In the market served by Border Snacks, income is currently $16,000. The following regression results were obtained using 22 monthly observations:
-If the price of nacho chips falls by 2.4%, Border Snacks can expect sales of its picante sauce to ___________________ (increase, decrease) by _______%. (HINT: Begin by computing the appropriate estimated cross-price elasticity.) Show your work below:
where is the number of jars of picante sauce sold per month, is the price of picante sauce, is the price of a bag of nacho chips, is the price of a jar of queso dip, and M is consumer income. In the market served by Border Snacks, income is currently $16,000. The following regression results were obtained using 22 monthly observations:
-If the price of nacho chips falls by 2.4%, Border Snacks can expect sales of its picante sauce to ___________________ (increase, decrease) by _______%. (HINT: Begin by computing the appropriate estimated cross-price elasticity.) Show your work below:
Question
A linear trend equation for sales of the form  was estimated using annual sales data for the period 2000 - 2007 (i.e., t = 2000, 2001, ..., 2007). The results of the regression are as follows:
-At the 10 percent level of significance, the critical value of the t-statistic is _______. The parameter estimate of a ________ (is, is not) statistically significant. The parameter estimate of b ________ (is, is not) statistically significant.
was estimated using annual sales data for the period 2000 - 2007 (i.e., t = 2000, 2001, ..., 2007). The results of the regression are as follows: -At the 10 percent level of significance, the critical value of the t-statistic is _______. The parameter estimate of a ________ (is, is not) statistically significant. The parameter estimate of b ________ (is, is not) statistically significant.
Question
A linear trend equation for sales of the form was estimated using annual sales data for the period 2000 - 2007 (i.e., t = 2000, 2001, ..., 2007). The results of the regression are as follows:
-The statistical estimates indicate a(n) ___________ (upward, downward) trend in sales of _________ units per year.
was estimated using annual sales data for the period 2000 - 2007 (i.e., t = 2000, 2001, ..., 2007). The results of the regression are as follows: -The statistical estimates indicate a(n) ___________ (upward, downward) trend in sales of _________ units per year.
Question
A linear trend equation for sales of the form was estimated using annual sales data for the period 2000 - 2007 (i.e., t = 2000, 2001, ..., 2007). The results of the regression are as follows:
-In the year 2008, sales are forecasted to be ___________ units.
was estimated using annual sales data for the period 2000 - 2007 (i.e., t = 2000, 2001, ..., 2007). The results of the regression are as follows: -In the year 2008, sales are forecasted to be ___________ units.
Question
A linear trend equation for sales of the form was estimated using annual sales data for the period 2000 - 2007 (i.e., t = 2000, 2001, ..., 2007). The results of the regression are as follows:
-In the year 2009, sales are forecasted to be ___________ units.
was estimated using annual sales data for the period 2000 - 2007 (i.e., t = 2000, 2001, ..., 2007). The results of the regression are as follows: -In the year 2009, sales are forecasted to be ___________ units.
Question
You decide to estimate the following quarterly sales forecasting model for new boat sales in your local county:
 The equation is estimated using quarterly data on new boat sales in the county from 2001III -2007IV ( t = 1,..., 26). The variable D is a dummy variable for the second quarter, which is the "season" for selling new boats: D = 1 in the second quarter, and 0 otherwise. The results of the estimation are:

-At the 1 percent level of significance, the critical value of the t-statistic is _______. The parameter estimate of a ________ (is, is not) statistically significant. The parameter estimate of b ________ (is, is not) statistically significant. The parameter estimate of c ________ (is, is not) statistically significant.
The equation is estimated using quarterly data on new boat sales in the county from 2001III -2007IV ( t = 1,..., 26). The variable D is a dummy variable for the second quarter, which is the "season" for selling new boats: D = 1 in the second quarter, and 0 otherwise. The results of the estimation are:-At the 1 percent level of significance, the critical value of the t-statistic is _______. The parameter estimate of a ________ (is, is not) statistically significant. The parameter estimate of b ________ (is, is not) statistically significant. The parameter estimate of c ________ (is, is not) statistically significant.
Question
You decide to estimate the following quarterly sales forecasting model for new boat sales in your local county:
The equation is estimated using quarterly data on new boat sales in the county from 2001III -2007IV ( t = 1,..., 26). The variable D is a dummy variable for the second quarter, which is the "season" for selling new boats: D = 1 in the second quarter, and 0 otherwise. The results of the estimation are:
-The statistical estimates indicate a(n) ___________ (upward, downward) trend in sales of _________ units per year.
The equation is estimated using quarterly data on new boat sales in the county from 2001III -2007IV ( t = 1,..., 26). The variable D is a dummy variable for the second quarter, which is the "season" for selling new boats: D = 1 in the second quarter, and 0 otherwise. The results of the estimation are:-The statistical estimates indicate a(n) ___________ (upward, downward) trend in sales of _________ units per year.
Question
You decide to estimate the following quarterly sales forecasting model for new boat sales in your local county:
The equation is estimated using quarterly data on new boat sales in the county from 2001III -2007IV ( t = 1,..., 26). The variable D is a dummy variable for the second quarter, which is the "season" for selling new boats: D = 1 in the second quarter, and 0 otherwise. The results of the estimation are:
-The statistical estimates indicate a(n) ___________ (positive, negative) seasonal effect on 2nd quarter sales of _________ units in the 2nd quarter of each year.
The equation is estimated using quarterly data on new boat sales in the county from 2001III -2007IV ( t = 1,..., 26). The variable D is a dummy variable for the second quarter, which is the "season" for selling new boats: D = 1 in the second quarter, and 0 otherwise. The results of the estimation are:-The statistical estimates indicate a(n) ___________ (positive, negative) seasonal effect on 2nd quarter sales of _________ units in the 2nd quarter of each year.
Question
You decide to estimate the following quarterly sales forecasting model for new boat sales in your local county:
The equation is estimated using quarterly data on new boat sales in the county from 2001III -2007IV ( t = 1,..., 26). The variable D is a dummy variable for the second quarter, which is the "season" for selling new boats: D = 1 in the second quarter, and 0 otherwise. The results of the estimation are:
-The forecasted sales for the 1st quarter of 2008 are ___________ units.
The equation is estimated using quarterly data on new boat sales in the county from 2001III -2007IV ( t = 1,..., 26). The variable D is a dummy variable for the second quarter, which is the "season" for selling new boats: D = 1 in the second quarter, and 0 otherwise. The results of the estimation are:-The forecasted sales for the 1st quarter of 2008 are ___________ units.
Question
You decide to estimate the following quarterly sales forecasting model for new boat sales in your local county:
The equation is estimated using quarterly data on new boat sales in the county from 2001III -2007IV ( t = 1,..., 26). The variable D is a dummy variable for the second quarter, which is the "season" for selling new boats: D = 1 in the second quarter, and 0 otherwise. The results of the estimation are:
-The forecasted sales for the 2nd quarter of 2008 are ___________ units.
The equation is estimated using quarterly data on new boat sales in the county from 2001III -2007IV ( t = 1,..., 26). The variable D is a dummy variable for the second quarter, which is the "season" for selling new boats: D = 1 in the second quarter, and 0 otherwise. The results of the estimation are:-The forecasted sales for the 2nd quarter of 2008 are ___________ units.
Question
You decide to estimate the following quarterly sales forecasting model for new boat sales in your local county:
The equation is estimated using quarterly data on new boat sales in the county from 2001III -2007IV ( t = 1,..., 26). The variable D is a dummy variable for the second quarter, which is the "season" for selling new boats: D = 1 in the second quarter, and 0 otherwise. The results of the estimation are:
-The forecasted sales for the 3rd quarter of 2008 are ___________ units.
The equation is estimated using quarterly data on new boat sales in the county from 2001III -2007IV ( t = 1,..., 26). The variable D is a dummy variable for the second quarter, which is the "season" for selling new boats: D = 1 in the second quarter, and 0 otherwise. The results of the estimation are:-The forecasted sales for the 3rd quarter of 2008 are ___________ units.
Question
You decide to estimate the following quarterly sales forecasting model for new boat sales in your local county:
The equation is estimated using quarterly data on new boat sales in the county from 2001III -2007IV ( t = 1,..., 26). The variable D is a dummy variable for the second quarter, which is the "season" for selling new boats: D = 1 in the second quarter, and 0 otherwise. The results of the estimation are:
-The forecasted sales for the 4th quarter of 2008 are ___________ units.
The equation is estimated using quarterly data on new boat sales in the county from 2001III -2007IV ( t = 1,..., 26). The variable D is a dummy variable for the second quarter, which is the "season" for selling new boats: D = 1 in the second quarter, and 0 otherwise. The results of the estimation are:-The forecasted sales for the 4th quarter of 2008 are ___________ units.
Question
A forecaster used the following regression equation 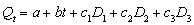 and quarterly sales data during 1999II - 2007IV (t = 1, ..., 35) for an appliance manufacturer to obtain the estimation results shown below. Q is quarterly sales, and
  ,and
,and  are seasonal dummy variables for quarters I, II, and III.
-At the 2 percent level of significance, the critical value of the t-statistic is _______.
The parameter estimate of a ________ (is, is not) statistically significant.
The parameter estimate of b ________ (is, is not) statistically significant.
The parameter estimate of C1 ________ (is, is not) statistically significant.
The parameter estimate of C2 ________ (is, is not) statistically significant.
The parameter estimate of C3 ________ (is, is not) statistically significant.
and quarterly sales data during 1999II - 2007IV (t = 1, ..., 35) for an appliance manufacturer to obtain the estimation results shown below. Q is quarterly sales, and ,and are seasonal dummy variables for quarters I, II, and III.-At the 2 percent level of significance, the critical value of the t-statistic is _______.
The parameter estimate of a ________ (is, is not) statistically significant.
The parameter estimate of b ________ (is, is not) statistically significant.
The parameter estimate of C1 ________ (is, is not) statistically significant.
The parameter estimate of C2 ________ (is, is not) statistically significant.
The parameter estimate of C3 ________ (is, is not) statistically significant.
Question
A forecaster used the following regression equation and quarterly sales data during 1999II - 2007IV (t = 1, ..., 35) for an appliance manufacturer to obtain the estimation results shown below. Q is quarterly sales, and ,and are seasonal dummy variables for quarters I, II, and III.
-The statistical estimates indicate a(n) ___________ (upward, downward) trend in sales of _________ units per quarter year.
and quarterly sales data during 1999II - 2007IV (t = 1, ..., 35) for an appliance manufacturer to obtain the estimation results shown below. Q is quarterly sales, and ,and are seasonal dummy variables for quarters I, II, and III.-The statistical estimates indicate a(n) ___________ (upward, downward) trend in sales of _________ units per quarter year.
Question
A forecaster used the following regression equation and quarterly sales data during 1999II - 2007IV (t = 1, ..., 35) for an appliance manufacturer to obtain the estimation results shown below. Q is quarterly sales, and ,and are seasonal dummy variables for quarters I, II, and III.
-The estimated intercepts for each of the four quarters are:
Intercept for quarter 1 is __________.
Intercept for quarter 2 is __________.
Intercept for quarter 3 is __________.
Intercept for quarter 4 is __________.
and quarterly sales data during 1999II - 2007IV (t = 1, ..., 35) for an appliance manufacturer to obtain the estimation results shown below. Q is quarterly sales, and ,and are seasonal dummy variables for quarters I, II, and III.-The estimated intercepts for each of the four quarters are:
Intercept for quarter 1 is __________.
Intercept for quarter 2 is __________.
Intercept for quarter 3 is __________.
Intercept for quarter 4 is __________.
Question
A forecaster used the following regression equation and quarterly sales data during 1999II - 2007IV (t = 1, ..., 35) for an appliance manufacturer to obtain the estimation results shown below. Q is quarterly sales, and ,and are seasonal dummy variables for quarters I, II, and III.
-The forecasted sales for the 1st quarter of 2008 are ___________ units.
The forecasted sales for the 2nd quarter of 2008 are ___________ units.
The forecasted sales for the 3rd quarter of 2008 are ___________ units.
The forecasted sales for the 4th quarter of 2008 are ___________ units.
and quarterly sales data during 1999II - 2007IV (t = 1, ..., 35) for an appliance manufacturer to obtain the estimation results shown below. Q is quarterly sales, and ,and are seasonal dummy variables for quarters I, II, and III.-The forecasted sales for the 1st quarter of 2008 are ___________ units.
The forecasted sales for the 2nd quarter of 2008 are ___________ units.
The forecasted sales for the 3rd quarter of 2008 are ___________ units.
The forecasted sales for the 4th quarter of 2008 are ___________ units.

Unlock Deck
Sign up to unlock the cards in this deck!
Unlock Deck
Unlock Deck
1/66
Play
Full screen (f)
Deck 7: Demand Estimation and Forecasting
1
refer to the following:
The estimated demand for a good is
where Q is the quantity demanded of the good, P is the price of the good, M is income, and is the price of related good R.
-The coefficient on P
A) does not have the expected sign.
B) is negative as expected.
C) should have the same sign as the coefficient on .
D) should not be greater than one (in absolute value).
E) both b and d
The estimated demand for a good is
where Q is the quantity demanded of the good, P is the price of the good, M is income, and
is the price of related good R.-The coefficient on P
A) does not have the expected sign.
B) is negative as expected.
C) should have the same sign as the coefficient on
.D) should not be greater than one (in absolute value).
E) both b and d
is negative as expected.
2
refer to the following:
The estimated demand for a good is
where Q is the quantity demanded of the good, P is the price of the good, M is income, and is the price of related good R.
-The good is
A) an inferior good since the coefficient on
Is positive.
B) a normal good since the coefficient on
Is positive.
C) an inferior good since the coefficient on M is greater than one.
D) a normal good since the coefficient on M is positive.
E) none of the above
The estimated demand for a good is
where Q is the quantity demanded of the good, P is the price of the good, M is income, and
is the price of related good R.-The good is
A) an inferior good since the coefficient on
Is positive.
B) a normal good since the coefficient on
Is positive.
C) an inferior good since the coefficient on M is greater than one.
D) a normal good since the coefficient on M is positive.
E) none of the above
a normal good since the coefficient on M is positive.
3
refer to the following:
The estimated demand for a good is
where Q is the quantity demanded of the good, P is the price of the good, M is income, and is the price of related good R.
-This good and the related good R are
A) complements since the coefficient on M is positive.
B) substitutes since the coefficient on M is positive.
C) complements since the coefficient on
Is positive.
D) substitutes since the coefficient on
Is positive.
The estimated demand for a good is
where Q is the quantity demanded of the good, P is the price of the good, M is income, and
is the price of related good R.-This good and the related good R are
A) complements since the coefficient on M is positive.
B) substitutes since the coefficient on M is positive.
C) complements since the coefficient on
Is positive.
D) substitutes since the coefficient on
Is positive.
substitutes since the coefficient on
Is positive.
Is positive.
4
refer to the following:
The estimated demand for a good is
where Q is the quantity demanded of the good, P is the price of the good, M is income, and is the price of related good R.
-The coefficient on P
A) violates the law of demand.
B) is negative as dictated by the law of demand.
C) should not be greater than one (in absolute value).
D) should have the same sign as the coefficient on
E) both c and d
The estimated demand for a good is
where Q is the quantity demanded of the good, P is the price of the good, M is income, and
is the price of related good R.-The coefficient on P
A) violates the law of demand.
B) is negative as dictated by the law of demand.
C) should not be greater than one (in absolute value).
D) should have the same sign as the coefficient on
E) both c and d
Unlock Deck
Unlock for access to all 66 flashcards in this deck.
Unlock Deck
k this deck
5
refer to the following:
The estimated demand for a good is
where Q is the quantity demanded of the good, P is the price of the good, M is income, and is the price of related good R.
-The good is
A) an inferior good since the coefficient on
Is negative.
B) a normal good since the coefficient on
Is negative.
C) a normal good since the coefficient on M is greater than one (in absolute value).
D) an inferior good since the coefficient on M is negative.
E) none of the above
The estimated demand for a good is
where Q is the quantity demanded of the good, P is the price of the good, M is income, and
is the price of related good R.-The good is
A) an inferior good since the coefficient on
Is negative.
B) a normal good since the coefficient on
Is negative.
C) a normal good since the coefficient on M is greater than one (in absolute value).
D) an inferior good since the coefficient on M is negative.
E) none of the above
Unlock Deck
Unlock for access to all 66 flashcards in this deck.
Unlock Deck
k this deck
6
refer to the following:
The estimated demand for a good is
where Q is the quantity demanded of the good, P is the price of the good, M is income, and is the price of related good R.
-This good and good R are
A) complements since the coefficient on M is negative.
B) substitutes since the coefficient on M is negative.
C) complements since the coefficient on
Is negative.
D) substitutes since the coefficient on
Is negative.
E) none of the above
The estimated demand for a good is
where Q is the quantity demanded of the good, P is the price of the good, M is income, and
is the price of related good R.-This good and good R are
A) complements since the coefficient on M is negative.
B) substitutes since the coefficient on M is negative.
C) complements since the coefficient on
Is negative.
D) substitutes since the coefficient on
Is negative.
E) none of the above
Unlock Deck
Unlock for access to all 66 flashcards in this deck.
Unlock Deck
k this deck
7
If demand is estimated using the empirical specification
, then an equivalent expression for demand is
A)
B)
C)
D)
E) none of the above
, then an equivalent expression for demand is
A)
B)
C)
D)
E) none of the above
Unlock Deck
Unlock for access to all 66 flashcards in this deck.
Unlock Deck
k this deck
8
For a linear demand function,
, the income elasticity is
A) c.
B) c(M/Q).
C) c(Q/M).
D) -c.
E) -c(Q/)
, the income elasticity is
A) c.
B) c(M/Q).
C) c(Q/M).
D) -c.
E) -c(Q/
) Unlock Deck
Unlock for access to all 66 flashcards in this deck.
Unlock Deck
k this deck
9
For a nonlinear demand function of the form ,
, the estimated cross-price elasticity of demand is
A) d.
B) -d.
C) d(
/P))
D) -d(P/
))
E) d(Q/ ).
, the estimated cross-price elasticity of demand is
A) d.
B) -d.
C) d(
/P))
D) -d(P/
))
E) d(Q/
). Unlock Deck
Unlock for access to all 66 flashcards in this deck.
Unlock Deck
k this deck
10
refer to the following:
Build-Right Concrete Products produces specialty cement used in construction of highways. Build-Right is a price-setting firm and estimates the demand for its cement by the State Highway Department using a demand function in the nonlinear form:
where Q = yards of cement demanded monthly, P = the price of Build-Right's cement per yard, M = state tax revenues per capita, and = the price of asphalt per yard. The manager at Build-Right transforms the nonlinear relation into a linear relation for estimation. The estimation results are presented below:
?
-The estimated demand for cement is
A) elastic because = 4.0.
B) elastic because = 2.0.
C) elastic because = 1.5.
D) inelastic because = 0.32.
E) inelastic because = 0.8.
Build-Right Concrete Products produces specialty cement used in construction of highways. Build-Right is a price-setting firm and estimates the demand for its cement by the State Highway Department using a demand function in the nonlinear form:
where Q = yards of cement demanded monthly, P = the price of Build-Right's cement per yard, M = state tax revenues per capita, and
= the price of asphalt per yard. The manager at Build-Right transforms the nonlinear relation into a linear relation for estimation. The estimation results are presented below:?
-The estimated demand for cement is
A) elastic because =
4.0.B) elastic because =
2.0.C) elastic because =
1.5.D) inelastic because =
0.32.E) inelastic because =
0.8. Unlock Deck
Unlock for access to all 66 flashcards in this deck.
Unlock Deck
k this deck
11
refer to the following:
Build-Right Concrete Products produces specialty cement used in construction of highways. Build-Right is a price-setting firm and estimates the demand for its cement by the State Highway Department using a demand function in the nonlinear form:
where Q = yards of cement demanded monthly, P = the price of Build-Right's cement per yard, M = state tax revenues per capita, and = the price of asphalt per yard. The manager at Build-Right transforms the nonlinear relation into a linear relation for estimation. The estimation results are presented below:
?
-At the 1 percent level of significance, the number of degrees of freedom for a t-test is _____, and the critical value of the t-statistic is ________. Only parameter estimate(s) ________ is (are) NOT statistically significant at the 1 percent level of significance.
A) 30; 2.457;
B) 30; 2.750;
C) 34; 2.042;
D) 34; 2.042,
And
Build-Right Concrete Products produces specialty cement used in construction of highways. Build-Right is a price-setting firm and estimates the demand for its cement by the State Highway Department using a demand function in the nonlinear form:
where Q = yards of cement demanded monthly, P = the price of Build-Right's cement per yard, M = state tax revenues per capita, and
= the price of asphalt per yard. The manager at Build-Right transforms the nonlinear relation into a linear relation for estimation. The estimation results are presented below:?
-At the 1 percent level of significance, the number of degrees of freedom for a t-test is _____, and the critical value of the t-statistic is ________. Only parameter estimate(s) ________ is (are) NOT statistically significant at the 1 percent level of significance.
A) 30; 2.457;
B) 30; 2.750;
C) 34; 2.042;
D) 34; 2.042,
And
Unlock Deck
Unlock for access to all 66 flashcards in this deck.
Unlock Deck
k this deck
12
refer to the following:
Build-Right Concrete Products produces specialty cement used in construction of highways. Build-Right is a price-setting firm and estimates the demand for its cement by the State Highway Department using a demand function in the nonlinear form:
where Q = yards of cement demanded monthly, P = the price of Build-Right's cement per yard, M = state tax revenues per capita, and = the price of asphalt per yard. The manager at Build-Right transforms the nonlinear relation into a linear relation for estimation. The estimation results are presented below:
?
-If the price of asphalt (
) decreases 20%, the estimated quantity of cement demanded will:
A) increase 12%
B) increase 6%
C) increase 1.2%
D) decrease 12%.
E) decrease 1.2%.
Build-Right Concrete Products produces specialty cement used in construction of highways. Build-Right is a price-setting firm and estimates the demand for its cement by the State Highway Department using a demand function in the nonlinear form:
where Q = yards of cement demanded monthly, P = the price of Build-Right's cement per yard, M = state tax revenues per capita, and
= the price of asphalt per yard. The manager at Build-Right transforms the nonlinear relation into a linear relation for estimation. The estimation results are presented below:?
-If the price of asphalt (
) decreases 20%, the estimated quantity of cement demanded will:
A) increase 12%
B) increase 6%
C) increase 1.2%
D) decrease 12%.
E) decrease 1.2%.
Unlock Deck
Unlock for access to all 66 flashcards in this deck.
Unlock Deck
k this deck
13
The estimated demand for a good is
, where
= units of the good, P = price of the good, M = income, and
= price of related good Z. All parameter estimates are statistically significant. Which of the following statements are correct?
A) X is a normal good.
B) X is an inferior good.
C) X and Z are substitutes.
D) X and Z are complements.
E) both b and c
Unlock Deck
Unlock for access to all 66 flashcards in this deck.
Unlock Deck
k this deck
14
refer to the following:
The following linear demand specification is estimated for Conlan Enterprises, a price-setting firm:
?
where Q is the quantity demanded of the product Conlan Enterprises sells, P is the price of that product, M is income, and PR is the price of a related product. The results of the estimation are presented below:
-At the 1% level of significance, the critical value of the F-statistic is equal to __________.
A) 0.7984
B) 4.57
C) 36.14
D) 2.763
E) -3.50
Unlock Deck
Unlock for access to all 66 flashcards in this deck.
Unlock Deck
k this deck
15
refer to the following:
The following linear demand specification is estimated for Conlan Enterprises, a price-setting firm:
?
where Q is the quantity demanded of the product Conlan Enterprises sells, P is the price of that product, M is income, and PR is the price of a related product. The results of the estimation are presented below:
-At the 1% level of significance, which estimates are statistically significant?
A) All are statistically significant
B) All but are statistically significant
C) Only , are statistically significant
D) Only is statistically significant
E) All but and are statistically significant
The following linear demand specification is estimated for Conlan Enterprises, a price-setting firm:
?
where Q is the quantity demanded of the product Conlan Enterprises sells, P is the price of that product, M is income, and PR is the price of a related product. The results of the estimation are presented below:
-At the 1% level of significance, which estimates are statistically significant?
A) All are statistically significant
B) All but
are statistically significantC) Only
, are statistically significantD) Only
is statistically significantE) All but
and are statistically significant Unlock Deck
Unlock for access to all 66 flashcards in this deck.
Unlock Deck
k this deck
16
assume that the income is $10,000, the price of the related good is $40, and Conlan chooses to set the price of this product at $30.
-At the prices and income given above, what is the price elasticity of demand?
A) -0.43
B) -0.86
C) -1.00
D) -1.43
E) -2.40
-At the prices and income given above, what is the price elasticity of demand?
A) -0.43
B) -0.86
C) -1.00
D) -1.43
E) -2.40
Unlock Deck
Unlock for access to all 66 flashcards in this deck.
Unlock Deck
k this deck
17
assume that the income is $10,000, the price of the related good is $40, and Conlan chooses to set the price of this product at $30.
-At the prices and income given above, what is the income elasticity?
A) -1.62
B) -0.87
C) 0.21
D) 0.31
E) 1.50
-At the prices and income given above, what is the income elasticity?
A) -1.62
B) -0.87
C) 0.21
D) 0.31
E) 1.50
Unlock Deck
Unlock for access to all 66 flashcards in this deck.
Unlock Deck
k this deck
18
suppose income remains at $10,000 but the price of the related good increases to $60 and Conlan decides to raise the price of its product to $50.
-What is the new own price elasticity of demand?
A) -0.24
B) -0.43
C) -0.87
D) -1.00
E) -1.26
-What is the new own price elasticity of demand?
A) -0.24
B) -0.43
C) -0.87
D) -1.00
E) -1.26
Unlock Deck
Unlock for access to all 66 flashcards in this deck.
Unlock Deck
k this deck
19
refer to the following:
A consulting firm estimates the following quarterly sales forecasting model:
?
The equation is estimated using quarterly data from 2000I-2010III (t = 1,..., 43). The variable D is a dummy variable for the second quarter where:
D = 1 in the second quarter, and 0 otherwise.
The results of the estimation are:
?
-What is the estimated intercept of the trend line in the second quarter?
A) 22.50
B) 24.50
C) 24.36
D) 2.00
E) none of the above
Unlock Deck
Unlock for access to all 66 flashcards in this deck.
Unlock Deck
k this deck
20
refer to the following:
A consulting firm estimates the following quarterly sales forecasting model:
?
The equation is estimated using quarterly data from 2000I-2010III (t = 1,..., 43). The variable D is a dummy variable for the second quarter where:
D = 1 in the second quarter, and 0 otherwise.
The results of the estimation are:
?
-What is the estimated intercept of the trend line in the third quarter?
A) 22.50
B) 24.50
C) 24.36
D) 2.00
E) none of the above
Unlock Deck
Unlock for access to all 66 flashcards in this deck.
Unlock Deck
k this deck
21
refer to the following:
A consulting firm estimates the following quarterly sales forecasting model:
?
The equation is estimated using quarterly data from 2000I-2010III (t = 1,..., 43). The variable D is a dummy variable for the second quarter where:
D = 1 in the second quarter, and 0 otherwise.
The results of the estimation are:
?
-Using the estimated trend line, what is the predicted level of sales in 2010IV ?
A) 110.06
B) 106.20
C) 104.34
D) 102.2
E) none of the above
Unlock Deck
Unlock for access to all 66 flashcards in this deck.
Unlock Deck
k this deck
22
refer to the following:
A consulting firm estimates the following quarterly sales forecasting model:
?
The equation is estimated using quarterly data from 2000I-2010III (t = 1,..., 43). The variable D is a dummy variable for the second quarter where:
D = 1 in the second quarter, and 0 otherwise.
The results of the estimation are:
?
-Using the estimated trend line, what is the predicted level of sales in 2011I ?
A) 110.06
B) 106.20
C) 104.34
D) 102.2
E) none of the above
Unlock Deck
Unlock for access to all 66 flashcards in this deck.
Unlock Deck
k this deck
23
refer to the following:
A forecaster used the regression equation
and quarterly sales data for 1993I-2010IV (t = 1, ..., 64) for an appliance manufacturer to obtain the results shown below. Q is quarterly sales, and D1, D2and D3are dummy variables for quarters I, II, and III.
-At the 5 percent level of significance, is there a statistically significant trend in sales?
A) Yes, because 0.0362 < 0.05.
B) No, because 0.0362 > 0.01.
C) Yes, because 0.700 > 0.05.
D) Yes, because 2.14 >0.05.
E) both c and d
Unlock Deck
Unlock for access to all 66 flashcards in this deck.
Unlock Deck
k this deck
24
refer to the following:
A forecaster used the regression equation
and quarterly sales data for 1993I-2010IV (t = 1, ..., 64) for an appliance manufacturer to obtain the results shown below. Q is quarterly sales, and D1, D2and D3are dummy variables for quarters I, II, and III.
-What is the estimated intercept of the trend line in the second quarter?
A) 25
B) 26.6
C) 55
D) 65
None of the above
Unlock Deck
Unlock for access to all 66 flashcards in this deck.
Unlock Deck
k this deck
25
refer to the following:
A forecaster used the regression equation
and quarterly sales data for 1993I-2010IV (t = 1, ..., 64) for an appliance manufacturer to obtain the results shown below. Q is quarterly sales, and D1, D2and D3are dummy variables for quarters I, II, and III.
-Using the estimation results given above, the predicted level of sales in 2011I is _______ units.
A) 137.5
B) 139
C) 133.5
D) 132
E) none of the above
Unlock Deck
Unlock for access to all 66 flashcards in this deck.
Unlock Deck
k this deck
26
refer to the following:
A forecaster used the regression equation
and quarterly sales data for 1993I-2010IV (t = 1, ..., 64) for an appliance manufacturer to obtain the results shown below. Q is quarterly sales, and D1, D2and D3are dummy variables for quarters I, II, and III.
-Using the estimation results given above, the predicted level of sales in 2011II is _______ units.
A) 127.5
B) 137.5
C) 154
D) 155.5
E) none of the above
Unlock Deck
Unlock for access to all 66 flashcards in this deck.
Unlock Deck
k this deck
27
refer to the following:
A forecaster used the regression equation
and quarterly sales data for 1993I-2010IV (t = 1, ..., 64) for an appliance manufacturer to obtain the results shown below. Q is quarterly sales, and D1, D2and D3are dummy variables for quarters I, II, and III.
-Using the estimation results given above, the predicted level of sales in 2011III is _______ units.
A) 141.5
B) 156
C) 172
D) 173.5
E) none of the above
Unlock Deck
Unlock for access to all 66 flashcards in this deck.
Unlock Deck
k this deck
28
refer to the following:
A forecaster used the regression equation
and quarterly sales data for 1993I-2010IV (t = 1, ..., 64) for an appliance manufacturer to obtain the results shown below. Q is quarterly sales, and D1, D2and D3are dummy variables for quarters I, II, and III.
-Using the estimation results given above, the predicted level of sales in 2011IV is _______ units.
A) 125
B) 127.50
C) 132
D) 133.5
E) none of the above
Unlock Deck
Unlock for access to all 66 flashcards in this deck.
Unlock Deck
k this deck
29
refer to the following:
The manufacturer of Beanie Baby dolls used quarterly price data for 2002I - 2010IV (t = 1, ..., 36) and the regression equation
to forecast doll prices in the year 2011. Pt is the quarterly price of dolls, and D1t , D2t and D3t are dummy variables for quarters I, II, and III, respectively.
-At the 2 percent level of statistical significance, is there a statistically significant trend in the price of dolls?
A) Yes, because 0.0022 < 0.02.
B) No, because 0.0022 > 0.02.
C) Yes, because 0.800 > 0.02.
D) Yes, because 0.240 > 0.02.
E) Yes, because 3.33 > 0.02.
Unlock Deck
Unlock for access to all 66 flashcards in this deck.
Unlock Deck
k this deck
30
refer to the following:
The manufacturer of Beanie Baby dolls used quarterly price data for 2002I - 2010IV (t = 1, ..., 36) and the regression equation
to forecast doll prices in the year 2011. Pt is the quarterly price of dolls, and D1t , D2t and D3t are dummy variables for quarters I, II, and III, respectively.
-The estimated QUARTERLY increase in price is ______, and the estimated ANNUAL increase in price is ______ .
A) $1.50; $6.00
B) $1.40; $4.00
C) $0.60; $2.40
D) $0.80; $3.20
E) none of the above
Unlock Deck
Unlock for access to all 66 flashcards in this deck.
Unlock Deck
k this deck
31
refer to the following:
The manufacturer of Beanie Baby dolls used quarterly price data for 2002I - 2010IV (t = 1, ..., 36) and the regression equation
to forecast doll prices in the year 2011. Pt is the quarterly price of dolls, and D1t , D2t and D3t are dummy variables for quarters I, II, and III, respectively.
-What is the estimated intercept of the trend line in the 4th quarter?
A) 22.8
B) 16
C) 18
D) 20
E)None of the above
Unlock Deck
Unlock for access to all 66 flashcards in this deck.
Unlock Deck
k this deck
32
refer to the following:
The manufacturer of Beanie Baby dolls used quarterly price data for 2002I - 2010IV (t = 1, ..., 36) and the regression equation
to forecast doll prices in the year 2011. Pt is the quarterly price of dolls, and D1t , D2t and D3t are dummy variables for quarters I, II, and III, respectively.
-Using the estimated time-series regression, predicted price in the 1st quarter of 2011 is
A) $53.60.
B) $45.60.
C) $56.00.
D) $37.60.
E) none of the above
Unlock Deck
Unlock for access to all 66 flashcards in this deck.
Unlock Deck
k this deck
33
refer to the following:
The manufacturer of Beanie Baby dolls used quarterly price data for 2002I - 2010IV (t = 1, ..., 36) and the regression equation
to forecast doll prices in the year 2011. Pt is the quarterly price of dolls, and D1t , D2t and D3t are dummy variables for quarters I, II, and III, respectively.
-Using the estimated time-series regression, predicted price in the 2nd quarter of 2011 is
A) $48.40
B) $54.40
C) $40.40
D) $51.40
E) none of the above
Unlock Deck
Unlock for access to all 66 flashcards in this deck.
Unlock Deck
k this deck
34
The estimated market demand for good X is where is the estimated number of units of good X demanded, P is the price of the good, M is income, and is the price of related good G. (All parameter estimates are statistically significant at the 1 percent level of significance.)
-Good X is a(n) ______________ good and goods X and G are _________________.
where is the estimated number of units of good X demanded, P is the price of the good, M is income, and is the price of related good G. (All parameter estimates are statistically significant at the 1 percent level of significance.)-Good X is a(n) ______________ good and goods X and G are _________________.
Unlock Deck
Unlock for access to all 66 flashcards in this deck.
Unlock Deck
k this deck
35
The estimated market demand for good X is where is the estimated number of units of good X demanded, P is the price of the good, M is income, and is the price of related good G. (All parameter estimates are statistically significant at the 1 percent level of significance.)
-At P = $12, M = $30,000, and pG = $50, the predicted quantity demanded is _________ units of good X.
where is the estimated number of units of good X demanded, P is the price of the good, M is income, and is the price of related good G. (All parameter estimates are statistically significant at the 1 percent level of significance.)-At P = $12, M = $30,000, and pG = $50, the predicted quantity demanded is _________ units of good X.
Unlock Deck
Unlock for access to all 66 flashcards in this deck.
Unlock Deck
k this deck
36
The estimated market demand for good X is where is the estimated number of units of good X demanded, P is the price of the good, M is income, and is the price of related good G. (All parameter estimates are statistically significant at the 1 percent level of significance.)
-At the values in part b, calculate estimates of the following elasticities:
(1) Price elasticity: = _________.
(2) Cross-price elasticity: = __________.
(3) Income elasticity: = __________.
where is the estimated number of units of good X demanded, P is the price of the good, M is income, and is the price of related good G. (All parameter estimates are statistically significant at the 1 percent level of significance.)-At the values in part b, calculate estimates of the following elasticities:
(1) Price elasticity:
= _________.(2) Cross-price elasticity:
= __________.(3) Income elasticity:
= __________. Unlock Deck
Unlock for access to all 66 flashcards in this deck.
Unlock Deck
k this deck
37
The empirical demand function is estimated in log-linear form as where is the estimated number of units of good X demanded, P is the price of X, M is income, and is the price of related good Y. (All parameters estimates are significantly different from zero at the 5 percent level.)
-Good X is a(n) ______________ good and goods X and Y are ____________________.
where is the estimated number of units of good X demanded, P is the price of X, M is income, and is the price of related good Y. (All parameters estimates are significantly different from zero at the 5 percent level.)-Good X is a(n) ______________ good and goods X and Y are ____________________.
Unlock Deck
Unlock for access to all 66 flashcards in this deck.
Unlock Deck
k this deck
38
The empirical demand function is estimated in log-linear form as where is the estimated number of units of good X demanded, P is the price of X, M is income, and is the price of related good Y. (All parameters estimates are significantly different from zero at the 5 percent level.)
-Express the empirical demand function in the alternative (non-logarithmic) form:
=_________________________.
where is the estimated number of units of good X demanded, P is the price of X, M is income, and is the price of related good Y. (All parameters estimates are significantly different from zero at the 5 percent level.)-Express the empirical demand function in the alternative (non-logarithmic) form:
=_________________________. Unlock Deck
Unlock for access to all 66 flashcards in this deck.
Unlock Deck
k this deck
39
The empirical demand function is estimated in log-linear form as where is the estimated number of units of good X demanded, P is the price of X, M is income, and is the price of related good Y. (All parameters estimates are significantly different from zero at the 5 percent level.)
-At P = $3.55, M = $25,035, and PV = $5.07, the predicted quantity demanded is _________ units of good X.
where is the estimated number of units of good X demanded, P is the price of X, M is income, and is the price of related good Y. (All parameters estimates are significantly different from zero at the 5 percent level.)-At P = $3.55, M = $25,035, and PV = $5.07, the predicted quantity demanded is _________ units of good X.
Unlock Deck
Unlock for access to all 66 flashcards in this deck.
Unlock Deck
k this deck
40
The empirical demand function is estimated in log-linear form as where is the estimated number of units of good X demanded, P is the price of X, M is income, and is the price of related good Y. (All parameters estimates are significantly different from zero at the 5 percent level.)
-Calculate the following elasticities:
(1) Price elasticity: = __________.
(2) Cross-price elasticity: = __________.
(3) Income elasticity: = __________.
where is the estimated number of units of good X demanded, P is the price of X, M is income, and is the price of related good Y. (All parameters estimates are significantly different from zero at the 5 percent level.)-Calculate the following elasticities:
(1) Price elasticity:
= __________.(2) Cross-price elasticity:
= __________.(3) Income elasticity:
= __________. Unlock Deck
Unlock for access to all 66 flashcards in this deck.
Unlock Deck
k this deck
41
The following log-linear demand curve for a price-setting firm is estimated using the ordinary least-squares method:
The estimation results are presented below:
?
-The estimated demand equation can be expressed in logarithms as ln = ___________.
The estimation results are presented below:?
-The estimated demand equation can be expressed in logarithms as ln
= ___________. Unlock Deck
Unlock for access to all 66 flashcards in this deck.
Unlock Deck
k this deck
42
The following log-linear demand curve for a price-setting firm is estimated using the ordinary least-squares method:
The estimation results are presented below:
-Good X is a(n) ______________ good and goods X and R are _________________.
The estimation results are presented below:
-Good X is a(n) ______________ good and goods X and R are _________________.
Unlock Deck
Unlock for access to all 66 flashcards in this deck.
Unlock Deck
k this deck
43
The following log-linear demand curve for a price-setting firm is estimated using the ordinary least-squares method:
The estimation results are presented below:
-Find estimates for the following elasticities:
(1) Price elasticity: __________.
(2) Cross-price elasticity: __________.
(3) Income elasticity: __________.
The estimation results are presented below:
-Find estimates for the following elasticities:
(1) Price elasticity: __________.
(2) Cross-price elasticity: __________.
(3) Income elasticity: __________.
Unlock Deck
Unlock for access to all 66 flashcards in this deck.
Unlock Deck
k this deck
44
The following log-linear demand curve for a price-setting firm is estimated using the ordinary least-squares method:
The estimation results are presented below:
-A 22 percent decrease in household income, holding all other things constant, will cause quantity demanded to _____________ (increase, decrease) by _____ percent.
The estimation results are presented below:
-A 22 percent decrease in household income, holding all other things constant, will cause quantity demanded to _____________ (increase, decrease) by _____ percent.
Unlock Deck
Unlock for access to all 66 flashcards in this deck.
Unlock Deck
k this deck
45
The following log-linear demand curve for a price-setting firm is estimated using the ordinary least-squares method:
The estimation results are presented below:
-All else constant, a 22 percent increase in price causes quantity demanded _____________ (increase, decrease) by _____ percent.
The estimation results are presented below:
-All else constant, a 22 percent increase in price causes quantity demanded _____________ (increase, decrease) by _____ percent.
Unlock Deck
Unlock for access to all 66 flashcards in this deck.
Unlock Deck
k this deck
46
The following log-linear demand curve for a price-setting firm is estimated using the ordinary least-squares method:
The estimation results are presented below:
-An 8 percent decrease in the price of R, holding all other variables constant, causes quantity demanded to _____________ (increase, decrease) by _____ percent.
The estimation results are presented below:
-An 8 percent decrease in the price of R, holding all other variables constant, causes quantity demanded to _____________ (increase, decrease) by _____ percent.
Unlock Deck
Unlock for access to all 66 flashcards in this deck.
Unlock Deck
k this deck
47
Border Snacks Inc. produces and sells picante sauce, nacho chips, and queso dip. The company's marketing department estimated a linear demand function for Border's picante sauce: where is the number of jars of picante sauce sold per month, is the price of picante sauce, is the price of a bag of nacho chips, is the price of a jar of queso dip, and M is consumer income. In the market served by Border Snacks, income is currently $16,000. The following regression results were obtained using 22 monthly observations:
-The estimates indicate that picante sauce and nacho chips are _______. The estimates indicate that picante sauce and queso dip are _________. The estimates indicate that picante sauce is a(n) _________ good.
where is the number of jars of picante sauce sold per month, is the price of picante sauce, is the price of a bag of nacho chips, is the price of a jar of queso dip, and M is consumer income. In the market served by Border Snacks, income is currently $16,000. The following regression results were obtained using 22 monthly observations:
-The estimates indicate that picante sauce and nacho chips are _______. The estimates indicate that picante sauce and queso dip are _________. The estimates indicate that picante sauce is a(n) _________ good.
Unlock Deck
Unlock for access to all 66 flashcards in this deck.
Unlock Deck
k this deck
48
Border Snacks Inc. produces and sells picante sauce, nacho chips, and queso dip. The company's marketing department estimated a linear demand function for Border's picante sauce: where is the number of jars of picante sauce sold per month, is the price of picante sauce, is the price of a bag of nacho chips, is the price of a jar of queso dip, and M is consumer income. In the market served by Border Snacks, income is currently $16,000. The following regression results were obtained using 22 monthly observations:
-Explain carefully and completely the meaning of the p-value for the parameter estimate on the price of nacho chips.
where is the number of jars of picante sauce sold per month, is the price of picante sauce, is the price of a bag of nacho chips, is the price of a jar of queso dip, and M is consumer income. In the market served by Border Snacks, income is currently $16,000. The following regression results were obtained using 22 monthly observations:
-Explain carefully and completely the meaning of the p-value for the parameter estimate on the price of nacho chips.
Unlock Deck
Unlock for access to all 66 flashcards in this deck.
Unlock Deck
k this deck
49
Border Snacks Inc. produces and sells picante sauce, nacho chips, and queso dip. The company's marketing department estimated a linear demand function for Border's picante sauce: where is the number of jars of picante sauce sold per month, is the price of picante sauce, is the price of a bag of nacho chips, is the price of a jar of queso dip, and M is consumer income. In the market served by Border Snacks, income is currently $16,000. The following regression results were obtained using 22 monthly observations:
-If Border Snacks Inc. sets the price of picante at $6 per jar, the price of its nacho chips at $3 per bag, and the price of its queso dip at $8 per jar, sales of picante sauce is forecast to be ________________ jars per month. Show your work below:
where is the number of jars of picante sauce sold per month, is the price of picante sauce, is the price of a bag of nacho chips, is the price of a jar of queso dip, and M is consumer income. In the market served by Border Snacks, income is currently $16,000. The following regression results were obtained using 22 monthly observations:
-If Border Snacks Inc. sets the price of picante at $6 per jar, the price of its nacho chips at $3 per bag, and the price of its queso dip at $8 per jar, sales of picante sauce is forecast to be ________________ jars per month. Show your work below:
Unlock Deck
Unlock for access to all 66 flashcards in this deck.
Unlock Deck
k this deck
50
Border Snacks Inc. produces and sells picante sauce, nacho chips, and queso dip. The company's marketing department estimated a linear demand function for Border's picante sauce: where is the number of jars of picante sauce sold per month, is the price of picante sauce, is the price of a bag of nacho chips, is the price of a jar of queso dip, and M is consumer income. In the market served by Border Snacks, income is currently $16,000. The following regression results were obtained using 22 monthly observations:
-At the prices set in part c above, the price elasticity of demand for picante sauce is calculated to be ____________________, and demand is ______________ at this point. Show your work below:
where is the number of jars of picante sauce sold per month, is the price of picante sauce, is the price of a bag of nacho chips, is the price of a jar of queso dip, and M is consumer income. In the market served by Border Snacks, income is currently $16,000. The following regression results were obtained using 22 monthly observations:
-At the prices set in part c above, the price elasticity of demand for picante sauce is calculated to be ____________________, and demand is ______________ at this point. Show your work below:
Unlock Deck
Unlock for access to all 66 flashcards in this deck.
Unlock Deck
k this deck
51
Border Snacks Inc. produces and sells picante sauce, nacho chips, and queso dip. The company's marketing department estimated a linear demand function for Border's picante sauce: where is the number of jars of picante sauce sold per month, is the price of picante sauce, is the price of a bag of nacho chips, is the price of a jar of queso dip, and M is consumer income. In the market served by Border Snacks, income is currently $16,000. The following regression results were obtained using 22 monthly observations:
-If the price of nacho chips falls by 2.4%, Border Snacks can expect sales of its picante sauce to ___________________ (increase, decrease) by _______%. (HINT: Begin by computing the appropriate estimated cross-price elasticity.) Show your work below:
where is the number of jars of picante sauce sold per month, is the price of picante sauce, is the price of a bag of nacho chips, is the price of a jar of queso dip, and M is consumer income. In the market served by Border Snacks, income is currently $16,000. The following regression results were obtained using 22 monthly observations:
-If the price of nacho chips falls by 2.4%, Border Snacks can expect sales of its picante sauce to ___________________ (increase, decrease) by _______%. (HINT: Begin by computing the appropriate estimated cross-price elasticity.) Show your work below:
Unlock Deck
Unlock for access to all 66 flashcards in this deck.
Unlock Deck
k this deck
52
A linear trend equation for sales of the form was estimated using annual sales data for the period 2000 - 2007 (i.e., t = 2000, 2001, ..., 2007). The results of the regression are as follows:
-At the 10 percent level of significance, the critical value of the t-statistic is _______. The parameter estimate of a ________ (is, is not) statistically significant. The parameter estimate of b ________ (is, is not) statistically significant.
was estimated using annual sales data for the period 2000 - 2007 (i.e., t = 2000, 2001, ..., 2007). The results of the regression are as follows: -At the 10 percent level of significance, the critical value of the t-statistic is _______. The parameter estimate of a ________ (is, is not) statistically significant. The parameter estimate of b ________ (is, is not) statistically significant.
Unlock Deck
Unlock for access to all 66 flashcards in this deck.
Unlock Deck
k this deck
53
A linear trend equation for sales of the form was estimated using annual sales data for the period 2000 - 2007 (i.e., t = 2000, 2001, ..., 2007). The results of the regression are as follows:
-The statistical estimates indicate a(n) ___________ (upward, downward) trend in sales of _________ units per year.
was estimated using annual sales data for the period 2000 - 2007 (i.e., t = 2000, 2001, ..., 2007). The results of the regression are as follows: -The statistical estimates indicate a(n) ___________ (upward, downward) trend in sales of _________ units per year.
Unlock Deck
Unlock for access to all 66 flashcards in this deck.
Unlock Deck
k this deck
54
A linear trend equation for sales of the form was estimated using annual sales data for the period 2000 - 2007 (i.e., t = 2000, 2001, ..., 2007). The results of the regression are as follows:
-In the year 2008, sales are forecasted to be ___________ units.
was estimated using annual sales data for the period 2000 - 2007 (i.e., t = 2000, 2001, ..., 2007). The results of the regression are as follows: -In the year 2008, sales are forecasted to be ___________ units.
Unlock Deck
Unlock for access to all 66 flashcards in this deck.
Unlock Deck
k this deck
55
A linear trend equation for sales of the form was estimated using annual sales data for the period 2000 - 2007 (i.e., t = 2000, 2001, ..., 2007). The results of the regression are as follows:
-In the year 2009, sales are forecasted to be ___________ units.
was estimated using annual sales data for the period 2000 - 2007 (i.e., t = 2000, 2001, ..., 2007). The results of the regression are as follows: -In the year 2009, sales are forecasted to be ___________ units.
Unlock Deck
Unlock for access to all 66 flashcards in this deck.
Unlock Deck
k this deck
56
You decide to estimate the following quarterly sales forecasting model for new boat sales in your local county:
The equation is estimated using quarterly data on new boat sales in the county from 2001III -2007IV ( t = 1,..., 26). The variable D is a dummy variable for the second quarter, which is the "season" for selling new boats: D = 1 in the second quarter, and 0 otherwise. The results of the estimation are:
-At the 1 percent level of significance, the critical value of the t-statistic is _______. The parameter estimate of a ________ (is, is not) statistically significant. The parameter estimate of b ________ (is, is not) statistically significant. The parameter estimate of c ________ (is, is not) statistically significant.
The equation is estimated using quarterly data on new boat sales in the county from 2001III -2007IV ( t = 1,..., 26). The variable D is a dummy variable for the second quarter, which is the "season" for selling new boats: D = 1 in the second quarter, and 0 otherwise. The results of the estimation are:-At the 1 percent level of significance, the critical value of the t-statistic is _______. The parameter estimate of a ________ (is, is not) statistically significant. The parameter estimate of b ________ (is, is not) statistically significant. The parameter estimate of c ________ (is, is not) statistically significant.
Unlock Deck
Unlock for access to all 66 flashcards in this deck.
Unlock Deck
k this deck
57
You decide to estimate the following quarterly sales forecasting model for new boat sales in your local county:
The equation is estimated using quarterly data on new boat sales in the county from 2001III -2007IV ( t = 1,..., 26). The variable D is a dummy variable for the second quarter, which is the "season" for selling new boats: D = 1 in the second quarter, and 0 otherwise. The results of the estimation are:
-The statistical estimates indicate a(n) ___________ (upward, downward) trend in sales of _________ units per year.
The equation is estimated using quarterly data on new boat sales in the county from 2001III -2007IV ( t = 1,..., 26). The variable D is a dummy variable for the second quarter, which is the "season" for selling new boats: D = 1 in the second quarter, and 0 otherwise. The results of the estimation are:-The statistical estimates indicate a(n) ___________ (upward, downward) trend in sales of _________ units per year.
Unlock Deck
Unlock for access to all 66 flashcards in this deck.
Unlock Deck
k this deck
58
You decide to estimate the following quarterly sales forecasting model for new boat sales in your local county:
The equation is estimated using quarterly data on new boat sales in the county from 2001III -2007IV ( t = 1,..., 26). The variable D is a dummy variable for the second quarter, which is the "season" for selling new boats: D = 1 in the second quarter, and 0 otherwise. The results of the estimation are:
-The statistical estimates indicate a(n) ___________ (positive, negative) seasonal effect on 2nd quarter sales of _________ units in the 2nd quarter of each year.
The equation is estimated using quarterly data on new boat sales in the county from 2001III -2007IV ( t = 1,..., 26). The variable D is a dummy variable for the second quarter, which is the "season" for selling new boats: D = 1 in the second quarter, and 0 otherwise. The results of the estimation are:-The statistical estimates indicate a(n) ___________ (positive, negative) seasonal effect on 2nd quarter sales of _________ units in the 2nd quarter of each year.
Unlock Deck
Unlock for access to all 66 flashcards in this deck.
Unlock Deck
k this deck
59
You decide to estimate the following quarterly sales forecasting model for new boat sales in your local county:
The equation is estimated using quarterly data on new boat sales in the county from 2001III -2007IV ( t = 1,..., 26). The variable D is a dummy variable for the second quarter, which is the "season" for selling new boats: D = 1 in the second quarter, and 0 otherwise. The results of the estimation are:
-The forecasted sales for the 1st quarter of 2008 are ___________ units.
The equation is estimated using quarterly data on new boat sales in the county from 2001III -2007IV ( t = 1,..., 26). The variable D is a dummy variable for the second quarter, which is the "season" for selling new boats: D = 1 in the second quarter, and 0 otherwise. The results of the estimation are:-The forecasted sales for the 1st quarter of 2008 are ___________ units.
Unlock Deck
Unlock for access to all 66 flashcards in this deck.
Unlock Deck
k this deck
60
You decide to estimate the following quarterly sales forecasting model for new boat sales in your local county:
The equation is estimated using quarterly data on new boat sales in the county from 2001III -2007IV ( t = 1,..., 26). The variable D is a dummy variable for the second quarter, which is the "season" for selling new boats: D = 1 in the second quarter, and 0 otherwise. The results of the estimation are:
-The forecasted sales for the 2nd quarter of 2008 are ___________ units.
The equation is estimated using quarterly data on new boat sales in the county from 2001III -2007IV ( t = 1,..., 26). The variable D is a dummy variable for the second quarter, which is the "season" for selling new boats: D = 1 in the second quarter, and 0 otherwise. The results of the estimation are:-The forecasted sales for the 2nd quarter of 2008 are ___________ units.
Unlock Deck
Unlock for access to all 66 flashcards in this deck.
Unlock Deck
k this deck
61
You decide to estimate the following quarterly sales forecasting model for new boat sales in your local county:
The equation is estimated using quarterly data on new boat sales in the county from 2001III -2007IV ( t = 1,..., 26). The variable D is a dummy variable for the second quarter, which is the "season" for selling new boats: D = 1 in the second quarter, and 0 otherwise. The results of the estimation are:
-The forecasted sales for the 3rd quarter of 2008 are ___________ units.
The equation is estimated using quarterly data on new boat sales in the county from 2001III -2007IV ( t = 1,..., 26). The variable D is a dummy variable for the second quarter, which is the "season" for selling new boats: D = 1 in the second quarter, and 0 otherwise. The results of the estimation are:-The forecasted sales for the 3rd quarter of 2008 are ___________ units.
Unlock Deck
Unlock for access to all 66 flashcards in this deck.
Unlock Deck
k this deck
62
You decide to estimate the following quarterly sales forecasting model for new boat sales in your local county:
The equation is estimated using quarterly data on new boat sales in the county from 2001III -2007IV ( t = 1,..., 26). The variable D is a dummy variable for the second quarter, which is the "season" for selling new boats: D = 1 in the second quarter, and 0 otherwise. The results of the estimation are:
-The forecasted sales for the 4th quarter of 2008 are ___________ units.
The equation is estimated using quarterly data on new boat sales in the county from 2001III -2007IV ( t = 1,..., 26). The variable D is a dummy variable for the second quarter, which is the "season" for selling new boats: D = 1 in the second quarter, and 0 otherwise. The results of the estimation are:-The forecasted sales for the 4th quarter of 2008 are ___________ units.
Unlock Deck
Unlock for access to all 66 flashcards in this deck.
Unlock Deck
k this deck
63
A forecaster used the following regression equation and quarterly sales data during 1999II - 2007IV (t = 1, ..., 35) for an appliance manufacturer to obtain the estimation results shown below. Q is quarterly sales, and ,and are seasonal dummy variables for quarters I, II, and III.
-At the 2 percent level of significance, the critical value of the t-statistic is _______.
The parameter estimate of a ________ (is, is not) statistically significant.
The parameter estimate of b ________ (is, is not) statistically significant.
The parameter estimate of C1 ________ (is, is not) statistically significant.
The parameter estimate of C2 ________ (is, is not) statistically significant.
The parameter estimate of C3 ________ (is, is not) statistically significant.
and quarterly sales data during 1999II - 2007IV (t = 1, ..., 35) for an appliance manufacturer to obtain the estimation results shown below. Q is quarterly sales, and ,and are seasonal dummy variables for quarters I, II, and III.-At the 2 percent level of significance, the critical value of the t-statistic is _______.
The parameter estimate of a ________ (is, is not) statistically significant.
The parameter estimate of b ________ (is, is not) statistically significant.
The parameter estimate of C1 ________ (is, is not) statistically significant.
The parameter estimate of C2 ________ (is, is not) statistically significant.
The parameter estimate of C3 ________ (is, is not) statistically significant.
Unlock Deck
Unlock for access to all 66 flashcards in this deck.
Unlock Deck
k this deck
64
A forecaster used the following regression equation and quarterly sales data during 1999II - 2007IV (t = 1, ..., 35) for an appliance manufacturer to obtain the estimation results shown below. Q is quarterly sales, and ,and are seasonal dummy variables for quarters I, II, and III.
-The statistical estimates indicate a(n) ___________ (upward, downward) trend in sales of _________ units per quarter year.
and quarterly sales data during 1999II - 2007IV (t = 1, ..., 35) for an appliance manufacturer to obtain the estimation results shown below. Q is quarterly sales, and ,and are seasonal dummy variables for quarters I, II, and III.-The statistical estimates indicate a(n) ___________ (upward, downward) trend in sales of _________ units per quarter year.
Unlock Deck
Unlock for access to all 66 flashcards in this deck.
Unlock Deck
k this deck
65
A forecaster used the following regression equation and quarterly sales data during 1999II - 2007IV (t = 1, ..., 35) for an appliance manufacturer to obtain the estimation results shown below. Q is quarterly sales, and ,and are seasonal dummy variables for quarters I, II, and III.
-The estimated intercepts for each of the four quarters are:
Intercept for quarter 1 is __________.
Intercept for quarter 2 is __________.
Intercept for quarter 3 is __________.
Intercept for quarter 4 is __________.
and quarterly sales data during 1999II - 2007IV (t = 1, ..., 35) for an appliance manufacturer to obtain the estimation results shown below. Q is quarterly sales, and ,and are seasonal dummy variables for quarters I, II, and III.-The estimated intercepts for each of the four quarters are:
Intercept for quarter 1 is __________.
Intercept for quarter 2 is __________.
Intercept for quarter 3 is __________.
Intercept for quarter 4 is __________.
Unlock Deck
Unlock for access to all 66 flashcards in this deck.
Unlock Deck
k this deck
66
A forecaster used the following regression equation and quarterly sales data during 1999II - 2007IV (t = 1, ..., 35) for an appliance manufacturer to obtain the estimation results shown below. Q is quarterly sales, and ,and are seasonal dummy variables for quarters I, II, and III.
-The forecasted sales for the 1st quarter of 2008 are ___________ units.
The forecasted sales for the 2nd quarter of 2008 are ___________ units.
The forecasted sales for the 3rd quarter of 2008 are ___________ units.
The forecasted sales for the 4th quarter of 2008 are ___________ units.
and quarterly sales data during 1999II - 2007IV (t = 1, ..., 35) for an appliance manufacturer to obtain the estimation results shown below. Q is quarterly sales, and ,and are seasonal dummy variables for quarters I, II, and III.-The forecasted sales for the 1st quarter of 2008 are ___________ units.
The forecasted sales for the 2nd quarter of 2008 are ___________ units.
The forecasted sales for the 3rd quarter of 2008 are ___________ units.
The forecasted sales for the 4th quarter of 2008 are ___________ units.
Unlock Deck
Unlock for access to all 66 flashcards in this deck.
Unlock Deck
k this deck
Unlock Deck
Unlock for access to all 66 flashcards in this deck.


