Deck 5: Theory of Consumer Behavior
Full screen (f)
Question
refer to the following:
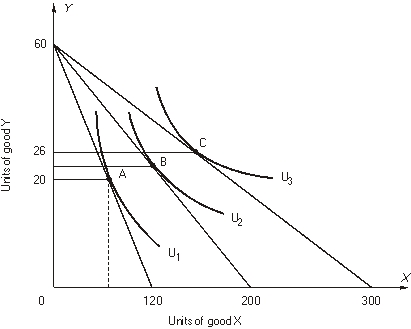 The price of Y is $10.
-The marginal rate of substitution of X for Y at point C is:
A) 5
B) 2
C) 0.5
D) 0.3
E) none of the above
The price of Y is $10.-The marginal rate of substitution of X for Y at point C is:
A) 5
B) 2
C) 0.5
D) 0.3
E) none of the above
Question
refer to the following figure:
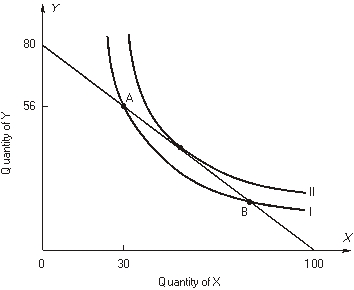 The consumer's income is $800.
-What are the prices of goods X and Y?
A) = $10,
  = $8
= $8
B)

= $8,

= $10
C)

= $100,

= $80
D)

= $20,

= $60
E)

= $60,

= $20
The consumer's income is $800.-What are the prices of goods X and Y?
A)
= $10, = $8B)
= $8,
= $10
C)
= $100,
= $80
D)
= $20,
= $60
E)
= $60,
= $20
Question
refer to the following figure:
The consumer's income is $800.
-Why doesn't the consumer choose the combination of 30X and 56Y at point A?
A) MRS is less than

)
B) MRS is greater than

)
C)

Is greater than

)
D)

Is less than

)
The consumer's income is $800.-Why doesn't the consumer choose the combination of 30X and 56Y at point A?
A) MRS is less than
)
B) MRS is greater than
)
C)
Is greater than
)
D)
Is less than
)
Question
Question
Question
Question
Question
refer to the following figure that shows the effect of an INCREASE in the price of X.
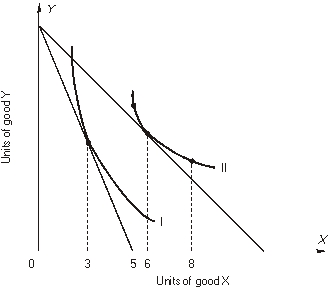
-The substitution effect of the price change is the change in the consumption of X from
A) 5 to 3.
B) 6 to 3.
C) 6 to 5.
D) 6 to 8.
E) none of the above
-The substitution effect of the price change is the change in the consumption of X from
A) 5 to 3.
B) 6 to 3.
C) 6 to 5.
D) 6 to 8.
E) none of the above
Question
refer to the following figure that shows the effect of an INCREASE in the price of X.
-The income effect of the price change is the change in the consumption of X from
A) 5 to 3.
B) 6 to 3.
C) 6 to 5.
D) 6 to 8.
E) none of the above
-The income effect of the price change is the change in the consumption of X from
A) 5 to 3.
B) 6 to 3.
C) 6 to 5.
D) 6 to 8.
E) none of the above
Question
refer to the following figure that shows the effect of an INCREASE in the price of X.
-The total effect of the price change is the change in the consumption of X from
A) 5 to 3.
B) 6 to 3.
C) 6 to 5.
D) 6 to 8.
E) none of the above
-The total effect of the price change is the change in the consumption of X from
A) 5 to 3.
B) 6 to 3.
C) 6 to 5.
D) 6 to 8.
E) none of the above
Question
refer to the following figure that shows the effect of an INCREASE in the price of X.
-Good X is
A) normal.
B) inferior.
C) a Giffen good.
D) both b and c
-Good X is
A) normal.
B) inferior.
C) a Giffen good.
D) both b and c
Question
Question
refer to the following figure:
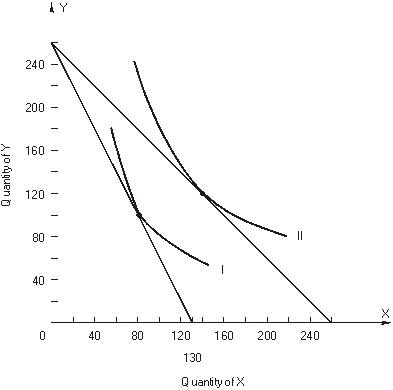 The consumer's income is $2,600.
-Two points on this consumer's demand for good X are
A)

= $260, X = 140 and

= $130, X = 80.
B)

= $10, X = 260 and

= $20, X = 130.
C)

= $10, X = 140 and

= $10, X = 120.
D)

= $20, X = 80 and

= $10, X = 100.
E) = $10, X = 140 and
  = $20, X = 80.
The consumer's income is $2,600.-Two points on this consumer's demand for good X are
A)
= $260, X = 140 and
= $130, X = 80.
B)
= $10, X = 260 and
= $20, X = 130.
C)
= $10, X = 140 and
= $10, X = 120.
D)
= $20, X = 80 and
= $10, X = 100.
E)
= $10, X = 140 and = $20, X = 80. Question
refer to the following figure:
The consumer's income is $2,600.
-The total effect of the increase in the price of X is
A) X falls 60 units.
B) X rises 60 units.
C) X falls 130 units.
D) X rises 130 units.
E) X falls 20 units.
The consumer's income is $2,600.-The total effect of the increase in the price of X is
A) X falls 60 units.
B) X rises 60 units.
C) X falls 130 units.
D) X rises 130 units.
E) X falls 20 units.
Question
refer to the following figure:
The consumer's income is $2,600.
-The substitution effect of the increase in the price of X is (approximately)
A) X rises 20 units.
B) X falls 40 units.
C) X falls 130 units.
D) X falls 16 units.
E) X rises 40 units.
The consumer's income is $2,600.-The substitution effect of the increase in the price of X is (approximately)
A) X rises 20 units.
B) X falls 40 units.
C) X falls 130 units.
D) X falls 16 units.
E) X rises 40 units.
Question
refer to the following figure:
The consumer's income is $2,600.
-The income effect of the increase in the price of X is (approximately)
A) X falls 130 units.
B) X rises 60 units.
C) X falls 60 units.
D) X falls 20 units.
E) X rises 20 units.
The consumer's income is $2,600.-The income effect of the increase in the price of X is (approximately)
A) X falls 130 units.
B) X rises 60 units.
C) X falls 60 units.
D) X falls 20 units.
E) X rises 20 units.
Question
refer to the following figure:
The consumer's income is $2,600.
-In order to isolate the income and substitution effects what must have happened, temporarily, to the consumer's income (approximately)?
A) $1,200 added to income
B) $600 taken away from income
C) nothing, income is $2,600
D) $2,600 added to income
E) $1,800 taken away from income
The consumer's income is $2,600.-In order to isolate the income and substitution effects what must have happened, temporarily, to the consumer's income (approximately)?
A) $1,200 added to income
B) $600 taken away from income
C) nothing, income is $2,600
D) $2,600 added to income
E) $1,800 taken away from income
Question
refer to the following graph:
?
-What is the price of Y?
A) $0.25
B) $4
C) $8
D) $6
E) none of the above
?
-What is the price of Y?
A) $0.25
B) $4
C) $8
D) $6
E) none of the above
Question
Question
Question
Question
refer to the following graph:
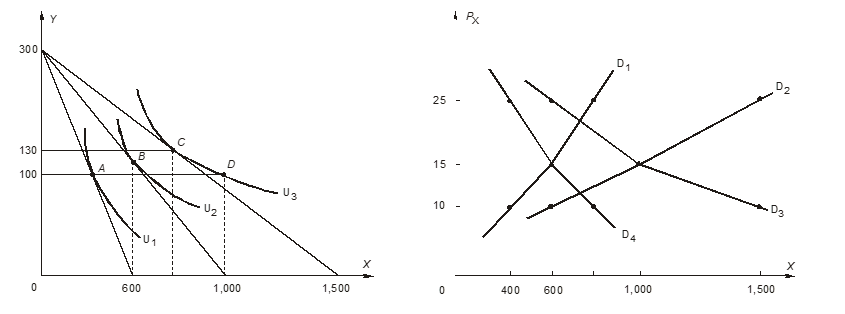
-The consumer's demand curve for X is
A) D1.
B) D2.
C) D3.
D) D4.
-The consumer's demand curve for X is
A) D1.
B) D2.
C) D3.
D) D4.
Question
Question
refer to the following graphs:
The price of Y is $15 per unit.
-What is
A) 12
B) 15
C) 20
D) 25
E) none of the above
The price of Y is $15 per unit.
-What is
A) 12
B) 15
C) 20
D) 25
E) none of the above
Question
refer to the following graphs:
The price of Y is $15 per unit.
-What is

A) 10
B) 12
C) 18
D) 20
E) none of the above
The price of Y is $15 per unit.
-What is
A) 10
B) 12
C) 18
D) 20
E) none of the above
Question
Question
Question
Question
Question
Question
Question
Question
Question
The following questions refer to the following graph of a consumer's indifference curve.
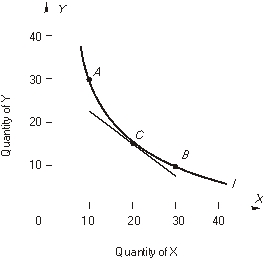
-What is the consumer's marginal rate of substitution between points A and C? ______. Moving between these points, the consumer is willing to give up ______ units of Y for another X or ______ units of X for another Y.
-What is the consumer's marginal rate of substitution between points A and C? ______. Moving between these points, the consumer is willing to give up ______ units of Y for another X or ______ units of X for another Y.
Question
The following questions refer to the following graph of a consumer's indifference curve.
-What is the consumer's marginal rate of substitution between points C and B? ______. Moving between these points the consumer is willing to give up ______ units of Y for another X or ______ units of X for another Y.
-What is the consumer's marginal rate of substitution between points C and B? ______. Moving between these points the consumer is willing to give up ______ units of Y for another X or ______ units of X for another Y.
Question
The following questions refer to the following graph of a consumer's indifference curve.
-At point C the consumer's marginal rate of substitution at point is approximately ______. This means that the consumer is willing to substitute at a rate of ______ units of Y for one more X or ______ X for one Y.
-At point C the consumer's marginal rate of substitution at point is approximately ______. This means that the consumer is willing to substitute at a rate of ______ units of Y for one more X or ______ X for one Y.
Question
Use the following graph showing two budget lines, LR and LZ to answer the following questions. The consumer's income is $720.
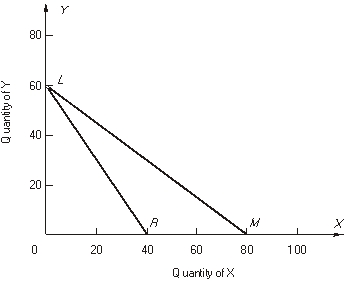
-For budget line LR the price of Y is $______ and the price of X is $______. The equation for budget line LR is ________________________.
-For budget line LR the price of Y is $______ and the price of X is $______. The equation for budget line LR is ________________________.
Question
Use the following graph showing two budget lines, LR and LZ to answer the following questions. The consumer's income is $720.
-For budget line LM the price of Y is $______ and the price of X is $______. The equation for budget line LM is _____________________.
-For budget line LM the price of Y is $______ and the price of X is $______. The equation for budget line LM is _____________________.
Question
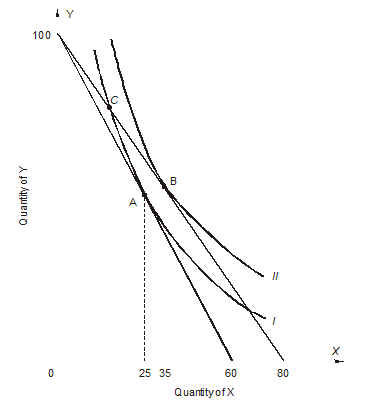
Use the following graph showing a consumer's budget line and some indifference curves to answer the following questions. The consumer's income is $600.
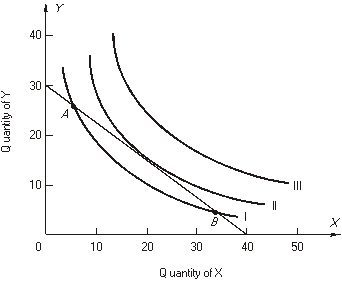
-The price of Y is $______ and the price of X is $______. The consumer should buy _____ unit of X and ______ units of Y. In equilibrium the marginal rate of substitution is _____.
-The price of Y is $______ and the price of X is $______. The consumer should buy _____ unit of X and ______ units of Y. In equilibrium the marginal rate of substitution is _____.
Question
Use the following graph showing a consumer's budget line and some indifference curves to answer the following questions. The consumer's income is $600.
-If the consumer is buying the combination at point A, the MRS is ________________ (greater, less) than the price _________, so the consumer should buy more ______ and less ______ in order to increase utility. The consumer would buy no combination on indifference curve III because _______________.
-If the consumer is buying the combination at point A, the MRS is ________________ (greater, less) than the price _________, so the consumer should buy more ______ and less ______ in order to increase utility. The consumer would buy no combination on indifference curve III because _______________.
Question
Use the following graph showing a consumer's budget line and some indifference curves to answer the following questions. The consumer's income is $600.
-If the consumer is buying the combination at point B, the MRS is ______ than the price ____________, so the consumer should buy more ______ and less ______ to increase utility. At point B, is ____________ than the
  .
.
-If the consumer is buying the combination at point B, the MRS is ______ than the price ____________, so the consumer should buy more ______ and less ______ to increase utility. At point B,
is ____________ than the . Question
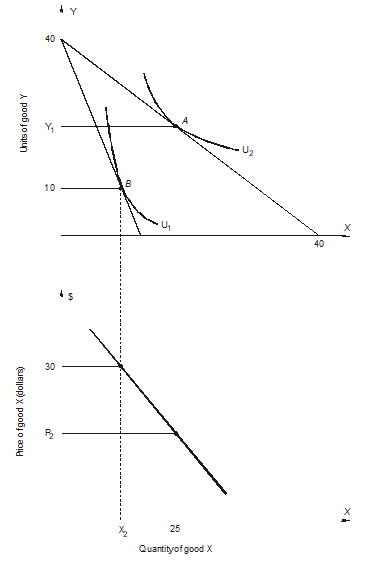
The following figure shows a portion of a consumer's indifference map and budget lines. The price of good Y is $17 and the consumer's income is $7,650.
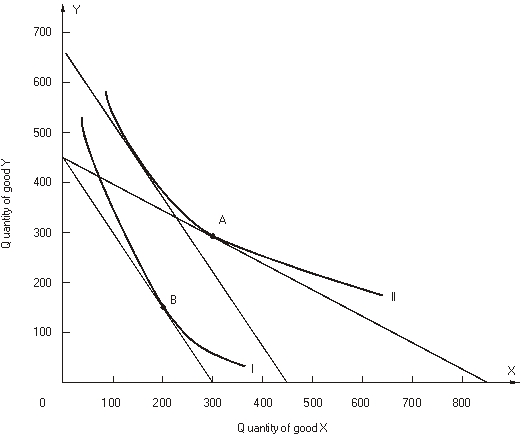 Let the consumer begin in utility-maximizing equilibrium at point A on indifference curve II. Next the price of good X changes so that the consumer moves to a new utility-maximizing equilibrium at point B on indifference curve I.
-Two points on this consumer's demand for good X are PX= $_________ and X = _________; and PX = $_________ and X = _________.
Let the consumer begin in utility-maximizing equilibrium at point A on indifference curve II. Next the price of good X changes so that the consumer moves to a new utility-maximizing equilibrium at point B on indifference curve I.-Two points on this consumer's demand for good X are PX= $_________ and X = _________; and PX = $_________ and X = _________.
Question
The following figure shows a portion of a consumer's indifference map and budget lines. The price of good Y is $17 and the consumer's income is $7,650.
Let the consumer begin in utility-maximizing equilibrium at point A on indifference curve II. Next the price of good X changes so that the consumer moves to a new utility-maximizing equilibrium at point B on indifference curve I.
-The substitution effect of the change in the price of X is _________; the income effect is _________; the total effect is _________.
Let the consumer begin in utility-maximizing equilibrium at point A on indifference curve II. Next the price of good X changes so that the consumer moves to a new utility-maximizing equilibrium at point B on indifference curve I.-The substitution effect of the change in the price of X is _________; the income effect is _________; the total effect is _________.
Question
The following figure shows a portion of a consumer's indifference map and budget lines. The price of good Y is $17 and the consumer's income is $7,650.
Let the consumer begin in utility-maximizing equilibrium at point A on indifference curve II. Next the price of good X changes so that the consumer moves to a new utility-maximizing equilibrium at point B on indifference curve I.
-Good X is a(an) ____________ good.
Let the consumer begin in utility-maximizing equilibrium at point A on indifference curve II. Next the price of good X changes so that the consumer moves to a new utility-maximizing equilibrium at point B on indifference curve I.-Good X is a(an) ____________ good.
Question
The following figure shows a portion of a consumer's indifference map and budget lines. The price of good Y is $7 and the consumer's income is $700.
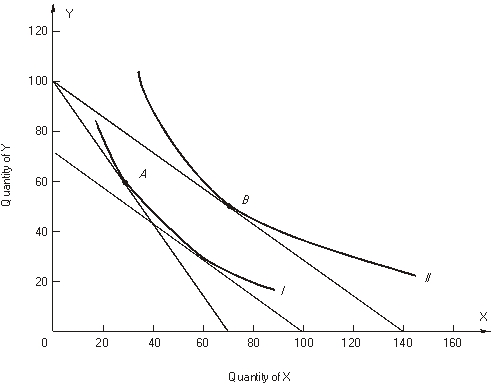 Let the consumer begin in utility maximizing equilibrium at point A on indifference curve I. Next the price of good X changes so that the consumer moves to a new utility maximizing equilibrium at point B on indifference curve II.
-Two points on this consumer's demand for good X are PX = $______ and X = ______; and PX = $______ and X = ______.
Let the consumer begin in utility maximizing equilibrium at point A on indifference curve I. Next the price of good X changes so that the consumer moves to a new utility maximizing equilibrium at point B on indifference curve II.-Two points on this consumer's demand for good X are PX = $______ and X = ______; and PX = $______ and X = ______.
Question
The following figure shows a portion of a consumer's indifference map and budget lines. The price of good Y is $7 and the consumer's income is $700.
Let the consumer begin in utility maximizing equilibrium at point A on indifference curve I. Next the price of good X changes so that the consumer moves to a new utility maximizing equilibrium at point B on indifference curve II.
-The substitution effect of the change in the price of X is ______; the income effect is ______; the total effect is ______.
Let the consumer begin in utility maximizing equilibrium at point A on indifference curve I. Next the price of good X changes so that the consumer moves to a new utility maximizing equilibrium at point B on indifference curve II.-The substitution effect of the change in the price of X is ______; the income effect is ______; the total effect is ______.
Question
The following figure shows a portion of a consumer's indifference map and budget lines. The price of good Y is $7 and the consumer's income is $700.
Let the consumer begin in utility maximizing equilibrium at point A on indifference curve I. Next the price of good X changes so that the consumer moves to a new utility maximizing equilibrium at point B on indifference curve II.
-Good X is a(an) ______ good.
Let the consumer begin in utility maximizing equilibrium at point A on indifference curve I. Next the price of good X changes so that the consumer moves to a new utility maximizing equilibrium at point B on indifference curve II.-Good X is a(an) ______ good.
Question
Question
Question
Question
Question

Unlock Deck
Sign up to unlock the cards in this deck!
Unlock Deck
Unlock Deck
1/52
Play
Full screen (f)
Deck 5: Theory of Consumer Behavior
1
refer to the following:
The price of Y is $10.
-The marginal rate of substitution of X for Y at point C is:
A) 5
B) 2
C) 0.5
D) 0.3
E) none of the above
The price of Y is $10.-The marginal rate of substitution of X for Y at point C is:
A) 5
B) 2
C) 0.5
D) 0.3
E) none of the above
none of the above
2
refer to the following figure:
The consumer's income is $800.
-What are the prices of goods X and Y?
A) = $10, = $8
B)
= $8,
= $10
C)
= $100,
= $80
D)
= $20,
= $60
E)
= $60,
= $20
The consumer's income is $800.-What are the prices of goods X and Y?
A)
= $10, = $8B)
= $8,
= $10
C)
= $100,
= $80
D)
= $20,
= $60
E)
= $60,
= $20
= $8,
= $10
3
refer to the following figure:
The consumer's income is $800.
-Why doesn't the consumer choose the combination of 30X and 56Y at point A?
A) MRS is less than
)
B) MRS is greater than
)
C)
Is greater than
)
D)
Is less than
)
The consumer's income is $800.-Why doesn't the consumer choose the combination of 30X and 56Y at point A?
A) MRS is less than
)
B) MRS is greater than
)
C)
Is greater than
)
D)
Is less than
)
MRS is greater than
)
)
4
An individual's demand curve for X
A) shows how the utility-maximizing choice of X changes as the price of X changes.
B) shows how the individual's preferences change as the price of X changes.
C) shows that the income effect is always negative.
D) both a and b
E) both a and c
A) shows how the utility-maximizing choice of X changes as the price of X changes.
B) shows how the individual's preferences change as the price of X changes.
C) shows that the income effect is always negative.
D) both a and b
E) both a and c
Unlock Deck
Unlock for access to all 52 flashcards in this deck.
Unlock Deck
k this deck
5
If the price of a good decreases, the substitution effect
A) can increase or decrease the quantity of the good demanded.
B) shows the increase in the quantity of the good demanded, holding income constant.
C) shows the increase in the quantity of the good demanded, holding utility constant.
D) must be greater than the income effect.
E) is positive since the quantity of the good increases.
Unlock Deck
Unlock for access to all 52 flashcards in this deck.
Unlock Deck
k this deck
6
If the price of a good decreases, the income effect
A) reinforces the substitution effect if the good is inferior.
B) offsets the substitution effect if the good is normal.
C) shows the change in the quantity demanded of the good, income held constant.
D) a and b
E) none of the above
A) reinforces the substitution effect if the good is inferior.
B) offsets the substitution effect if the good is normal.
C) shows the change in the quantity demanded of the good, income held constant.
D) a and b
E) none of the above
Unlock Deck
Unlock for access to all 52 flashcards in this deck.
Unlock Deck
k this deck
7
When the price of a good changes,
A) the income effect is always positive and the substitution effect is always negative.
B) both the substitution effect and the income effect can be either positive or negative.
C) the income effect can be positive or negative, but the substitution effect is always negative.
D) the income effect can be negative, but in such cases it will never overwhelm the substitution effect.
E) none of the above
Unlock Deck
Unlock for access to all 52 flashcards in this deck.
Unlock Deck
k this deck
8
refer to the following figure that shows the effect of an INCREASE in the price of X.
-The substitution effect of the price change is the change in the consumption of X from
A) 5 to 3.
B) 6 to 3.
C) 6 to 5.
D) 6 to 8.
E) none of the above
-The substitution effect of the price change is the change in the consumption of X from
A) 5 to 3.
B) 6 to 3.
C) 6 to 5.
D) 6 to 8.
E) none of the above
Unlock Deck
Unlock for access to all 52 flashcards in this deck.
Unlock Deck
k this deck
9
refer to the following figure that shows the effect of an INCREASE in the price of X.
-The income effect of the price change is the change in the consumption of X from
A) 5 to 3.
B) 6 to 3.
C) 6 to 5.
D) 6 to 8.
E) none of the above
-The income effect of the price change is the change in the consumption of X from
A) 5 to 3.
B) 6 to 3.
C) 6 to 5.
D) 6 to 8.
E) none of the above
Unlock Deck
Unlock for access to all 52 flashcards in this deck.
Unlock Deck
k this deck
10
refer to the following figure that shows the effect of an INCREASE in the price of X.
-The total effect of the price change is the change in the consumption of X from
A) 5 to 3.
B) 6 to 3.
C) 6 to 5.
D) 6 to 8.
E) none of the above
-The total effect of the price change is the change in the consumption of X from
A) 5 to 3.
B) 6 to 3.
C) 6 to 5.
D) 6 to 8.
E) none of the above
Unlock Deck
Unlock for access to all 52 flashcards in this deck.
Unlock Deck
k this deck
11
refer to the following figure that shows the effect of an INCREASE in the price of X.
-Good X is
A) normal.
B) inferior.
C) a Giffen good.
D) both b and c
-Good X is
A) normal.
B) inferior.
C) a Giffen good.
D) both b and c
Unlock Deck
Unlock for access to all 52 flashcards in this deck.
Unlock Deck
k this deck
12
If a demand curve slopes upward, then
A) the good is inferior.
B) the income effect reinforces the substitution effect.
C) the income effect overwhelms the substitution effect.
D) both a and b
E) both a and c
A) the good is inferior.
B) the income effect reinforces the substitution effect.
C) the income effect overwhelms the substitution effect.
D) both a and b
E) both a and c
Unlock Deck
Unlock for access to all 52 flashcards in this deck.
Unlock Deck
k this deck
13
refer to the following figure:
The consumer's income is $2,600.
-Two points on this consumer's demand for good X are
A)
= $260, X = 140 and
= $130, X = 80.
B)
= $10, X = 260 and
= $20, X = 130.
C)
= $10, X = 140 and
= $10, X = 120.
D)
= $20, X = 80 and
= $10, X = 100.
E) = $10, X = 140 and = $20, X = 80.
The consumer's income is $2,600.-Two points on this consumer's demand for good X are
A)
= $260, X = 140 and
= $130, X = 80.
B)
= $10, X = 260 and
= $20, X = 130.
C)
= $10, X = 140 and
= $10, X = 120.
D)
= $20, X = 80 and
= $10, X = 100.
E)
= $10, X = 140 and = $20, X = 80. Unlock Deck
Unlock for access to all 52 flashcards in this deck.
Unlock Deck
k this deck
14
refer to the following figure:
The consumer's income is $2,600.
-The total effect of the increase in the price of X is
A) X falls 60 units.
B) X rises 60 units.
C) X falls 130 units.
D) X rises 130 units.
E) X falls 20 units.
The consumer's income is $2,600.-The total effect of the increase in the price of X is
A) X falls 60 units.
B) X rises 60 units.
C) X falls 130 units.
D) X rises 130 units.
E) X falls 20 units.
Unlock Deck
Unlock for access to all 52 flashcards in this deck.
Unlock Deck
k this deck
15
refer to the following figure:
The consumer's income is $2,600.
-The substitution effect of the increase in the price of X is (approximately)
A) X rises 20 units.
B) X falls 40 units.
C) X falls 130 units.
D) X falls 16 units.
E) X rises 40 units.
The consumer's income is $2,600.-The substitution effect of the increase in the price of X is (approximately)
A) X rises 20 units.
B) X falls 40 units.
C) X falls 130 units.
D) X falls 16 units.
E) X rises 40 units.
Unlock Deck
Unlock for access to all 52 flashcards in this deck.
Unlock Deck
k this deck
16
refer to the following figure:
The consumer's income is $2,600.
-The income effect of the increase in the price of X is (approximately)
A) X falls 130 units.
B) X rises 60 units.
C) X falls 60 units.
D) X falls 20 units.
E) X rises 20 units.
The consumer's income is $2,600.-The income effect of the increase in the price of X is (approximately)
A) X falls 130 units.
B) X rises 60 units.
C) X falls 60 units.
D) X falls 20 units.
E) X rises 20 units.
Unlock Deck
Unlock for access to all 52 flashcards in this deck.
Unlock Deck
k this deck
17
refer to the following figure:
The consumer's income is $2,600.
-In order to isolate the income and substitution effects what must have happened, temporarily, to the consumer's income (approximately)?
A) $1,200 added to income
B) $600 taken away from income
C) nothing, income is $2,600
D) $2,600 added to income
E) $1,800 taken away from income
The consumer's income is $2,600.-In order to isolate the income and substitution effects what must have happened, temporarily, to the consumer's income (approximately)?
A) $1,200 added to income
B) $600 taken away from income
C) nothing, income is $2,600
D) $2,600 added to income
E) $1,800 taken away from income
Unlock Deck
Unlock for access to all 52 flashcards in this deck.
Unlock Deck
k this deck
18
refer to the following graph:
?
-What is the price of Y?
A) $0.25
B) $4
C) $8
D) $6
E) none of the above
?
-What is the price of Y?
A) $0.25
B) $4
C) $8
D) $6
E) none of the above
Unlock Deck
Unlock for access to all 52 flashcards in this deck.
Unlock Deck
k this deck
19
If the price of good X rises and X is a normal good, then
A) the income effect will induce the consumer to demand less of X and the substitution effect will induce him to demand more.
B) the income effect will induce the consumer to demand more of X and the substitution effect will induce him to demand less.
C) the income and substitution effects will both induce the consumer to demand more of X.
D) the income and substitution effects will both induce the consumer to demand less of X.
Unlock Deck
Unlock for access to all 52 flashcards in this deck.
Unlock Deck
k this deck
20
The Giffen Paradox results whenever
A) the substitution effect is positive.
B) the substitution effect is negative.
C) the income effect is positive.
D) the income effect is negative.
E) none of the above
A) the substitution effect is positive.
B) the substitution effect is negative.
C) the income effect is positive.
D) the income effect is negative.
E) none of the above
Unlock Deck
Unlock for access to all 52 flashcards in this deck.
Unlock Deck
k this deck
21
Demand curves slope downward because
A) the substitution effect, which is always positive, dominates or reinforces the income effect.
B) the substitution effect, which is always negative, dominates or reinforces the income effect.
C) the income effect, which is always positive, dominates or reinforces the substitution effect.
D) the income effect, which is always negative, dominates or reinforces the substitution effect.
Unlock Deck
Unlock for access to all 52 flashcards in this deck.
Unlock Deck
k this deck
22
refer to the following graph:
-The consumer's demand curve for X is
A) D1.
B) D2.
C) D3.
D) D4.
-The consumer's demand curve for X is
A) D1.
B) D2.
C) D3.
D) D4.
Unlock Deck
Unlock for access to all 52 flashcards in this deck.
Unlock Deck
k this deck
23
An individual's demand curve for X
A) shows that the income effect is always negative.
B) depends on how the individual's utility-maximizing choices change when the price of X changes.
C) depends on how the individual's money income changes when the price of X changes.
D) depends on how the individual's preferences change when the price of X changes.
E) both a and c
Unlock Deck
Unlock for access to all 52 flashcards in this deck.
Unlock Deck
k this deck
24
refer to the following graphs:
The price of Y is $15 per unit.
-What is
A) 12
B) 15
C) 20
D) 25
E) none of the above
The price of Y is $15 per unit.
-What is
A) 12
B) 15
C) 20
D) 25
E) none of the above
Unlock Deck
Unlock for access to all 52 flashcards in this deck.
Unlock Deck
k this deck
25
refer to the following graphs:
The price of Y is $15 per unit.
-What is
A) 10
B) 12
C) 18
D) 20
E) none of the above
The price of Y is $15 per unit.
-What is
A) 10
B) 12
C) 18
D) 20
E) none of the above
Unlock Deck
Unlock for access to all 52 flashcards in this deck.
Unlock Deck
k this deck
26
If the total utility of five units of X is 45 units of utility and the marginal utility of the fifth unit is 3, then
A) the total utility of four units is 42 units.
B) the demand curve is likely to be upward sloping.
C) the good is a Giffen good.
D) the substitution effect is equal to 3.
A) the total utility of four units is 42 units.
B) the demand curve is likely to be upward sloping.
C) the good is a Giffen good.
D) the substitution effect is equal to 3.
Unlock Deck
Unlock for access to all 52 flashcards in this deck.
Unlock Deck
k this deck
27
Fill-in-the-Blank
-Along an indifference curve ____________ is constant.
-Along an indifference curve ____________ is constant.
Unlock Deck
Unlock for access to all 52 flashcards in this deck.
Unlock Deck
k this deck
28
Fill-in-the-Blank
-The rate at which a consumer is willing to substitute one good for another, holding utility constant, is given by the ____________ of an indifference curve. This rate is called the _________________________________.
-The rate at which a consumer is willing to substitute one good for another, holding utility constant, is given by the ____________ of an indifference curve. This rate is called the _________________________________.
Unlock Deck
Unlock for access to all 52 flashcards in this deck.
Unlock Deck
k this deck
29
Fill-in-the-Blank
-If at a given combination of X and Y, a consumer's marginal rate of substitution is 4, this means that the consumer is willing to give up ______ units of Y for another X or ______ units of X for another Y.
-If at a given combination of X and Y, a consumer's marginal rate of substitution is 4, this means that the consumer is willing to give up ______ units of Y for another X or ______ units of X for another Y.
Unlock Deck
Unlock for access to all 52 flashcards in this deck.
Unlock Deck
k this deck
30
Fill-in-the-Blank
-If a consumer is choosing the levels of goods X and Y in order to maximize utility with a given budget the _________ equals the ____________ ratio of the goods.
-If a consumer is choosing the levels of goods X and Y in order to maximize utility with a given budget the _________ equals the ____________ ratio of the goods.
Unlock Deck
Unlock for access to all 52 flashcards in this deck.
Unlock Deck
k this deck
31
Fill-in-the-Blank
-The rate at which a consumer can substitute one good for another in the market is given by the ______ of the budget line and is equal to the __________ratio of the two goods.
-The rate at which a consumer can substitute one good for another in the market is given by the ______ of the budget line and is equal to the __________ratio of the two goods.
Unlock Deck
Unlock for access to all 52 flashcards in this deck.
Unlock Deck
k this deck
32
Sally consumes only two goods, A and B. The prices are PA = $10 and PB = $15. For the last units of each good the marginal utilities are MUA = 30 and MUB = 40. Sally should consume more ______ and less ______ because ____________ is greater than ____________. When Sally reaches equilibrium her MRS will be ______.
Unlock Deck
Unlock for access to all 52 flashcards in this deck.
Unlock Deck
k this deck
33
A. Demand curves slope downward because the __________________ effect of a price change is negative and dominates the _____________________ effect, which can be either positive or negative. Thus the ______ effect is negative.
B. Market demand is the _____________ summation of the ______________ of all the consumers in the market.
B. Market demand is the _____________ summation of the ______________ of all the consumers in the market.
Unlock Deck
Unlock for access to all 52 flashcards in this deck.
Unlock Deck
k this deck
34
The following questions refer to the following graph of a consumer's indifference curve.
-What is the consumer's marginal rate of substitution between points A and C? ______. Moving between these points, the consumer is willing to give up ______ units of Y for another X or ______ units of X for another Y.
-What is the consumer's marginal rate of substitution between points A and C? ______. Moving between these points, the consumer is willing to give up ______ units of Y for another X or ______ units of X for another Y.
Unlock Deck
Unlock for access to all 52 flashcards in this deck.
Unlock Deck
k this deck
35
The following questions refer to the following graph of a consumer's indifference curve.
-What is the consumer's marginal rate of substitution between points C and B? ______. Moving between these points the consumer is willing to give up ______ units of Y for another X or ______ units of X for another Y.
-What is the consumer's marginal rate of substitution between points C and B? ______. Moving between these points the consumer is willing to give up ______ units of Y for another X or ______ units of X for another Y.
Unlock Deck
Unlock for access to all 52 flashcards in this deck.
Unlock Deck
k this deck
36
The following questions refer to the following graph of a consumer's indifference curve.
-At point C the consumer's marginal rate of substitution at point is approximately ______. This means that the consumer is willing to substitute at a rate of ______ units of Y for one more X or ______ X for one Y.
-At point C the consumer's marginal rate of substitution at point is approximately ______. This means that the consumer is willing to substitute at a rate of ______ units of Y for one more X or ______ X for one Y.
Unlock Deck
Unlock for access to all 52 flashcards in this deck.
Unlock Deck
k this deck
37
Use the following graph showing two budget lines, LR and LZ to answer the following questions. The consumer's income is $720.
-For budget line LR the price of Y is $______ and the price of X is $______. The equation for budget line LR is ________________________.
-For budget line LR the price of Y is $______ and the price of X is $______. The equation for budget line LR is ________________________.
Unlock Deck
Unlock for access to all 52 flashcards in this deck.
Unlock Deck
k this deck
38
Use the following graph showing two budget lines, LR and LZ to answer the following questions. The consumer's income is $720.
-For budget line LM the price of Y is $______ and the price of X is $______. The equation for budget line LM is _____________________.
-For budget line LM the price of Y is $______ and the price of X is $______. The equation for budget line LM is _____________________.
Unlock Deck
Unlock for access to all 52 flashcards in this deck.
Unlock Deck
k this deck
39
Use the following graph showing a consumer's budget line and some indifference curves to answer the following questions. The consumer's income is $600.
-The price of Y is $______ and the price of X is $______. The consumer should buy _____ unit of X and ______ units of Y. In equilibrium the marginal rate of substitution is _____.
-The price of Y is $______ and the price of X is $______. The consumer should buy _____ unit of X and ______ units of Y. In equilibrium the marginal rate of substitution is _____.
Unlock Deck
Unlock for access to all 52 flashcards in this deck.
Unlock Deck
k this deck
40
Use the following graph showing a consumer's budget line and some indifference curves to answer the following questions. The consumer's income is $600.
-If the consumer is buying the combination at point A, the MRS is ________________ (greater, less) than the price _________, so the consumer should buy more ______ and less ______ in order to increase utility. The consumer would buy no combination on indifference curve III because _______________.
-If the consumer is buying the combination at point A, the MRS is ________________ (greater, less) than the price _________, so the consumer should buy more ______ and less ______ in order to increase utility. The consumer would buy no combination on indifference curve III because _______________.
Unlock Deck
Unlock for access to all 52 flashcards in this deck.
Unlock Deck
k this deck
41
Use the following graph showing a consumer's budget line and some indifference curves to answer the following questions. The consumer's income is $600.
-If the consumer is buying the combination at point B, the MRS is ______ than the price ____________, so the consumer should buy more ______ and less ______ to increase utility. At point B, is ____________ than the .
-If the consumer is buying the combination at point B, the MRS is ______ than the price ____________, so the consumer should buy more ______ and less ______ to increase utility. At point B,
is ____________ than the . Unlock Deck
Unlock for access to all 52 flashcards in this deck.
Unlock Deck
k this deck
42
The following figure shows a portion of a consumer's indifference map and budget lines. The price of good Y is $17 and the consumer's income is $7,650.
Let the consumer begin in utility-maximizing equilibrium at point A on indifference curve II. Next the price of good X changes so that the consumer moves to a new utility-maximizing equilibrium at point B on indifference curve I.
-Two points on this consumer's demand for good X are PX= $_________ and X = _________; and PX = $_________ and X = _________.
Let the consumer begin in utility-maximizing equilibrium at point A on indifference curve II. Next the price of good X changes so that the consumer moves to a new utility-maximizing equilibrium at point B on indifference curve I.-Two points on this consumer's demand for good X are PX= $_________ and X = _________; and PX = $_________ and X = _________.
Unlock Deck
Unlock for access to all 52 flashcards in this deck.
Unlock Deck
k this deck
43
The following figure shows a portion of a consumer's indifference map and budget lines. The price of good Y is $17 and the consumer's income is $7,650.
Let the consumer begin in utility-maximizing equilibrium at point A on indifference curve II. Next the price of good X changes so that the consumer moves to a new utility-maximizing equilibrium at point B on indifference curve I.
-The substitution effect of the change in the price of X is _________; the income effect is _________; the total effect is _________.
Let the consumer begin in utility-maximizing equilibrium at point A on indifference curve II. Next the price of good X changes so that the consumer moves to a new utility-maximizing equilibrium at point B on indifference curve I.-The substitution effect of the change in the price of X is _________; the income effect is _________; the total effect is _________.
Unlock Deck
Unlock for access to all 52 flashcards in this deck.
Unlock Deck
k this deck
44
The following figure shows a portion of a consumer's indifference map and budget lines. The price of good Y is $17 and the consumer's income is $7,650.
Let the consumer begin in utility-maximizing equilibrium at point A on indifference curve II. Next the price of good X changes so that the consumer moves to a new utility-maximizing equilibrium at point B on indifference curve I.
-Good X is a(an) ____________ good.
Let the consumer begin in utility-maximizing equilibrium at point A on indifference curve II. Next the price of good X changes so that the consumer moves to a new utility-maximizing equilibrium at point B on indifference curve I.-Good X is a(an) ____________ good.
Unlock Deck
Unlock for access to all 52 flashcards in this deck.
Unlock Deck
k this deck
45
The following figure shows a portion of a consumer's indifference map and budget lines. The price of good Y is $7 and the consumer's income is $700.
Let the consumer begin in utility maximizing equilibrium at point A on indifference curve I. Next the price of good X changes so that the consumer moves to a new utility maximizing equilibrium at point B on indifference curve II.
-Two points on this consumer's demand for good X are PX = $______ and X = ______; and PX = $______ and X = ______.
Let the consumer begin in utility maximizing equilibrium at point A on indifference curve I. Next the price of good X changes so that the consumer moves to a new utility maximizing equilibrium at point B on indifference curve II.-Two points on this consumer's demand for good X are PX = $______ and X = ______; and PX = $______ and X = ______.
Unlock Deck
Unlock for access to all 52 flashcards in this deck.
Unlock Deck
k this deck
46
The following figure shows a portion of a consumer's indifference map and budget lines. The price of good Y is $7 and the consumer's income is $700.
Let the consumer begin in utility maximizing equilibrium at point A on indifference curve I. Next the price of good X changes so that the consumer moves to a new utility maximizing equilibrium at point B on indifference curve II.
-The substitution effect of the change in the price of X is ______; the income effect is ______; the total effect is ______.
Let the consumer begin in utility maximizing equilibrium at point A on indifference curve I. Next the price of good X changes so that the consumer moves to a new utility maximizing equilibrium at point B on indifference curve II.-The substitution effect of the change in the price of X is ______; the income effect is ______; the total effect is ______.
Unlock Deck
Unlock for access to all 52 flashcards in this deck.
Unlock Deck
k this deck
47
The following figure shows a portion of a consumer's indifference map and budget lines. The price of good Y is $7 and the consumer's income is $700.
Let the consumer begin in utility maximizing equilibrium at point A on indifference curve I. Next the price of good X changes so that the consumer moves to a new utility maximizing equilibrium at point B on indifference curve II.
-Good X is a(an) ______ good.
Let the consumer begin in utility maximizing equilibrium at point A on indifference curve I. Next the price of good X changes so that the consumer moves to a new utility maximizing equilibrium at point B on indifference curve II.-Good X is a(an) ______ good.
Unlock Deck
Unlock for access to all 52 flashcards in this deck.
Unlock Deck
k this deck
48
The marginal rate of substitution of X for Y is 3, the price of X is $4, and the price of Y is $2.
-The consumer is willing to give up ______ units of Y to obtain another X. The consumer is willing to give up ______ units of X to obtain another Y.
-The consumer is willing to give up ______ units of Y to obtain another X. The consumer is willing to give up ______ units of X to obtain another Y.
Unlock Deck
Unlock for access to all 52 flashcards in this deck.
Unlock Deck
k this deck
49
The marginal rate of substitution of X for Y is 3, the price of X is $4, and the price of Y is $2.
-The consumer must give up ______ units of Y to obtain another X. The consumer must give up ______ units of X to obtain another Y. At what rate is the consumer able to substitute X for Y in the market? ______.
-The consumer must give up ______ units of Y to obtain another X. The consumer must give up ______ units of X to obtain another Y. At what rate is the consumer able to substitute X for Y in the market? ______.
Unlock Deck
Unlock for access to all 52 flashcards in this deck.
Unlock Deck
k this deck
50
The marginal rate of substitution of X for Y is 3, the price of X is $4, and the price of Y is $2.
-Is the consumer making the utility maximizing choice? ______. If not, the consumer should purchase more ______ and less ______.
-Is the consumer making the utility maximizing choice? ______. If not, the consumer should purchase more ______ and less ______.
Unlock Deck
Unlock for access to all 52 flashcards in this deck.
Unlock Deck
k this deck
51
F A. The rate at which a consumer is able to substitute one good for another is determined by the ______. The rate at which a consumer is willing to substitute one good for another is given by the ______.
B. If a consumer is choosing a bundle of goods that maximizes utility subject to a budget constraint the ratio of ______ to ______ is the same for every good and the ______ equals the ______ ratio for every pair of goods.
C. A consumer's demand curve for a good shows the ______ choice of the good at each ______.
Unlock Deck
Unlock for access to all 52 flashcards in this deck.
Unlock Deck
k this deck
52
F Mary is consuming 3 hot dogs and 2 Cokes at the Bucs game. The marginal utility of the third hot dog is 60 utils and the marginal utility of the second Coke is 180 utils. The price of a hot dog is $1 and the price of a Coke is $4. From the information given, we can see that Mary consumed too many ________________ (hot dogs, Cokes) and too few ________________ (hot dogs, Cokes).
Unlock Deck
Unlock for access to all 52 flashcards in this deck.
Unlock Deck
k this deck
Unlock Deck
Unlock for access to all 52 flashcards in this deck.


