Deck 9: Understanding Sampling Distributions: Statistics As Random Variables
Full screen (f)
Question
Question
Question
Question
Question
Question
Question
Question
Question
Question
Question
Question
Question
Question
Question
Question
Question
Question
Question
Question
Question
Question
Question
Question
Question
Question
Question
Question
Question
Question
Question
Question
Question
Use the following information for questions:
A Statistics instructor asked a random sample of female and male students how many hours they exercise each week. Minitab output for a comparison of females and males is shown below.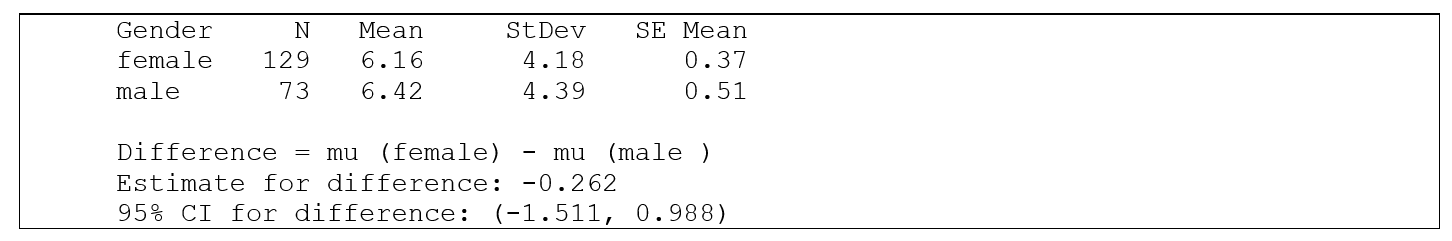
-This is an example of data collected using
A) paired data.
B) independent samples.
C) a binomial experiment.
D) matched pairs.
Question
Use the following information for questions:
A Statistics instructor asked a random sample of female and male students how many hours they exercise each week. Minitab output for a comparison of females and males is shown below.
-What is the correct notation for the parameter that is estimated by the confidence interval given in the output?
A) p
B) p1 -p2
C)
D) 1 - 2
Question
Question
Question
Question
Question
Question
Question
Question
Question
Question
Question
Question
Question
Question
Question
Question
Question
Question
Question
Question
Question
Question
Question
Question
Question
Question
Question
Question
Question
Question
Question
Question
Question
Question
Question
Use the following information for questions:
Every student taking elementary statistics at a large university (1,100 students) participated in a class project by rolling a 6-sided die 100 times. Each individual student determined the proportion of his or her 100 rolls for which the result was a "1". The instructor plans to draw a histogram of the 1,100 sample proportions.
-What will be the approximate standard deviation for the 1,100 sample proportions?
A)
B)
C)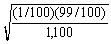
D)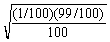
Question
Question
Question
Question
Question
Use the following information for questions:
In a pond with a large population of turtles, the percent of three different types of turtles are presented in the table below.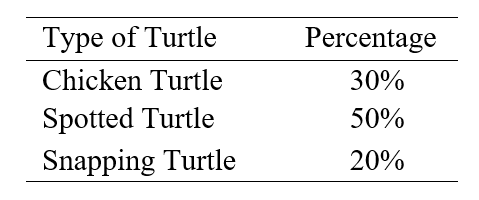 A random sample of 100 turtles is taken from the pond.
-What is the standard deviation for the sample proportion of chicken turtles?
In a pond with a large population of turtles, the percent of three different types of turtles are presented in the table below.
A random sample of 100 turtles is taken from the pond.-What is the standard deviation for the sample proportion of chicken turtles?
Question
Use the following information for questions:
In a pond with a large population of turtles, the percent of three different types of turtles are presented in the table below. A random sample of 100 turtles is taken from the pond.
-What is the standard deviation for the sample proportion of spotted turtles?
In a pond with a large population of turtles, the percent of three different types of turtles are presented in the table below.
A random sample of 100 turtles is taken from the pond.-What is the standard deviation for the sample proportion of spotted turtles?
Question
Use the following information for questions:
In a pond with a large population of turtles, the percent of three different types of turtles are presented in the table below. A random sample of 100 turtles is taken from the pond.
-What is the standard deviation for the sample proportion of snapping turtles?
In a pond with a large population of turtles, the percent of three different types of turtles are presented in the table below.
A random sample of 100 turtles is taken from the pond.-What is the standard deviation for the sample proportion of snapping turtles?
Question
Use the following information for questions:
In a pond with a large population of turtles, the percent of three different types of turtles are presented in the table below. A random sample of 100 turtles is taken from the pond.
-What is the approximate probability that the sample proportion of chicken turtles is lower than 0.25?
In a pond with a large population of turtles, the percent of three different types of turtles are presented in the table below.
A random sample of 100 turtles is taken from the pond.-What is the approximate probability that the sample proportion of chicken turtles is lower than 0.25?
Question
Use the following information for questions:
In a pond with a large population of turtles, the percent of three different types of turtles are presented in the table below. A random sample of 100 turtles is taken from the pond.
-What is the approximate probability that the sample proportion of spotted turtles falls between 45% and 55%?
In a pond with a large population of turtles, the percent of three different types of turtles are presented in the table below.
A random sample of 100 turtles is taken from the pond.-What is the approximate probability that the sample proportion of spotted turtles falls between 45% and 55%?
Question
Use the following information for questions:
In a pond with a large population of turtles, the percent of three different types of turtles are presented in the table below. A random sample of 100 turtles is taken from the pond.
-What is the approximate probability that the sample proportion of snapping turtles is higher than 0.25?
In a pond with a large population of turtles, the percent of three different types of turtles are presented in the table below.
A random sample of 100 turtles is taken from the pond.-What is the approximate probability that the sample proportion of snapping turtles is higher than 0.25?
Question

Unlock Deck
Sign up to unlock the cards in this deck!
Unlock Deck
Unlock Deck
1/231
Play
Full screen (f)
Deck 9: Understanding Sampling Distributions: Statistics As Random Variables
1
Use the following information for questions:
In each situation, indicate whether the value given in bold print is .
-Of 10 students sampled from a class of 200, 8 (80%) said they would like the school library to have longer hours.
A) Statistic
B) Parameter
In each situation, indicate whether the value given in bold print is .
-Of 10 students sampled from a class of 200, 8 (80%) said they would like the school library to have longer hours.
A) Statistic
B) Parameter
Statistic
2
Use the following information for questions:
In each situation, indicate whether the value given in bold print is .
-75% of all students at a school are in favor of more bicycle parking spaces on campus.
A) Statistic
B) Parameter
In each situation, indicate whether the value given in bold print is .
-75% of all students at a school are in favor of more bicycle parking spaces on campus.
A) Statistic
B) Parameter
Parameter
3
Use the following information for questions:
In each situation, indicate whether the value given in bold print is .
-Dyscalculia is a learning disability involving innate difficulty in learning or comprehending mathematics. It is akin to dyslexia and can include confusion about math symbols. Dyscalculia can also occur as the result of some types of brain injury. Dyscalculia occurs in people across the whole IQ range and affects roughly 5% of all Americans.
A) Statistic
B) Parameter
Parameter
4
Use the following information for questions:
In each situation, indicate whether the value given in bold print is .
-A customs inspector sampled 5 boxes among 20 boxes being shipped from out of the country. He found that one of the five boxes (20%) contained an illegal food item.
A) Statistic
B) Parameter
In each situation, indicate whether the value given in bold print is .
-A customs inspector sampled 5 boxes among 20 boxes being shipped from out of the country. He found that one of the five boxes (20%) contained an illegal food item.
A) Statistic
B) Parameter
Unlock Deck
Unlock for access to all 231 flashcards in this deck.
Unlock Deck
k this deck
5
Use the following information for questions:
In each situation, indicate whether the value given in bold print is .
-Based on the 2000 Census, 39.5% of the California population of residents who are over 5 years old speak languages other than English at home.
A) Statistic
B) Parameter
In each situation, indicate whether the value given in bold print is .
-Based on the 2000 Census, 39.5% of the California population of residents who are over 5 years old speak languages other than English at home.
A) Statistic
B) Parameter
Unlock Deck
Unlock for access to all 231 flashcards in this deck.
Unlock Deck
k this deck
6
Use the following information for questions:
In each situation, indicate whether the value given in bold print is .
-A 2009 US study found the average age of formal autism diagnosis was 5.7 years, far above the recommended age of 30 months, and that 27% of children remained undiagnosed at age 8 years.
A) Statistic
B) Parameter
In each situation, indicate whether the value given in bold print is .
-A 2009 US study found the average age of formal autism diagnosis was 5.7 years, far above the recommended age of 30 months, and that 27% of children remained undiagnosed at age 8 years.
A) Statistic
B) Parameter
Unlock Deck
Unlock for access to all 231 flashcards in this deck.
Unlock Deck
k this deck
7
Statistic is to sample as parameter is to
A) population.
B) sample size.
C) mean.
D) estimate.
A) population.
B) sample size.
C) mean.
D) estimate.
Unlock Deck
Unlock for access to all 231 flashcards in this deck.
Unlock Deck
k this deck
8
Use the following information for questions:
In each situation, indicate whether it would make more sense to find a confidence interval for the population parameter or to conduct a hypothesis test for a specific null value.
-The school board wishes to find out if the newly adapted teaching method for K-5 math has resulted in higher average grades.
A) Confidence interval
B) Hypothesis test
Unlock Deck
Unlock for access to all 231 flashcards in this deck.
Unlock Deck
k this deck
9
Use the following information for questions:
In each situation, indicate whether it would make more sense to find a confidence interval for the population parameter or to conduct a hypothesis test for a specific null value.
-A consumer agency wishes to find out how much more private hospitals and medical clinics charge for certain procedures than the large (research) hospitals.
A) Confidence interval
B) Hypothesis test
Unlock Deck
Unlock for access to all 231 flashcards in this deck.
Unlock Deck
k this deck
10
Use the following information for questions:
In each situation, indicate whether it would make more sense to find a confidence interval for the population parameter or to conduct a hypothesis test for a specific null value.
-A weight-loss clinic wishes to determine if a certain popular diet actually results in weight-loss.
A) Confidence interval
B) Hypothesis test
Unlock Deck
Unlock for access to all 231 flashcards in this deck.
Unlock Deck
k this deck
11
Use the following information for questions:
In each situation, indicate whether it would make more sense to find a confidence interval for the population parameter or to conduct a hypothesis test for a specific null value.
-A weight-loss clinic wishes to determine how much more weight patients lose when they add both diet and exercise to their daily routines compared to when they just diet.
A) Confidence interval
B) Hypothesis test
Unlock Deck
Unlock for access to all 231 flashcards in this deck.
Unlock Deck
k this deck
12
Use the following information for questions:
In each situation, indicate whether it would make more sense to find a confidence interval for the population parameter or to conduct a hypothesis test for a specific null value. If your answer is "a hypothesis test," specify the null value that you would test.
-Dyslexia is a broad term defining a learning disability that impairs a person's ability to read, speak, and spell. It is believed that dyslexia can affect between 5 to 10 percent of the population although there have been no studies to indicate an accurate percentage.
Unlock Deck
Unlock for access to all 231 flashcards in this deck.
Unlock Deck
k this deck
13
Use the following information for questions:
In each situation, indicate whether it would make more sense to find a confidence interval for the population parameter or to conduct a hypothesis test for a specific null value. If your answer is "a hypothesis test," specify the null value that you would test.
-The University of Wisconsin is conducting a study to determine if the average salary of college lecturers in the natural sciences is higher than that of lecturers in the social sciences.
Unlock Deck
Unlock for access to all 231 flashcards in this deck.
Unlock Deck
k this deck
14
Use the following information for questions:
In each situation, indicate whether it would make more sense to find a confidence interval for the population parameter or to conduct a hypothesis test for a specific null value. If your answer is "a hypothesis test," specify the null value that you would test.
-A high school teacher is interested to know if students who take a foreign language will get higher grades if their final exam is an oral exam instead of a written exam. The following year he asks all of the Spanish teachers to give their students an oral exam at the end of the course. The average exam score in the previous years was 68 (out of a possible 100 points).
Unlock Deck
Unlock for access to all 231 flashcards in this deck.
Unlock Deck
k this deck
15
Explain what the term "statistical significance" means in hypothesis testing.
Unlock Deck
Unlock for access to all 231 flashcards in this deck.
Unlock Deck
k this deck
16
Use the following information for questions:
According to a recent survey, teenagers who eat with their families at least five times a week are more likely to get better grades in school and much less likely to have substance abuse problems. Two groups of teenagers were studied: those who eat with their families at least five times a week and those who don't. The difference in school grades and the difference in likelihood to have substance abuse problems were both found to be statistically significant.
-What would have been the null value in this scenario for the difference in school grades between the two groups?
Unlock Deck
Unlock for access to all 231 flashcards in this deck.
Unlock Deck
k this deck
17
Use the following information for questions:
According to a recent survey, teenagers who eat with their families at least five times a week are more likely to get better grades in school and much less likely to have substance abuse problems. Two groups of teenagers were studied: those who eat with their families at least five times a week and those who don't. The difference in school grades and the difference in likelihood to have substance abuse problems were both found to be statistically significant.
-When comparing the likelihood to have substance abuse problems between the two groups, what does statistical significance mean?
Unlock Deck
Unlock for access to all 231 flashcards in this deck.
Unlock Deck
k this deck
18
Use the following information for questions:
Contradicting some previous research, a new study finds that frequent use of painkillers does not substantially increase a healthy man's risk of developing hypertension.
-What would have been the null value in this scenario for the difference in proportions of men who developed hypertension (frequently use painkiller - not frequently use painkiller)?
Unlock Deck
Unlock for access to all 231 flashcards in this deck.
Unlock Deck
k this deck
19
Use the following information for questions:
Contradicting some previous research, a new study finds that frequent use of painkillers does not substantially increase a healthy man's risk of developing hypertension.
-The study finds that the observed difference between the two groups was not statistically significant. Explain in your own words what that means.
Unlock Deck
Unlock for access to all 231 flashcards in this deck.
Unlock Deck
k this deck
20
Use the following information for questions:
For each study, decide if the two samples are :
-A group of 50 students each measured the length of their right arm and the length of their left arm. The average right arm lengths were compared to the average left arm lengths.
A) Independent samples
B) Paired samples
For each study, decide if the two samples are :
-A group of 50 students each measured the length of their right arm and the length of their left arm. The average right arm lengths were compared to the average left arm lengths.
A) Independent samples
B) Paired samples
Unlock Deck
Unlock for access to all 231 flashcards in this deck.
Unlock Deck
k this deck
21
Use the following information for questions:
For each study, decide if the two samples are :
-A study compared the average number of courses taken by a random sample of 100 freshmen at a university with the average number of courses taken by a separate random sample of 50 freshmen at a community college.
A) Independent samples
B) Paired samples
Unlock Deck
Unlock for access to all 231 flashcards in this deck.
Unlock Deck
k this deck
22
Use the following information for questions:
For each study, decide if the two samples are :
-A group of 100 students were randomly assigned to receive vitamin C (50 students) or a placebo (50 students). The groups were followed for 2 weeks and the proportions of students with colds were compared.
A) Independent samples
B) Paired samples
For each study, decide if the two samples are :
-A group of 100 students were randomly assigned to receive vitamin C (50 students) or a placebo (50 students). The groups were followed for 2 weeks and the proportions of students with colds were compared.
A) Independent samples
B) Paired samples
Unlock Deck
Unlock for access to all 231 flashcards in this deck.
Unlock Deck
k this deck
23
Use the following information for questions:
For each study, decide if the two samples are :
-A group of 50 students had their blood pressures measured before and after watching a movie containing violence. The mean blood pressure before the movie was compared with the mean pressure after the movie.
A) Independent samples
B) Paired samples
For each study, decide if the two samples are :
-A group of 50 students had their blood pressures measured before and after watching a movie containing violence. The mean blood pressure before the movie was compared with the mean pressure after the movie.
A) Independent samples
B) Paired samples
Unlock Deck
Unlock for access to all 231 flashcards in this deck.
Unlock Deck
k this deck
24
Use the following information for questions:
For each study, decide if the two samples are :
-In a random sample of 100 students (60 women and 40 men), the average hours of sleep during finals week were compared.
A) Independent samples
B) Paired samples
For each study, decide if the two samples are :
-In a random sample of 100 students (60 women and 40 men), the average hours of sleep during finals week were compared.
A) Independent samples
B) Paired samples
Unlock Deck
Unlock for access to all 231 flashcards in this deck.
Unlock Deck
k this deck
25
Use the following information for questions:
For each study, decide if the two samples are :
-In a random sample of 100 students, the change in hours of sleep for each student during and after finals week were compared.
A) Independent samples
B) Paired samples
For each study, decide if the two samples are :
-In a random sample of 100 students, the change in hours of sleep for each student during and after finals week were compared.
A) Independent samples
B) Paired samples
Unlock Deck
Unlock for access to all 231 flashcards in this deck.
Unlock Deck
k this deck
26
Use the following information for questions:
For each study, decide if the two samples are :
-A random sample of high school seniors is asked how often (times per week) they eat at a fast-food restaurant. A year later, when the students are freshmen in college, they are asked the same question. The frequencies during the senior year of high school and the freshman year in college are compared.
A) Independent samples
B) Paired samples
Unlock Deck
Unlock for access to all 231 flashcards in this deck.
Unlock Deck
k this deck
27
Use the following information for questions:
For each study, decide if the two samples are :
-In an experiment, students taking French are randomly divided into two groups. Half of the students first take a written exam and a week later an oral exam. The other half of the students take the exams in reverse order. The grades of the oral exam were then compared to the grades of the written exam.
A) Independent samples
B) Paired samples
Unlock Deck
Unlock for access to all 231 flashcards in this deck.
Unlock Deck
k this deck
28
Which one of the following ways of collecting data would not result in paired data?
A) Each person is measured twice.
B) Similar individuals are paired prior to an experiment. Each individual in a pair receives a different treatment.
C) Two different variables are measured for each person.
D) Two independent samples are selected and the same response variable is compared between samples.
Unlock Deck
Unlock for access to all 231 flashcards in this deck.
Unlock Deck
k this deck
29
Which of the following is an example of paired data?
A) A random sample of students is asked how much money they made during the past summer. Results for males and females are compared.
B) A randomized experiment is done in which volunteers who want to lose weight are randomly assigned to either follow a specified diet or participate in an exercise program for 6 months. At the end of the study the two groups are compared to see which one had a higher proportion of people drop out of the study.
C) An observational study is conducted on a random sample of married couples to compare the average number of hours worked per week for the husband and the wife.
D) A random sample of students is asked on the first day of the quarter how many hours they slept the night before. The question is repeated for a new random sample of students on the first day of finals week.
Unlock Deck
Unlock for access to all 231 flashcards in this deck.
Unlock Deck
k this deck
30
Which of the following is an example of a difference in two proportions based on independent samples?
A) A random sample of 1000 voters is asked who they plan to vote for in the upcoming election. The difference is found between the proportion of voters who plan to vote for the Republican candidate and the proportion of voters who plan to vote for the Democratic candidate.
B) Each student in a random sample of 500 sophomores and a random sample of 500 seniors is asked what proportion of classes he or she skips in a typical quarter. The difference in the average responses for the two groups is found.
C) A random sample of 800 adults in the US in 1999 was asked if they support the legalization of marijuana, and another random sample of 800 adults was asked the same question is 2009. The difference in the proportions of adults who supported it in 1999 and 2009 is found.
D) None of the above is an example of a difference in two proportions based on independent samples.
Unlock Deck
Unlock for access to all 231 flashcards in this deck.
Unlock Deck
k this deck
31
Use the following information for questions:
Many undergraduate students are thinking about getting a graduate degree. Do male and female students have equal opinions about this? A survey of undergraduate students at public universities in the state of California revealed the following results: Out of 265 female students, 131 were seriously thinking about applying to graduate school. Out of 233 male students, 130 were seriously thinking about applying to graduate school. We wish to compare the proportions of male and female students who are thinking about getting a graduate degree by calculating a confidence interval for the difference between males and females.
-What is the correct notation for the parameter that is estimated by the confidence interval?
A) -
B) -
C) -
D) -
Unlock Deck
Unlock for access to all 231 flashcards in this deck.
Unlock Deck
k this deck
32
Use the following information for questions:
Many undergraduate students are thinking about getting a graduate degree. Do male and female students have equal opinions about this? A survey of undergraduate students at public universities in the state of California revealed the following results: Out of 265 female students, 131 were seriously thinking about applying to graduate school. Out of 233 male students, 130 were seriously thinking about applying to graduate school. We wish to compare the proportions of male and female students who are thinking about getting a graduate degree by calculating a confidence interval for the difference between males and females.
-What is the correct notation for the difference ?
A) -
B) -
C) -
D) -
Unlock Deck
Unlock for access to all 231 flashcards in this deck.
Unlock Deck
k this deck
33
Use the following information for questions:
A Statistics instructor asked a random sample of female and male students how many hours they exercise each week. Minitab output for a comparison of females and males is shown below.
-This is an example of data collected using
A) paired data.
B) independent samples.
C) a binomial experiment.
D) matched pairs.
Unlock Deck
Unlock for access to all 231 flashcards in this deck.
Unlock Deck
k this deck
34
Use the following information for questions:
A Statistics instructor asked a random sample of female and male students how many hours they exercise each week. Minitab output for a comparison of females and males is shown below.
-What is the correct notation for the parameter that is estimated by the confidence interval given in the output?
A) p
B) p1 -p2
C)
D) 1 - 2
Unlock Deck
Unlock for access to all 231 flashcards in this deck.
Unlock Deck
k this deck
35
Which statement is true about p and ?
A) They are both parameters.
B) They are both statistics.
C) p is a parameter and is a statistic.
D) is a parameter and p is a statistic.
A) They are both parameters.
B) They are both statistics.
C) p is a parameter and is a statistic.
D) is a parameter and p is a statistic.
Unlock Deck
Unlock for access to all 231 flashcards in this deck.
Unlock Deck
k this deck
36
Which statement is true about and ?
A) They are both parameters.
B) They are both statistics.
C) is a parameter and is a statistic.
D) is a parameter and is a statistic.
A) They are both parameters.
B) They are both statistics.
C) is a parameter and is a statistic.
D) is a parameter and is a statistic.
Unlock Deck
Unlock for access to all 231 flashcards in this deck.
Unlock Deck
k this deck
37
Suppose that a polling organization surveys n = 400 people about whether they think the federal government should give financial aid to the airlines to help them avoid bankruptcy. In the poll, 300 people say that the government should provide aid to the airlines. Which choice gives the correct notation and value for the sample proportion in this survey?
A) = 0.30
B) p = 0.30
C) = 0.75
D) p =0.75
A) = 0.30
B) p = 0.30
C) = 0.75
D) p =0.75
Unlock Deck
Unlock for access to all 231 flashcards in this deck.
Unlock Deck
k this deck
38
Suppose we select a random sample of n = 100 students and find that the proportion of students who said they believe in love at first sight is 0.43. Which statement is not necessarily true?
A) There were 43 students in the sample who said they believe in love at first sight.
B) Based on the information provided by the sample, we cannot determine exactly what proportion of the population would say they believe in love at first sight.
C) = 0.43
D) p = 0.43
A) There were 43 students in the sample who said they believe in love at first sight.
B) Based on the information provided by the sample, we cannot determine exactly what proportion of the population would say they believe in love at first sight.
C) = 0.43
D) p = 0.43
Unlock Deck
Unlock for access to all 231 flashcards in this deck.
Unlock Deck
k this deck
39
Suppose you decide to use the 40 students in your Introduction to Philosophy course as a (convenience) sample. You wish to find out more about students' attitudes toward female priests. You decide to compare the proportion of girls who support the idea of a female priest with the proportion of boys. Define the parameter of interest and give the correct notation.
Unlock Deck
Unlock for access to all 231 flashcards in this deck.
Unlock Deck
k this deck
40
Which of the following statements is correct about a parameter and a statistic associated with repeated random samples of the same size from the same population?
A) Values of a parameter will vary from sample to sample but values of a statistic will not.
B) Values of both a parameter and a statistic may vary from sample to sample.
C) Values of a parameter will vary according to the sampling distribution for that parameter.
D) Values of a statistic will vary according to the sampling distribution for that statistic.
Unlock Deck
Unlock for access to all 231 flashcards in this deck.
Unlock Deck
k this deck
41
When a random sample is to be taken from a population and a statistic is to be computed, the statistic can also be thought of as
A) a parameter.
B) a random variable.
C) a standard error.
D) a sample.
A) a parameter.
B) a random variable.
C) a standard error.
D) a sample.
Unlock Deck
Unlock for access to all 231 flashcards in this deck.
Unlock Deck
k this deck
42
Which of the following statements best describes the relationship between a parameter and a statistic?
A) A parameter has a sampling distribution with the statistic as its mean.
B) A parameter has a sampling distribution that can be used to determine what values the statistic is likely to have in repeated samples.
C) A parameter is used to estimate a statistic.
D) A statistic is used to estimate a parameter.
Unlock Deck
Unlock for access to all 231 flashcards in this deck.
Unlock Deck
k this deck
43
Which one of the following statements is false?
A) The standard error measures the variability of a population parameter.
B) The standard error of a sample statistic measures, roughly, the average difference between the values of the statistic and the population parameter.
C) Assuming a fixed value of s = sample standard deviation, the standard error of the mean decreases as the sample size increases.
D) The standard error of a sample proportion decreases as the sample size increases.
Unlock Deck
Unlock for access to all 231 flashcards in this deck.
Unlock Deck
k this deck
44
Which one of the following statements is false?
A) A sampling distribution is the probability distribution of a sample statistic. It describes how values of a sample statistic vary across all possible random samples of a specific size that can be taken from a population.
B) For all five scenarios considered, the sampling distribution is approximately normal as long as the sample size(s) are large enough.
C) The mean value of a sampling distribution is the mean value of a sample statistic over all possible random samples. For the five scenarios, this mean equals the value of the statistic.
D) The standard deviation of a sampling distribution measures the variation between all possible values of the sample statistic and their mean over all possible random samples. For the five scenarios, this mean equals the value of the parameter.
Unlock Deck
Unlock for access to all 231 flashcards in this deck.
Unlock Deck
k this deck
45
Use the following information for questions:
A comparison is to be made between the proportion of second graders that cannot read at second grade level and the proportion of third graders that cannot read at second grade level. School records from schools across the state are collected and records for 123 second graders and 146 third graders are randomly selected. Of the sampled second graders, 25 seem to be not reading at second grade level. Of the sample third graders, 26 do not read at second grade level.
-What is the correct notation for the difference ?
A) 1 - 2
B) -
C) p1 -p2
D) -
Unlock Deck
Unlock for access to all 231 flashcards in this deck.
Unlock Deck
k this deck
46
Use the following information for questions:
A comparison is to be made between the proportion of second graders that cannot read at second grade level and the proportion of third graders that cannot read at second grade level. School records from schools across the state are collected and records for 123 second graders and 146 third graders are randomly selected. Of the sampled second graders, 25 seem to be not reading at second grade level. Of the sample third graders, 26 do not read at second grade level.
-We know that if the sampling procedure were repeated, we would probably not observe 25/123 and 26/146 students who cannot read at second grade level again. What is the mean of the sampling distribution of the difference between the two proportions based on 123 second graders and 146 third graders?
A) -
B) -
C) 146 - 123
D) 0
Unlock Deck
Unlock for access to all 231 flashcards in this deck.
Unlock Deck
k this deck
47
Use the following information for questions:
We wish to conduct a hypothesis test to determine if, on average, the mother in a family spends more time doing house work per week than the father, for families where both parents have a full time job.
-What is the correct notation for the parameter of interest?
A) 1 - 2
B)
C) -
D)
We wish to conduct a hypothesis test to determine if, on average, the mother in a family spends more time doing house work per week than the father, for families where both parents have a full time job.
-What is the correct notation for the parameter of interest?
A) 1 - 2
B)
C) -
D)
Unlock Deck
Unlock for access to all 231 flashcards in this deck.
Unlock Deck
k this deck
48
Use the following information for questions:
We wish to conduct a hypothesis test to determine if, on average, the mother in a family spends more time doing house work per week than the father, for families where both parents have a full time job.
-Suppose that in reality, mothers and fathers spend an equal amount of time, on average, doing housework each week. What would be the mean of the sampling distribution of the sample mean difference in time, based on random samples taken from the population under study (mothers and fathers from families where both parents have a full time job)?
A) 1 - 2
B)
C)
D) 0
Unlock Deck
Unlock for access to all 231 flashcards in this deck.
Unlock Deck
k this deck
49
Explain what the "sampling distribution of a statistic" means (or give an example).
Unlock Deck
Unlock for access to all 231 flashcards in this deck.
Unlock Deck
k this deck
50
If the sample size (n) is large, and the sample is a random sample, then the distribution of the sample proportion is approximately a
A) binomial distribution.
B) uniform distribution.
C) normal distribution.
D) none of the above.
A) binomial distribution.
B) uniform distribution.
C) normal distribution.
D) none of the above.
Unlock Deck
Unlock for access to all 231 flashcards in this deck.
Unlock Deck
k this deck
51
For which of the following situations would the Rule for Sample Proportions not apply?
A) A random sample of 100 is taken from a population in which the proportion with the trait of interest is 0.98.
B) A random sample of 50 is taken from a population in which the proportion with the trait of interest is 0.50.
C) A binomial experiment is done with n = 500 and p = 0.9.
D) The Rule for Sample Proportions would apply in all of the situations in A, B and
Unlock Deck
Unlock for access to all 231 flashcards in this deck.
Unlock Deck
k this deck
52
If the size of a sample randomly selected sample from a population is increased from n = 100 to n = 400, then the standard deviation of will
A) remain the same.
B) increase by a factor of 4.
C) decrease by a factor of 4.
D) decrease by a factor of 2.
A) remain the same.
B) increase by a factor of 4.
C) decrease by a factor of 4.
D) decrease by a factor of 2.
Unlock Deck
Unlock for access to all 231 flashcards in this deck.
Unlock Deck
k this deck
53
The mean of the sampling distribution for a sample proportion depends on the value(s) of
A) the true population proportion but not the sample size.
B) the sample size but not the true population proportion.
C) the sample size and the true population proportion.
D) neither the sample size nor the true population proportion.
A) the true population proportion but not the sample size.
B) the sample size but not the true population proportion.
C) the sample size and the true population proportion.
D) neither the sample size nor the true population proportion.
Unlock Deck
Unlock for access to all 231 flashcards in this deck.
Unlock Deck
k this deck
54
Which of the following statements is true about the standard deviation of ?
A) It increases as the sample size n increases.
B) It decreases as the sample size n increases.
C) It does not change as the sample size n increases.
D) It changes each time a new sample is drawn.
A) It increases as the sample size n increases.
B) It decreases as the sample size n increases.
C) It does not change as the sample size n increases.
D) It changes each time a new sample is drawn.
Unlock Deck
Unlock for access to all 231 flashcards in this deck.
Unlock Deck
k this deck
55
Sleep apnea is a condition involving irregular breathing during sleep. Suppose that 20% of a population of men experience sleep apnea. A random sample of n = 64 men is to be drawn from this population. What is the mean of the sampling distribution for the sample proportion of men who experience sleep apnea?
A) 20/64
B) 0.20
C) 0.80
D) It depends on the value of the sample proportion.
A) 20/64
B) 0.20
C) 0.80
D) It depends on the value of the sample proportion.
Unlock Deck
Unlock for access to all 231 flashcards in this deck.
Unlock Deck
k this deck
56
Suppose that 20% of a random sample of n = 64 men are currently single. What is the standard error of the proportion of single men in the sample?
A) 0.125
B) 0.05
C) 0.10
D) 0.20
A) 0.125
B) 0.05
C) 0.10
D) 0.20
Unlock Deck
Unlock for access to all 231 flashcards in this deck.
Unlock Deck
k this deck
57
In a random sample of 1000 students, 80% were in favor of longer hours at the school library. What is the standard error of the sample proportion?
A) 0.013
B) 0.160
C) 0.640.
D) 0.800
A) 0.013
B) 0.160
C) 0.640.
D) 0.800
Unlock Deck
Unlock for access to all 231 flashcards in this deck.
Unlock Deck
k this deck
58
Use the following information for questions:
A television station plans to ask a random sample of 400 city residents if they can name the news anchor on the evening news at their station. They plan to fire the news anchor if fewer than 10% of the residents in the sample can do so. Suppose that in fact 12% of city residents could name the anchor if asked.
-What is the mean of the sampling distribution for the sample proportion of city residents who can name the news anchor on the evening news at their station?
A) 400
B) 0.10
C) 0.12
D) 48
Unlock Deck
Unlock for access to all 231 flashcards in this deck.
Unlock Deck
k this deck
59
Use the following information for questions:
A television station plans to ask a random sample of 400 city residents if they can name the news anchor on the evening news at their station. They plan to fire the news anchor if fewer than 10% of the residents in the sample can do so. Suppose that in fact 12% of city residents could name the anchor if asked.
-What is the standard deviation of the sampling distribution for the sample proportion of city residents who can name the news anchor on the evening news at their station?
A) 0.015
B) 0.0162
C) 0.1056
D) 0.12
Unlock Deck
Unlock for access to all 231 flashcards in this deck.
Unlock Deck
k this deck
60
Use the following information for questions:
A television station plans to ask a random sample of 400 city residents if they can name the news anchor on the evening news at their station. They plan to fire the news anchor if fewer than 10% of the residents in the sample can do so. Suppose that in fact 12% of city residents could name the anchor if asked.
-What is the approximate probability that the anchor will be fired?
A) 0.02
B) 1.23
C) 0.11
D) 0.89
Unlock Deck
Unlock for access to all 231 flashcards in this deck.
Unlock Deck
k this deck
61
Use the following information for questions:
Based on the 2000 Census, 31.8% of grandparents in California are the primary caregivers for their grandchildren. Suppose n = 1000 grandparents are to be sampled from this population and the sample proportion of grandparents as primary caregivers ( ) is to be calculated.
-What is the mean of the sampling distribution of ?
A) 0.0002
B) 0.0147
C) 0.2169
D) 0.3180
Unlock Deck
Unlock for access to all 231 flashcards in this deck.
Unlock Deck
k this deck
62
Use the following information for questions:
Based on the 2000 Census, 31.8% of grandparents in California are the primary caregivers for their grandchildren. Suppose n = 1000 grandparents are to be sampled from this population and the sample proportion of grandparents as primary caregivers ( ) is to be calculated.
-What is the standard deviation of the sampling distribution of ?
A) 0.0002
B) 0.0147
C) 0.2169
D) 0.3180
Unlock Deck
Unlock for access to all 231 flashcards in this deck.
Unlock Deck
k this deck
63
Use the following information for questions:
Based on the 2000 Census, 31.8% of grandparents in California are the primary caregivers for their grandchildren. Suppose n = 1000 grandparents are to be sampled from this population and the sample proportion of grandparents as primary caregivers ( ) is to be calculated.
-What is the approximate probability that they find less than 30% primary caregivers in the sample?
A) 0.1112
B) 0.1075
C) 0.8888
D) 0.0147
Unlock Deck
Unlock for access to all 231 flashcards in this deck.
Unlock Deck
k this deck
64
Use the following information for questions:
Based on the 2000 Census, the proportion of the California population aged 15 years old or older who are married is p = 0.524. Suppose n = 1000 persons are to be sampled from this population and the sample proportion of married persons ( ) is to be calculated.
-What is the mean of the sampling distribution of ?
A) 0.0158
B) 0.0166
C) 0.2494
D) 0.5240
Unlock Deck
Unlock for access to all 231 flashcards in this deck.
Unlock Deck
k this deck
65
Use the following information for questions:
Based on the 2000 Census, the proportion of the California population aged 15 years old or older who are married is p = 0.524. Suppose n = 1000 persons are to be sampled from this population and the sample proportion of married persons ( ) is to be calculated.
-What is the standard deviation of the sampling distribution of ?
A) 0.0158
B) 0.0166
C) 0.2494
D) 0.5240
Unlock Deck
Unlock for access to all 231 flashcards in this deck.
Unlock Deck
k this deck
66
Use the following information for questions:
Based on the 2000 Census, the proportion of the California population aged 15 years old or older who are married is p = 0.524. Suppose n = 1000 persons are to be sampled from this population and the sample proportion of married persons ( ) is to be calculated.
-What is the approximate probability that less than 50% of the people in the sample are married?
A) 0.0158
B) 0.0645
C) 0.5240
D) 0.9355
Unlock Deck
Unlock for access to all 231 flashcards in this deck.
Unlock Deck
k this deck
67
Use the following information for questions:
Every student taking elementary statistics at a large university (1,100 students) participated in a class project by rolling a 6-sided die 100 times. Each individual student determined the proportion of his or her 100 rolls for which the result was a "1". The instructor plans to draw a histogram of the 1,100 sample proportions.
-What will be the approximate shape of this histogram?
A) Skewed
B) Uniform
C) Normal (bell-shaped)
D) Chi-square
Unlock Deck
Unlock for access to all 231 flashcards in this deck.
Unlock Deck
k this deck
68
Use the following information for questions:
Every student taking elementary statistics at a large university (1,100 students) participated in a class project by rolling a 6-sided die 100 times. Each individual student determined the proportion of his or her 100 rolls for which the result was a "1". The instructor plans to draw a histogram of the 1,100 sample proportions.
-What will be the approximate mean for the 1,100 sample proportions?
A) 1/100
B) 1/6
C) 6/100
D) 6
Unlock Deck
Unlock for access to all 231 flashcards in this deck.
Unlock Deck
k this deck
69
Use the following information for questions:
Every student taking elementary statistics at a large university (1,100 students) participated in a class project by rolling a 6-sided die 100 times. Each individual student determined the proportion of his or her 100 rolls for which the result was a "1". The instructor plans to draw a histogram of the 1,100 sample proportions.
-What will be the approximate standard deviation for the 1,100 sample proportions?
A)
B)
C)
D)
Unlock Deck
Unlock for access to all 231 flashcards in this deck.
Unlock Deck
k this deck
70
Five hundred (500) random samples of size n = 900 are taken from a large population in which 10% of the subjects are left-handed. The proportion of subjects in the sample that is left-handed is found for each sample and a histogram of these 500 proportions is drawn. Which interval covers the range into which about 68% of the values in the histogram will fall?
A) 0.1 0.010
B) 0.1 0.0134
C) 0.1 0.0167
D) 0.1 0.020
A) 0.1 0.010
B) 0.1 0.0134
C) 0.1 0.0167
D) 0.1 0.020
Unlock Deck
Unlock for access to all 231 flashcards in this deck.
Unlock Deck
k this deck
71
Use the following information for questions:
Let p denote the proportion of adults in major minority groups in the US who read an ethnic newspaper at least several times per week. According to the nonprofit organization New California Media the true value of p is 45 percent. We decide to take SRS of 200 adults in major minority groups and calculate , the sample proportion of adults who read an ethnic newspaper at least several times per week.
-What is the mean of the sampling distribution of ?
Unlock Deck
Unlock for access to all 231 flashcards in this deck.
Unlock Deck
k this deck
72
Use the following information for questions:
Let p denote the proportion of adults in major minority groups in the US who read an ethnic newspaper at least several times per week. According to the nonprofit organization New California Media the true value of p is 45 percent. We decide to take SRS of 200 adults in major minority groups and calculate , the sample proportion of adults who read an ethnic newspaper at least several times per week.
-What is the standard deviation of the sampling distribution of ?
Unlock Deck
Unlock for access to all 231 flashcards in this deck.
Unlock Deck
k this deck
73
Use the following information for questions:
Let p denote the proportion of adults in major minority groups in the US who read an ethnic newspaper at least several times per week. According to the nonprofit organization New California Media the true value of p is 45 percent. We decide to take SRS of 200 adults in major minority groups and calculate , the sample proportion of adults who read an ethnic newspaper at least several times per week.
-What is the approximate probability that more than half the adults in the sample read an ethnic newspaper at least several times per week?
Unlock Deck
Unlock for access to all 231 flashcards in this deck.
Unlock Deck
k this deck
74
Use the following information for questions:
In a pond with a large population of turtles, the percent of three different types of turtles are presented in the table below. A random sample of 100 turtles is taken from the pond.
-What is the standard deviation for the sample proportion of chicken turtles?
In a pond with a large population of turtles, the percent of three different types of turtles are presented in the table below.
A random sample of 100 turtles is taken from the pond.-What is the standard deviation for the sample proportion of chicken turtles?
Unlock Deck
Unlock for access to all 231 flashcards in this deck.
Unlock Deck
k this deck
75
Use the following information for questions:
In a pond with a large population of turtles, the percent of three different types of turtles are presented in the table below. A random sample of 100 turtles is taken from the pond.
-What is the standard deviation for the sample proportion of spotted turtles?
In a pond with a large population of turtles, the percent of three different types of turtles are presented in the table below.
A random sample of 100 turtles is taken from the pond.-What is the standard deviation for the sample proportion of spotted turtles?
Unlock Deck
Unlock for access to all 231 flashcards in this deck.
Unlock Deck
k this deck
76
Use the following information for questions:
In a pond with a large population of turtles, the percent of three different types of turtles are presented in the table below. A random sample of 100 turtles is taken from the pond.
-What is the standard deviation for the sample proportion of snapping turtles?
In a pond with a large population of turtles, the percent of three different types of turtles are presented in the table below.
A random sample of 100 turtles is taken from the pond.-What is the standard deviation for the sample proportion of snapping turtles?
Unlock Deck
Unlock for access to all 231 flashcards in this deck.
Unlock Deck
k this deck
77
Use the following information for questions:
In a pond with a large population of turtles, the percent of three different types of turtles are presented in the table below. A random sample of 100 turtles is taken from the pond.
-What is the approximate probability that the sample proportion of chicken turtles is lower than 0.25?
In a pond with a large population of turtles, the percent of three different types of turtles are presented in the table below.
A random sample of 100 turtles is taken from the pond.-What is the approximate probability that the sample proportion of chicken turtles is lower than 0.25?
Unlock Deck
Unlock for access to all 231 flashcards in this deck.
Unlock Deck
k this deck
78
Use the following information for questions:
In a pond with a large population of turtles, the percent of three different types of turtles are presented in the table below. A random sample of 100 turtles is taken from the pond.
-What is the approximate probability that the sample proportion of spotted turtles falls between 45% and 55%?
In a pond with a large population of turtles, the percent of three different types of turtles are presented in the table below.
A random sample of 100 turtles is taken from the pond.-What is the approximate probability that the sample proportion of spotted turtles falls between 45% and 55%?
Unlock Deck
Unlock for access to all 231 flashcards in this deck.
Unlock Deck
k this deck
79
Use the following information for questions:
In a pond with a large population of turtles, the percent of three different types of turtles are presented in the table below. A random sample of 100 turtles is taken from the pond.
-What is the approximate probability that the sample proportion of snapping turtles is higher than 0.25?
In a pond with a large population of turtles, the percent of three different types of turtles are presented in the table below.
A random sample of 100 turtles is taken from the pond.-What is the approximate probability that the sample proportion of snapping turtles is higher than 0.25?
Unlock Deck
Unlock for access to all 231 flashcards in this deck.
Unlock Deck
k this deck
80
Use the following information for questions:
Data is to be gathered to estimate the proportion of residents who will vote for Mr. Treehouse in the coming city elections. A random sample of 650 voters is interviewed and 306 of them say that they will support Mr. Treehouse.
-What is the sample proportion of residents who will vote for Mr. Treehouse in the coming city elections?
Unlock Deck
Unlock for access to all 231 flashcards in this deck.
Unlock Deck
k this deck
Unlock Deck
Unlock for access to all 231 flashcards in this deck.


