Deck 5: Externalities, Environmental Policy, and Public Goods
Full screen (f)
Question
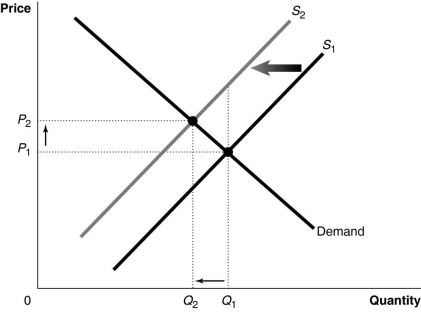
Figure 5-1 shows a market with an externality. The current market equilibrium output of Q1 is not the economically efficient output. The economically efficient output is Q2.
-Refer to Figure 5-1. Suppose the current market equilibrium output of Q1 is not the economically efficient output because of an externality. The economically efficient output is Q2. In that case, the diagram shows
A) the effect of a positive externality in the production of a good.
B) the effect of a negative externality in the production of a good.
C) the effect of an external cost imposed on a producer.
D) the effect of an external benefit such as a subsidy granted to consumers of a good.
Question
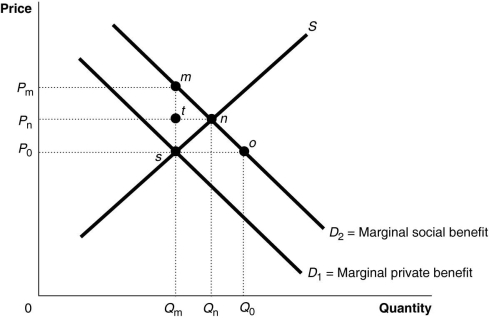
-Refer to Figure 5-3. The market equilibrium output level is
A) Qm.
B) Qn.
C) Qo.
D) Qo - Qm.
Question
-Refer to Figure 5-3. At the competitive market equilibrium,
A) the size of the external cost is Pm - Po.
B) the size of the external benefit is Pm - Po.
C) the size of the external cost is Pn - Po.
D) the size of the external benefit is Pn - Po.
Question
Question
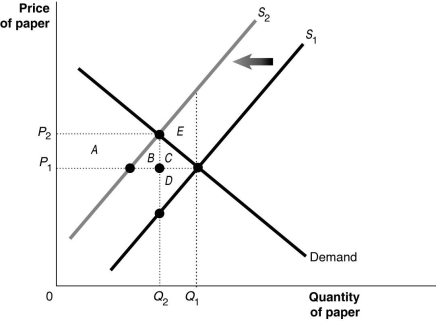
Suppose there are several paper mills producing paper for a market. These mills, located upstream from a fishing village, discharge a large amount of wastewater into the river. The waste material affects the number of fish in the river and the use of the river for recreation and as a public water supply source. Figure 5-4 shows the paper market. Use this Figure to answer the following question(s).
-Refer to Figure 5-4. What is the deadweight loss from producing at the market equilibrium?
A) area C
B) area E
C) area D
D) area F
Question
Question
Question
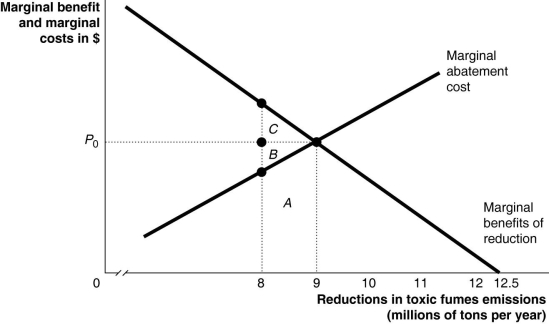
Consider a chemical plant that discharges toxic fumes over a nearby community. To reduce the emissions of toxic fumes the firm can install pollution abatement devices. Figure 5-8 shows the marginal benefit and the marginal cost from reducing the toxic fumes emissions.
-Refer to Figure 5-8. Suppose the emissions reduction target is currently established at 8 million tons. Should society undertake to reduce an additional 1 million tons so that the total reduction is 9 million tons?
A) No, because there is a net cost represented by the area B + C.
B) Yes, because the marginal benefit exceeds the marginal cost at 8 million tons.
C) Yes, because toxic fumes are dangerous and must be eliminated at any cost.
D) No, because the firms will pass the additional cost on to consumers.
Question
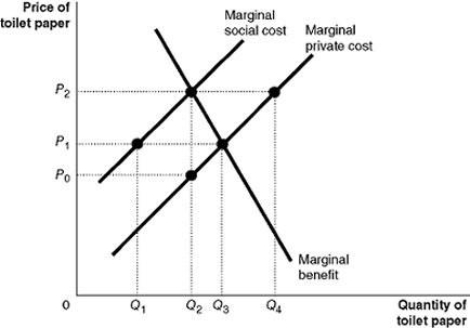
Companies producing toilet paper bleach the paper to make it white. The bleach is discharged into rivers and lakes and causes substantial environmental damage. Figure 5-9 illustrates the situation in the toilet paper market.
-Refer to Figure 5-9. The efficient output is
A) Q1.
B) Q2.
C) Q3.
D) Q4.
Question
Companies producing toilet paper bleach the paper to make it white. The bleach is discharged into rivers and lakes and causes substantial environmental damage. Figure 5-9 illustrates the situation in the toilet paper market.
-Refer to Figure 5-9. The market equilibrium output level is
A) Q1.
B) Q2.
C) Q3.
D) Q4.
Question
Companies producing toilet paper bleach the paper to make it white. The bleach is discharged into rivers and lakes and causes substantial environmental damage. Figure 5-9 illustrates the situation in the toilet paper market.
-Refer to Figure 5-9. Let's suppose the government imposes a tax of $50 per unit of toilet paper to bring about the efficient level of production. What happens to the market price of toilet paper?
A) It rises by $50 per unit.
B) It rises by more than $50 per unit.
C) It rises by less than $50 per unit.
D) It remains the same because the tax is imposed on producers who create the externality.
Question
Question
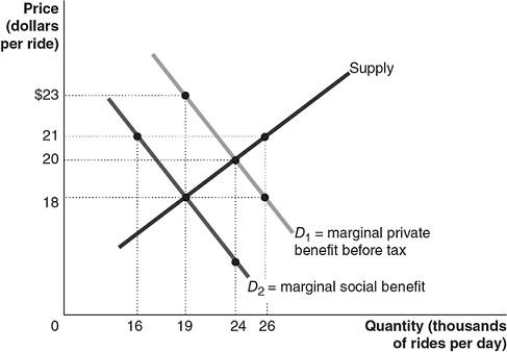
Figure 5-13 illustrates the market for shared rides before the government imposes a congestion tax.
-Refer to Figure 5-13. The efficient equilibrium quantity of shared rides is ________ thousand per day.
A) 16
B) 19
C) 24
D) 26
Question
Figure 5-13 illustrates the market for shared rides before the government imposes a congestion tax.
-Refer to Figure 5-13. The market equilibrium quantity of shared rides is ________ thousand per day.
A) 16
B) 19
C) 24
D) 26
Question
Figure 5-13 illustrates the market for shared rides before the government imposes a congestion tax.
-Refer to Figure 5-13. The efficient equilibrium price of shared rides is ________ per ride.
A) $18
B) $20
C) $21
D) $23
Question
Figure 5-13 illustrates the market for shared rides before the government imposes a congestion tax.
-Refer to Figure 5-13. The market equilibrium price of shared rides is ________ per ride.
A) $18
B) $20
C) $21
D) $23
Question
Figure 5-13 illustrates the market for shared rides before the government imposes a congestion tax.
-Refer to Figure 5-13. If the government wanted to achieve the efficient level of shared rides by imposing a congestion tax, the actual price for shared rides paid by consumers after the tax is implemented is ________ per ride.
A) $18
B) $20
C) $21
D) $23
Question
Figure 5-13 illustrates the market for shared rides before the government imposes a congestion tax.
-Refer to Figure 5-13. If the government wanted to achieve the efficient level of shared rides by imposing a congestion tax, the amount of the congestion tax would be ________ per ride.
A) $1
B) $2
C) $3
D) $5
Question
Figure 5-13 illustrates the market for shared rides before the government imposes a congestion tax.
-Refer to Figure 5-13. If the government wanted to achieve the efficient level of shared rides by imposing a congestion tax, the tax would raise the price paid by consumers by ________ per ride.
A) $1
B) $2
C) $3
D) $5
Question
Question
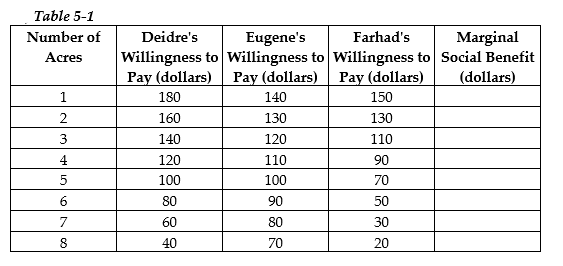
In an effort to maintain privacy and enhance property values, three homeowners, Deidre, Eugene, and Farhad, are considering leasing a portion of adjoining vacant land for a private park. Table 5-1 shows each person's willingness to pay for each quantity of the land.
a. Complete the column in Table 5-1.
b. Graph the marginal social benefit curve.
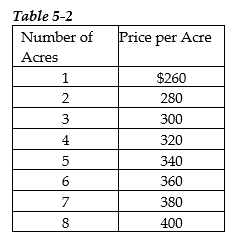
c. Suppose the landowner is willing to lease a portion of her land according to the following supply schedule given in Table 5-2. On the same diagram, graph the supply curve.
d. What is the optimal quantity of land that homeowners should lease? Explain your answer.
e. Explain why a park of 5 acres is not optimal.

Unlock Deck
Sign up to unlock the cards in this deck!
Unlock Deck
Unlock Deck
1/21
Play
Full screen (f)
Deck 5: Externalities, Environmental Policy, and Public Goods
1
Figure 5-1 shows a market with an externality. The current market equilibrium output of Q1 is not the economically efficient output. The economically efficient output is Q2.
-Refer to Figure 5-1. Suppose the current market equilibrium output of Q1 is not the economically efficient output because of an externality. The economically efficient output is Q2. In that case, the diagram shows
A) the effect of a positive externality in the production of a good.
B) the effect of a negative externality in the production of a good.
C) the effect of an external cost imposed on a producer.
D) the effect of an external benefit such as a subsidy granted to consumers of a good.
the effect of a negative externality in the production of a good.
2
-Refer to Figure 5-3. The market equilibrium output level is
A) Qm.
B) Qn.
C) Qo.
D) Qo - Qm.
Qm.
3
-Refer to Figure 5-3. At the competitive market equilibrium,
A) the size of the external cost is Pm - Po.
B) the size of the external benefit is Pm - Po.
C) the size of the external cost is Pn - Po.
D) the size of the external benefit is Pn - Po.
the size of the external benefit is Pm - Po.
4
While politicians and the general public often favor a "command-and-control" approach to the reduction of greenhouse gases, many economists favor market-based policies because they
A) completely eliminate negative externalities.
B) rely on economic incentives rather than on administrative rules.
C) convert all negative externalities into positive externalities.
D) eliminate the need for government involvement in all pollution regulation.
A) completely eliminate negative externalities.
B) rely on economic incentives rather than on administrative rules.
C) convert all negative externalities into positive externalities.
D) eliminate the need for government involvement in all pollution regulation.
Unlock Deck
Unlock for access to all 21 flashcards in this deck.
Unlock Deck
k this deck
5
Suppose there are several paper mills producing paper for a market. These mills, located upstream from a fishing village, discharge a large amount of wastewater into the river. The waste material affects the number of fish in the river and the use of the river for recreation and as a public water supply source. Figure 5-4 shows the paper market. Use this Figure to answer the following question(s).
-Refer to Figure 5-4. What is the deadweight loss from producing at the market equilibrium?
A) area C
B) area E
C) area D
D) area F
Unlock Deck
Unlock for access to all 21 flashcards in this deck.
Unlock Deck
k this deck
6
According to Violeta Bulc, the Transport Commissioner of the European Union (EU), the EU should move to a "polluter pays" model by charging motorists for the damage they cause to the environment and for lives lost on the road. A European Commission study has found that external costs of all transport in the EU is estimated at 1,000 billion euros annually, with road transport responsible for more than three-quarters of the total. This figure covers the costs caused by crashes, air pollution, noise pollution, habitat damage, and traffic congestion. , with the cost of congestion alone at more than 250 billion euros. According to Bulc, "These costs are real even if they are not priced by the markets. And the question is: if the user and polluter are not paying, who does? Well, we all do, all of society, regardless of whether we want to or not. That means that, for the time being, we have a 'society and environment pays' principle in place rather than 'user pays' or 'polluter pays.'"
Source: Carlton Reid, "Motorists Should Pay Full Costs Of Road Pollution, Deaths and Damage, Says EU Transport Commissioner," Forbes, January 24, 2019.
-Refer to the Article Summary. According to the article summary, motorists in the EU are not paying the full costs of the damage they cause to the environment, and those costs are being passed on to society as a whole. This is an example of a ________ due to the environmental damage being caused by motorists.
A) positive externality
B) negative externality
C) private cost
D) social benefit
Unlock Deck
Unlock for access to all 21 flashcards in this deck.
Unlock Deck
k this deck
7
According to Violeta Bulc, the Transport Commissioner of the European Union (EU), the EU should move to a "polluter pays" model by charging motorists for the damage they cause to the environment and for lives lost on the road. A European Commission study has found that external costs of all transport in the EU is estimated at 1,000 billion euros annually, with road transport responsible for more than three-quarters of the total. This figure covers the costs caused by crashes, air pollution, noise pollution, habitat damage, and traffic congestion. , with the cost of congestion alone at more than 250 billion euros. According to Bulc, "These costs are real even if they are not priced by the markets. And the question is: if the user and polluter are not paying, who does? Well, we all do, all of society, regardless of whether we want to or not. That means that, for the time being, we have a 'society and environment pays' principle in place rather than 'user pays' or 'polluter pays.'"
Source: Carlton Reid, "Motorists Should Pay Full Costs Of Road Pollution, Deaths and Damage, Says EU Transport Commissioner," Forbes, January 24, 2019.
-Refer to the Article Summary. If, as the Transport Commissioner has stated, "we have a 'society and environment pays' principle in place rather than a 'user pays' or 'polluter pays'", then the marginal social cost is ________ the marginal private cost for road transport.
A) equal to
B) greater than
C) less than
D) unrelated to
Unlock Deck
Unlock for access to all 21 flashcards in this deck.
Unlock Deck
k this deck
8
Consider a chemical plant that discharges toxic fumes over a nearby community. To reduce the emissions of toxic fumes the firm can install pollution abatement devices. Figure 5-8 shows the marginal benefit and the marginal cost from reducing the toxic fumes emissions.
-Refer to Figure 5-8. Suppose the emissions reduction target is currently established at 8 million tons. Should society undertake to reduce an additional 1 million tons so that the total reduction is 9 million tons?
A) No, because there is a net cost represented by the area B + C.
B) Yes, because the marginal benefit exceeds the marginal cost at 8 million tons.
C) Yes, because toxic fumes are dangerous and must be eliminated at any cost.
D) No, because the firms will pass the additional cost on to consumers.
Unlock Deck
Unlock for access to all 21 flashcards in this deck.
Unlock Deck
k this deck
9
Companies producing toilet paper bleach the paper to make it white. The bleach is discharged into rivers and lakes and causes substantial environmental damage. Figure 5-9 illustrates the situation in the toilet paper market.
-Refer to Figure 5-9. The efficient output is
A) Q1.
B) Q2.
C) Q3.
D) Q4.
Unlock Deck
Unlock for access to all 21 flashcards in this deck.
Unlock Deck
k this deck
10
Companies producing toilet paper bleach the paper to make it white. The bleach is discharged into rivers and lakes and causes substantial environmental damage. Figure 5-9 illustrates the situation in the toilet paper market.
-Refer to Figure 5-9. The market equilibrium output level is
A) Q1.
B) Q2.
C) Q3.
D) Q4.
Unlock Deck
Unlock for access to all 21 flashcards in this deck.
Unlock Deck
k this deck
11
Companies producing toilet paper bleach the paper to make it white. The bleach is discharged into rivers and lakes and causes substantial environmental damage. Figure 5-9 illustrates the situation in the toilet paper market.
-Refer to Figure 5-9. Let's suppose the government imposes a tax of $50 per unit of toilet paper to bring about the efficient level of production. What happens to the market price of toilet paper?
A) It rises by $50 per unit.
B) It rises by more than $50 per unit.
C) It rises by less than $50 per unit.
D) It remains the same because the tax is imposed on producers who create the externality.
Unlock Deck
Unlock for access to all 21 flashcards in this deck.
Unlock Deck
k this deck
12
Worldwide annual carbon dioxide emissions increased from about 198 million metric tons in 1850 to ________ million metric tons in 2017.
A) 1,930
B) 3,855
C) 33,444
D) 246,500
A) 1,930
B) 3,855
C) 33,444
D) 246,500
Unlock Deck
Unlock for access to all 21 flashcards in this deck.
Unlock Deck
k this deck
13
Figure 5-13 illustrates the market for shared rides before the government imposes a congestion tax.
-Refer to Figure 5-13. The efficient equilibrium quantity of shared rides is ________ thousand per day.
A) 16
B) 19
C) 24
D) 26
Unlock Deck
Unlock for access to all 21 flashcards in this deck.
Unlock Deck
k this deck
14
Figure 5-13 illustrates the market for shared rides before the government imposes a congestion tax.
-Refer to Figure 5-13. The market equilibrium quantity of shared rides is ________ thousand per day.
A) 16
B) 19
C) 24
D) 26
Unlock Deck
Unlock for access to all 21 flashcards in this deck.
Unlock Deck
k this deck
15
Figure 5-13 illustrates the market for shared rides before the government imposes a congestion tax.
-Refer to Figure 5-13. The efficient equilibrium price of shared rides is ________ per ride.
A) $18
B) $20
C) $21
D) $23
Unlock Deck
Unlock for access to all 21 flashcards in this deck.
Unlock Deck
k this deck
16
Figure 5-13 illustrates the market for shared rides before the government imposes a congestion tax.
-Refer to Figure 5-13. The market equilibrium price of shared rides is ________ per ride.
A) $18
B) $20
C) $21
D) $23
Unlock Deck
Unlock for access to all 21 flashcards in this deck.
Unlock Deck
k this deck
17
Figure 5-13 illustrates the market for shared rides before the government imposes a congestion tax.
-Refer to Figure 5-13. If the government wanted to achieve the efficient level of shared rides by imposing a congestion tax, the actual price for shared rides paid by consumers after the tax is implemented is ________ per ride.
A) $18
B) $20
C) $21
D) $23
Unlock Deck
Unlock for access to all 21 flashcards in this deck.
Unlock Deck
k this deck
18
Figure 5-13 illustrates the market for shared rides before the government imposes a congestion tax.
-Refer to Figure 5-13. If the government wanted to achieve the efficient level of shared rides by imposing a congestion tax, the amount of the congestion tax would be ________ per ride.
A) $1
B) $2
C) $3
D) $5
Unlock Deck
Unlock for access to all 21 flashcards in this deck.
Unlock Deck
k this deck
19
Figure 5-13 illustrates the market for shared rides before the government imposes a congestion tax.
-Refer to Figure 5-13. If the government wanted to achieve the efficient level of shared rides by imposing a congestion tax, the tax would raise the price paid by consumers by ________ per ride.
A) $1
B) $2
C) $3
D) $5
Unlock Deck
Unlock for access to all 21 flashcards in this deck.
Unlock Deck
k this deck
20
A tragedy of the commons occurs when a resource is
A) rival and excludable.
B) rival and non-excludable.
C) non-rival and non-excludable.
D) non-rival and excludable.
A) rival and excludable.
B) rival and non-excludable.
C) non-rival and non-excludable.
D) non-rival and excludable.
Unlock Deck
Unlock for access to all 21 flashcards in this deck.
Unlock Deck
k this deck
21
In an effort to maintain privacy and enhance property values, three homeowners, Deidre, Eugene, and Farhad, are considering leasing a portion of adjoining vacant land for a private park. Table 5-1 shows each person's willingness to pay for each quantity of the land.
a. Complete the column in Table 5-1.
b. Graph the marginal social benefit curve.
c. Suppose the landowner is willing to lease a portion of her land according to the following supply schedule given in Table 5-2. On the same diagram, graph the supply curve.
d. What is the optimal quantity of land that homeowners should lease? Explain your answer.
e. Explain why a park of 5 acres is not optimal.
Unlock Deck
Unlock for access to all 21 flashcards in this deck.
Unlock Deck
k this deck
Unlock Deck
Unlock for access to all 21 flashcards in this deck.


