Deck 26: Introduction to Statistics and Probability
Full screen (f)
Question
Question
The following table shows the number of computers (in millions) sold in the years 1996-2010: 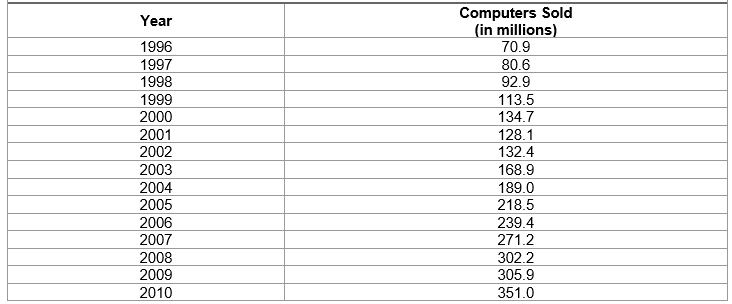 Make an x-y graph of the sales versus the year.
Make an x-y graph of the sales versus the year. Question
Question
Company sold 127 computers in the year 1990. The number of computers sold by each of its five sales representatives in 1990 is shown in the table below:
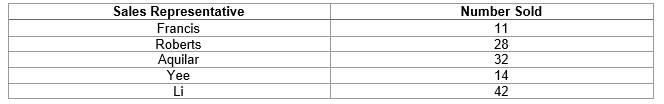
(a) Make a bar chart for the data.
(b) Make a pie chart for the data.
(a) Make a bar chart for the data.
(b) Make a pie chart for the data.
Question
Question
Question
Question
Question
Question
Question
Question
Question
Question
Question
Question
Question
Question
Question
Question
Question
Question
Question
Question
Question
Question
Question
Question
Question
Question
Question
Question
Question
Question
Question
Question
Question
Question
Question
Question
Question
Question
Question
Question
Question
Question
Question
Question
Question
Question
Question
Question
Question
Question
Question
Question
Question
Question
Question
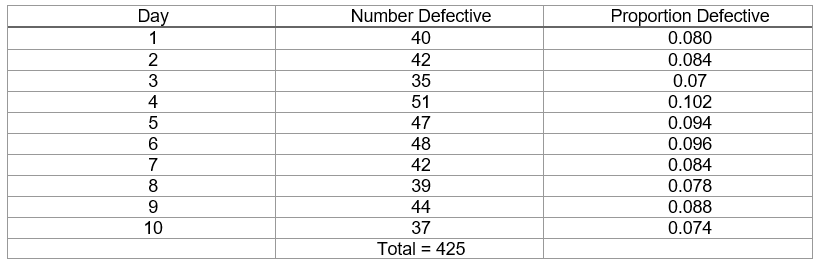
The proportion defective for samples of 200 calculators per day for 20 days as follows: 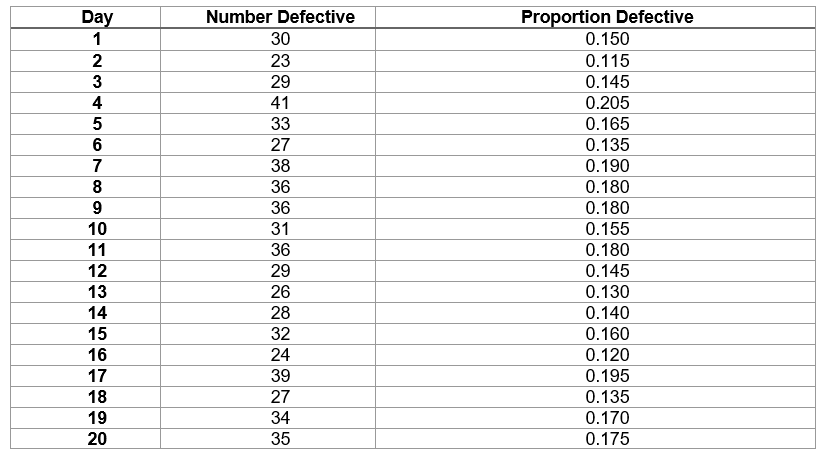 Find the mean proportion defective and the values of the upper and lower control limits.
Find the mean proportion defective and the values of the upper and lower control limits. Question
Five pieces of tubing are taken from a production line each day for 20 days and the lengths are measured. Their lengths, in , are as follows:
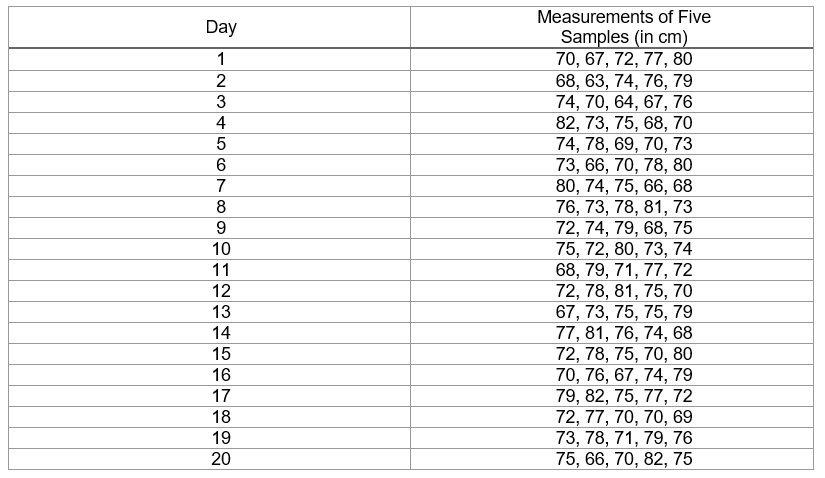
Find the values of the central line and upper and lower control limits for the mean.
Find the values of the central line and upper and lower control limits for the mean.
Question
Question
A factory kept track of its defectives (from random samples of 500 ) for 10 days and the following data was found:
 Find the values for the central line, and determine the upper and lower control limits.
Find the values for the central line, and determine the upper and lower control limits. Question
A factory kept track of its defectives (from random samples of 400 ) for 10 days and the following data was found:
 Find the values for the central line, and determine the upper and lower control limits.
Find the values for the central line, and determine the upper and lower control limits. Question
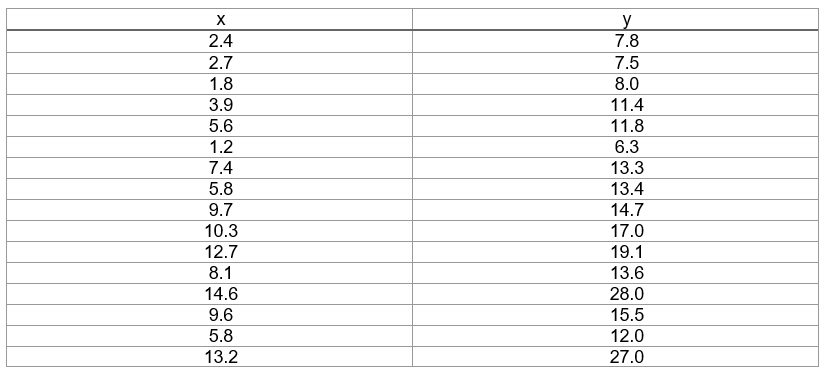
Find the correlation coefficient and the least squares line for the following data:
Question
Question
The temperature of a metal casting set out to cool was recorded over time and the following data was found:
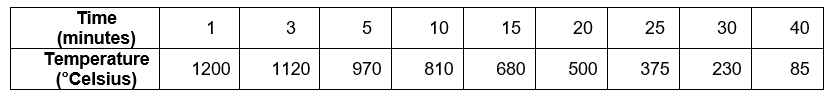 Find the correlation coefficient and the least squares line.
Find the correlation coefficient and the least squares line. Question
Given the following data:
 Find the correlation coefficient and the least squares line.
Find the correlation coefficient and the least squares line. Question
The amount of honey in a bee hive was recoded over several days
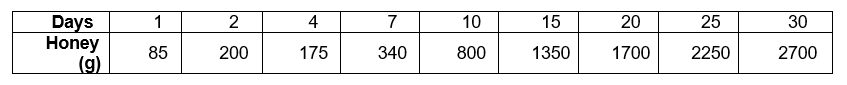 Find the correlation coefficient and the least squares line.
Find the correlation coefficient and the least squares line.
Unlock Deck
Sign up to unlock the cards in this deck!
Unlock Deck
Unlock Deck
1/68
Play
Full screen (f)
Deck 26: Introduction to Statistics and Probability
1
Define the following type of data as continuous, discrete, or categorical: The time it takes to drive from one city to another.
Continuous
2
The following table shows the number of computers (in millions) sold in the years 1996-2010: Make an x-y graph of the sales versus the year.
Make an x-y graph of the sales versus the year.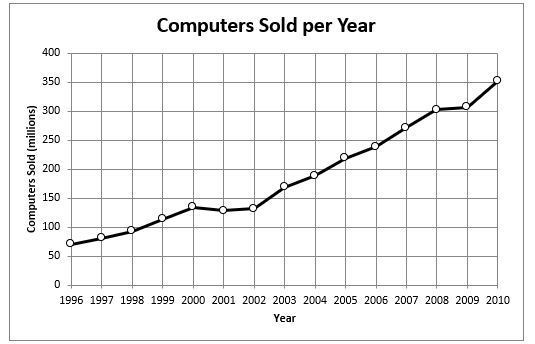
3
Define the following type of data as continuous, discrete, or categorical: The number of times a person dines out at a restaurant (per month).
Discrete
4
Company sold 127 computers in the year 1990. The number of computers sold by each of its five sales representatives in 1990 is shown in the table below:
(a) Make a bar chart for the data.
(b) Make a pie chart for the data.
(a) Make a bar chart for the data.
(b) Make a pie chart for the data.
Unlock Deck
Unlock for access to all 68 flashcards in this deck.
Unlock Deck
k this deck
5
Define the following type of data as continuous, discrete, or categorical: Time spent watching television each week
Unlock Deck
Unlock for access to all 68 flashcards in this deck.
Unlock Deck
k this deck
6
Use the information below for questions.
The average monthly rainfall (cm) in several cities in a certain province are:
-(a) Determine the range of the data.
(b) Make an absolute frequency distribution using class widths of .
(c) Make a relative frequency distribution using class widths of .
The average monthly rainfall (cm) in several cities in a certain province are:
-(a) Determine the range of the data.
(b) Make an absolute frequency distribution using class widths of .
(c) Make a relative frequency distribution using class widths of .
Unlock Deck
Unlock for access to all 68 flashcards in this deck.
Unlock Deck
k this deck
7
Use the information below for questions.
The average monthly rainfall (cm) in several cities in a certain province are:
-Draw a histogram, showing both absolute and relative frequencies.
The average monthly rainfall (cm) in several cities in a certain province are:
-Draw a histogram, showing both absolute and relative frequencies.
Unlock Deck
Unlock for access to all 68 flashcards in this deck.
Unlock Deck
k this deck
8
Use the information below for questions.
The average monthly rainfall (cm) in several cities in a certain province are:
-Draw a frequency polygon showing both absolute and relative frequencies.
The average monthly rainfall (cm) in several cities in a certain province are:
-Draw a frequency polygon showing both absolute and relative frequencies.
Unlock Deck
Unlock for access to all 68 flashcards in this deck.
Unlock Deck
k this deck
9
Use the information below for questions.
The average monthly rainfall (cm) in several cities in a certain province are:
-Make a cumulative frequency distribution, showing (a) absolute frequency and (b) relative frequency.
The average monthly rainfall (cm) in several cities in a certain province are:
-Make a cumulative frequency distribution, showing (a) absolute frequency and (b) relative frequency.
Unlock Deck
Unlock for access to all 68 flashcards in this deck.
Unlock Deck
k this deck
10
Use the information below for questions.
The average monthly rainfall (cm) in several cities in a certain province are:
-Draw a cumulative frequency polygon, showing both absolute and relative frequencies.
The average monthly rainfall (cm) in several cities in a certain province are:
-Draw a cumulative frequency polygon, showing both absolute and relative frequencies.
Unlock Deck
Unlock for access to all 68 flashcards in this deck.
Unlock Deck
k this deck
11
The amount of hours spent on the computer per week for a sample of 40 random people is given below:
(a) Construct a frequency distribution for the data (include class, frequency, and cumulative relative frequency).
(b) Draw a histogram for the distribution.
(a) Construct a frequency distribution for the data (include class, frequency, and cumulative relative frequency).
(b) Draw a histogram for the distribution.
Unlock Deck
Unlock for access to all 68 flashcards in this deck.
Unlock Deck
k this deck
12
The time (in minutes) taken to commute to work for 24 random people is given below:
Construct a frequency distribution for the data (include class, frequency, and cumulative relative frequency).
Construct a frequency distribution for the data (include class, frequency, and cumulative relative frequency).
Unlock Deck
Unlock for access to all 68 flashcards in this deck.
Unlock Deck
k this deck
13
Consider the below set of lengths for questions:
-Find the mean of the lengths.
-Find the mean of the lengths.
Unlock Deck
Unlock for access to all 68 flashcards in this deck.
Unlock Deck
k this deck
14
Consider the below set of lengths for questions:
-Find the median of the lengths.
-Find the median of the lengths.
Unlock Deck
Unlock for access to all 68 flashcards in this deck.
Unlock Deck
k this deck
15
Consider the below set of lengths for questions:
-Find the mode of the lengths.
-Find the mode of the lengths.
Unlock Deck
Unlock for access to all 68 flashcards in this deck.
Unlock Deck
k this deck
16
Consider the below set of lengths for questions:
-Find the range of the lengths.
-Find the range of the lengths.
Unlock Deck
Unlock for access to all 68 flashcards in this deck.
Unlock Deck
k this deck
17
Consider the below set of lengths for questions:
-Find the quartiles and find the quartile range of the lengths.
-Find the quartiles and find the quartile range of the lengths.
Unlock Deck
Unlock for access to all 68 flashcards in this deck.
Unlock Deck
k this deck
18
Consider the below set of lengths for questions:
-Find the sample variance and standard deviation of the lengths.
-Find the sample variance and standard deviation of the lengths.
Unlock Deck
Unlock for access to all 68 flashcards in this deck.
Unlock Deck
k this deck
19
Determine the quartiles and give the quartile range of the data: ,
Unlock Deck
Unlock for access to all 68 flashcards in this deck.
Unlock Deck
k this deck
20
The heights (in centimeters) of 35 students at Hatfield College are given below:
(a) Determine the range of the data.
(b) Make a frequency distribution using class widths of . Show both absolute and relative frequencies.
(c) Draw a frequency polygon showing both absolute and relative frequencies.
(d) Make a cumulative frequency distribution. Show both absolute and relative frequencies.
(e) Find the mean.
(f) Give the 5-number summary (minimum, quartile, median, quartile, maximum).
(g) Find the standard deviation. Assume that the heights are a sample drawn from a larger population.
Unlock Deck
Unlock for access to all 68 flashcards in this deck.
Unlock Deck
k this deck
21
What is the arithmetic mean of the following sample of weights of Lake Ontario in kilograms.
Unlock Deck
Unlock for access to all 68 flashcards in this deck.
Unlock Deck
k this deck
22
The amount of hours spent on homework and studying per week for a sample of 30 random students is given below:
(a) Find the mean.
(b) Find the median.
(c) Find the mode.
(d) Find the range.
(e) Find the standard deviation to three significant digits.
(a) Find the mean.
(b) Find the median.
(c) Find the mode.
(d) Find the range.
(e) Find the standard deviation to three significant digits.
Unlock Deck
Unlock for access to all 68 flashcards in this deck.
Unlock Deck
k this deck
23
From a random sample of 100 cars, the following data on the number tires that need replacing was found:
Find the weighted mean.
Find the weighted mean.
Unlock Deck
Unlock for access to all 68 flashcards in this deck.
Unlock Deck
k this deck
24
The amount of texts sent per day for a sample of 10 random people is given below:
(a) Find the mean.
(b) Find the median.
(c) Find the mode.
(d) Find the range.
(e) Find the standard deviation to three significant digits.
(a) Find the mean.
(b) Find the median.
(c) Find the mode.
(d) Find the range.
(e) Find the standard deviation to three significant digits.
Unlock Deck
Unlock for access to all 68 flashcards in this deck.
Unlock Deck
k this deck
25
A bag contains five yellow jelly beans, six red jelly beans and eight blue jelly beans. If a jelly bean is drawn at random from the bag, what is the probability that it will be red?
Unlock Deck
Unlock for access to all 68 flashcards in this deck.
Unlock Deck
k this deck
26
In a certain parking lot, of the cars have four doors, of the cars are blue, and of the cars have four doors and are blue. What is the probability that a car chosen at random will have either four doors or a blue color, or both?
Unlock Deck
Unlock for access to all 68 flashcards in this deck.
Unlock Deck
k this deck
27
If we throw two dice, what is the chance that their sum is 11 ?
Unlock Deck
Unlock for access to all 68 flashcards in this deck.
Unlock Deck
k this deck
28
We draw a ball from a bag that contains 4 red balls and 11 white balls. We replace the ball and draw another ball. What is the probability that both balls are white balls?
Unlock Deck
Unlock for access to all 68 flashcards in this deck.
Unlock Deck
k this deck
29
Find the probability that a card drawn from a deck will be either a four or a diamond.
Unlock Deck
Unlock for access to all 68 flashcards in this deck.
Unlock Deck
k this deck
30
If a die is rolled seven times, what is the probability of obtaining exactly three sixes?
Unlock Deck
Unlock for access to all 68 flashcards in this deck.
Unlock Deck
k this deck
31
If you flip a coin and roll a die, what is the probability of obtaining a heads on the coin and a three or four on the die?
Unlock Deck
Unlock for access to all 68 flashcards in this deck.
Unlock Deck
k this deck
32
In "old school" Dungeons and Dragons game, you might find that for your character to defend against an attack, you have to roll 17 or higher on a 20 -sided die. What is the probability of defending against three attacks in a row?
Unlock Deck
Unlock for access to all 68 flashcards in this deck.
Unlock Deck
k this deck
33
In testing the thickness of a protective coating sprayed onto metal plates, there is a probability that a single plate selected at random will pass inspection. What is the probability that of 15 plates sampled, 12 will pass inspection?
Unlock Deck
Unlock for access to all 68 flashcards in this deck.
Unlock Deck
k this deck
34
In a cell phone transmission tower there is a 0.002 probability of an intermittent power short circuit and a 0.01 probability of a faulty fuse. What is the probability of a short circuit or faulty fuse or both occurring? Assume that a short circuit and a faulty fuse occur independently.
Unlock Deck
Unlock for access to all 68 flashcards in this deck.
Unlock Deck
k this deck
35
A box contains twelve fuses and eight fuses. What is the probability of selecting a amp fuse at random?
Unlock Deck
Unlock for access to all 68 flashcards in this deck.
Unlock Deck
k this deck
36
Rolling two standard six-sided dice, what is the probability of rolling a sum of 10 ?
Unlock Deck
Unlock for access to all 68 flashcards in this deck.
Unlock Deck
k this deck
37
A certain coffee company has a prize promotion involving peeling a sticker from the top of your cup. If one in eight cups is a winner, what is the probability of winning 4 times if you buy 20 coffees? Express your answer to four decimal places.
Unlock Deck
Unlock for access to all 68 flashcards in this deck.
Unlock Deck
k this deck
38
A factory claims a defective rate on items produced. If a quality control engineer samples 25 items, what is the probability that 3 are defective? Express your answer to four decimal places.
Unlock Deck
Unlock for access to all 68 flashcards in this deck.
Unlock Deck
k this deck
39
We draw a ball from a bag that contains 5 red balls and 8 blue balls. We set aside the ball and draw another ball. What is the probability that both balls are blue balls?
Unlock Deck
Unlock for access to all 68 flashcards in this deck.
Unlock Deck
k this deck
40
What is the probability of a sum of 6 when rolling 3 standard six sided dice?
Unlock Deck
Unlock for access to all 68 flashcards in this deck.
Unlock Deck
k this deck
41
Find the area under the normal curve between the mean and 1.7 standard deviations. Use a table of area under the curve within standard deviations of the mean.
Unlock Deck
Unlock for access to all 68 flashcards in this deck.
Unlock Deck
k this deck
42
The distribution of grades on a certain test has a mean of 85.5 with a standard deviation of 11.2. There are 400 tests. Assuming that the grades are normally distributed, predict the number of students scoring between 75 and 95 . Use a table of area under the curve within standard deviations of the mean.
Unlock Deck
Unlock for access to all 68 flashcards in this deck.
Unlock Deck
k this deck
43
Find the area under the normal curve between 1.2 standard deviations on both sides of the mean.
Unlock Deck
Unlock for access to all 68 flashcards in this deck.
Unlock Deck
k this deck
44
On a test given to 150 students, the mean grade was 74.2 with a standard deviation of 9.8. Assuming a normal distribution, estimate the number of grades (between 80 and 90).
Unlock Deck
Unlock for access to all 68 flashcards in this deck.
Unlock Deck
k this deck
45
In a normal distribution, the mean is 85 , and the standard deviation is 12 . For a single value, a z-score is 1.3. What is the value?
Unlock Deck
Unlock for access to all 68 flashcards in this deck.
Unlock Deck
k this deck
46
A particular beverage company states that the volumes of the bottles they produce are normally distributed with a mean of and a standard deviation of . What is the probability that a randomly sampled bottle has a volume more than .
Unlock Deck
Unlock for access to all 68 flashcards in this deck.
Unlock Deck
k this deck
47
A snack company states that the weight of their chip bags is normally distributed with a mean of and standard deviation of . What is the probability of a randomly selected chip bag having a weight less than ?
Unlock Deck
Unlock for access to all 68 flashcards in this deck.
Unlock Deck
k this deck
48
A certain circuit has a resistance that is normally distributed with a mean of and a standard deviation of . What is the probability of circuit having a resistance between and ?
Unlock Deck
Unlock for access to all 68 flashcards in this deck.
Unlock Deck
k this deck
49
The amount of caffeine in a cup of coffee is normally distributed with a mean of and a standard deviation of . What amount of caffeine will of coffee will have less caffeine than?
Unlock Deck
Unlock for access to all 68 flashcards in this deck.
Unlock Deck
k this deck
50
A local refinery produces an amount of oil that is normally distributed with a mean of 250000 barrels per day with a standard deviation of 25000 barrels per day. What is the probability that the refinery will produce more than 300000 barrels on a given day?
Unlock Deck
Unlock for access to all 68 flashcards in this deck.
Unlock Deck
k this deck
51
The speeds of 180 randomly chosen cars passing a certain point on a highway were measured. The mean was found to be and their standard deviation was . Estimate the mean speed of the entire population of cars with a confidence level of .
Unlock Deck
Unlock for access to all 68 flashcards in this deck.
Unlock Deck
k this deck
52
A single sample of size 64 drawn from a population is found to have a mean of 135 and a standard deviation of 8.3. Estimate the population mean with a confidence level of .
Unlock Deck
Unlock for access to all 68 flashcards in this deck.
Unlock Deck
k this deck
53
In a sample of 850 ring bearings, the standard deviation is . What is the Standard Error of the sample?
Unlock Deck
Unlock for access to all 68 flashcards in this deck.
Unlock Deck
k this deck
54
A random survey of 100 people asking the number of cups of coffee they drank per week found a mean of 8 with standard deviation of 2.5 . Find the confidence interval for the population mean.
Unlock Deck
Unlock for access to all 68 flashcards in this deck.
Unlock Deck
k this deck
55
A random sample of 400 students found that are currently enrolled in a mathematics course. Find the confidence interval for the population proportion.
Unlock Deck
Unlock for access to all 68 flashcards in this deck.
Unlock Deck
k this deck
56
A random sample of 60 new cars found a mean cost of with standard deviation of . Find the confidence interval for the population mean.
Unlock Deck
Unlock for access to all 68 flashcards in this deck.
Unlock Deck
k this deck
57
A random survey of 80 students found they spent a mean of 21 hours in class per week with standard deviation of 3 hours per week. Find the confidence interval for the population mean.
Unlock Deck
Unlock for access to all 68 flashcards in this deck.
Unlock Deck
k this deck
58
A random sample of 500 parts found 20 to be defective. Find the 95% confidence interval for the population proportion.
Unlock Deck
Unlock for access to all 68 flashcards in this deck.
Unlock Deck
k this deck
59
The proportion defective for samples of 200 calculators per day for 20 days as follows: Find the mean proportion defective and the values of the upper and lower control limits.
Find the mean proportion defective and the values of the upper and lower control limits. Unlock Deck
Unlock for access to all 68 flashcards in this deck.
Unlock Deck
k this deck
60
Five pieces of tubing are taken from a production line each day for 20 days and the lengths are measured. Their lengths, in , are as follows:
Find the values of the central line and upper and lower control limits for the mean.
Find the values of the central line and upper and lower control limits for the mean.
Unlock Deck
Unlock for access to all 68 flashcards in this deck.
Unlock Deck
k this deck
61
For the table in problem 60 , find the average range , and determine the upper and lower control limits for the range.
Unlock Deck
Unlock for access to all 68 flashcards in this deck.
Unlock Deck
k this deck
62
A factory kept track of its defectives (from random samples of 500 ) for 10 days and the following data was found:
Find the values for the central line, and determine the upper and lower control limits.
Find the values for the central line, and determine the upper and lower control limits. Unlock Deck
Unlock for access to all 68 flashcards in this deck.
Unlock Deck
k this deck
63
A factory kept track of its defectives (from random samples of 400 ) for 10 days and the following data was found:
Find the values for the central line, and determine the upper and lower control limits.
Find the values for the central line, and determine the upper and lower control limits. Unlock Deck
Unlock for access to all 68 flashcards in this deck.
Unlock Deck
k this deck
64
Find the correlation coefficient and the least squares line for the following data:
Unlock Deck
Unlock for access to all 68 flashcards in this deck.
Unlock Deck
k this deck
65
The weight of a tray of hex bolts and the number of bolts on the tray will have what correlation coefficient?
Unlock Deck
Unlock for access to all 68 flashcards in this deck.
Unlock Deck
k this deck
66
The temperature of a metal casting set out to cool was recorded over time and the following data was found:
Find the correlation coefficient and the least squares line.
Find the correlation coefficient and the least squares line. Unlock Deck
Unlock for access to all 68 flashcards in this deck.
Unlock Deck
k this deck
67
Given the following data:
Find the correlation coefficient and the least squares line.
Find the correlation coefficient and the least squares line. Unlock Deck
Unlock for access to all 68 flashcards in this deck.
Unlock Deck
k this deck
68
The amount of honey in a bee hive was recoded over several days
Find the correlation coefficient and the least squares line.
Find the correlation coefficient and the least squares line. Unlock Deck
Unlock for access to all 68 flashcards in this deck.
Unlock Deck
k this deck
Unlock Deck
Unlock for access to all 68 flashcards in this deck.


