Exam 26: Introduction to Statistics and Probability
Exam 1: Numerical Computation129 Questions
Exam 2: Introduction to Algebra130 Questions
Exam 3: Simple Equations and Word Problems83 Questions
Exam 4: Functions85 Questions
Exam 5: Graphs64 Questions
Exam 6: Geometry103 Questions
Exam 7: Right Triangles and Vectors88 Questions
Exam 8: Factors and Factoring136 Questions
Exam 9: Fractions and Fractional Equations155 Questions
Exam 10: Systems of Linear Equations75 Questions
Exam 11: Determinants75 Questions
Exam 12: Matrices96 Questions
Exam 13: Exponents and Radicals125 Questions
Exam 14: Quadratic Equations151 Questions
Exam 15: Oblique Triangles and Vectors89 Questions
Exam 16: Radian Measure, Arc Length, and Circular Motion75 Questions
Exam 17: Graphs of the Trigonometric Functions70 Questions
Exam 18: Trigonometric Identities and Equations116 Questions
Exam 19: Ratio, Proportion, and Variation98 Questions
Exam 20: Exponential and Logarithmic Functions140 Questions
Exam 21: Complex Numbers115 Questions
Exam 22: Analytic Geometry129 Questions
Exam 23: Binary, Hexadecimal, Octal, and Bcd Numbers110 Questions
Exam 24: Inequalities and Linear Programming39 Questions
Exam 25: Sequences, Series, and the Binomial Theorem121 Questions
Exam 26: Introduction to Statistics and Probability68 Questions
Exam 27: Derivatives of Algebraic Functions83 Questions
Exam 28: Graphical Applications of the Derivative50 Questions
Exam 29: Applied Applications of the Derivative71 Questions
Exam 30: Integration69 Questions
Exam 31: Applications of the Integral50 Questions
Exam 32: More Applications of the Integral58 Questions
Exam 33: Derivatives of Trigonometric, Logarithmic, and Exponential Functions113 Questions
Exam 34: Methods of Integration89 Questions
Exam 35: Differential Equations103 Questions
Exam 36: Solving Differential Equations by the Laplace Transform and by Numerical Methods56 Questions
Exam 37: Infinite Series60 Questions
Select questions type
The amount of hours spent on homework and studying per week for a sample of 30 random students is given below:
3 5 6 6 7 7 7 7 8 8 9 10 10 12 13 14 14 14 15 15 17 19 20 20 21 21 24 27 28 30
(a) Find the mean.
(b) Find the median.
(c) Find the mode.
(d) Find the range.
(e) Find the standard deviation to three significant digits.
Free
(Short Answer)
4.8/5  (38)
(38)
Correct Answer: Verified
(a) 13.9
(b) 13.5
(c) 7
(d) 27
(e) 7.40
The heights (in centimeters) of 35 students at Hatfield College are given below:
(a) Determine the range of the data.
(b) Make a frequency distribution using class widths of . Show both absolute and relative frequencies.
(c) Draw a frequency polygon showing both absolute and relative frequencies.
(d) Make a cumulative frequency distribution. Show both absolute and relative frequencies.
(e) Find the mean.
(f) Give the 5-number summary (minimum, quartile, median, quartile, maximum).
(g) Find the standard deviation. Assume that the heights are a sample drawn from a larger population.
Free
(Essay)
4.8/5 (42)
Correct Answer:Verified
(a) 48.3
![(a) 48.3 (e) \overline{x} = 168.0 cm (f) [142.2, 162.6, 167.6, 175.3, 190.5] (g) 10.5 cm](https://storage.examlex.com/TB10878/11eedbb5_5b91_5acc_87de_1bc4016bfb36_TB10878_00.jpg)
(e)
(f) [142.2, 162.6, 167.6, 175.3, 190.5]
(g) 10.5 cm
In "old school" Dungeons and Dragons game, you might find that for your character to defend against an attack, you have to roll 17 or higher on a 20 -sided die. What is the probability of defending against three attacks in a row?
Free
(Short Answer)
4.8/5 (30)
Correct Answer:Verified
0.008
For the table in problem 60 , find the average range , and determine the upper and lower control limits for the range.
(Short Answer)
4.9/5 (43)
Five pieces of tubing are taken from a production line each day for 20 days and the lengths are measured. Their lengths, in , are as follows:
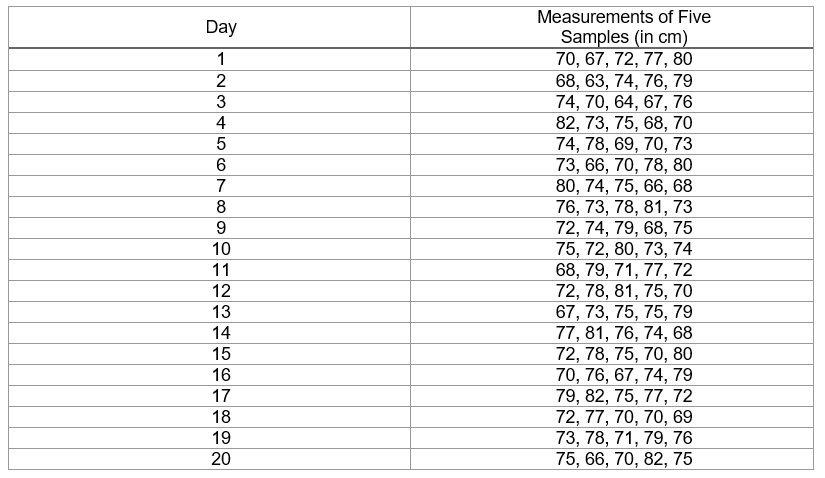 Find the values of the central line and upper and lower control limits for the mean.
(Essay)
4.8/5 (42)
Define the following type of data as continuous, discrete, or categorical: The time it takes to drive from one city to another.
(Short Answer)
4.9/5 (34)
The amount of texts sent per day for a sample of 10 random people is given below:
5 10 25 25 40 50 60 75 100 120
(a) Find the mean.
(b) Find the median.
(c) Find the mode.
(d) Find the range.
(e) Find the standard deviation to three significant digits.
(Short Answer)
4.8/5 (40)
On a test given to 150 students, the mean grade was 74.2 with a standard deviation of 9.8. Assuming a normal distribution, estimate the number of grades (between 80 and 90).
(Short Answer)
4.7/5 (30)
In a normal distribution, the mean is 85 , and the standard deviation is 12 . For a single value, a z-score is 1.3. What is the value?
(Short Answer)
4.8/5 (40)
A factory kept track of its defectives (from random samples of 400 ) for 10 days and the following data was found:
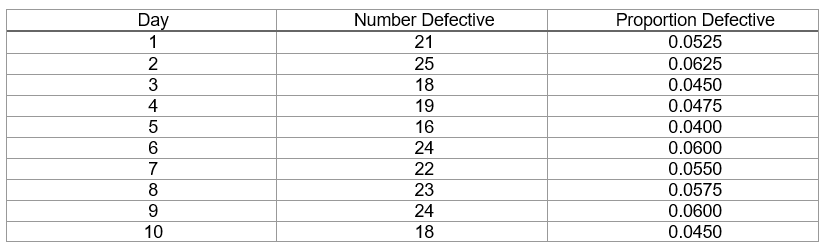 Find the values for the central line, and determine the upper and lower control limits.
(Essay)
4.9/5 (37)
A local refinery produces an amount of oil that is normally distributed with a mean of 250000 barrels per day with a standard deviation of 25000 barrels per day. What is the probability that the refinery will produce more than 300000 barrels on a given day?
(Short Answer)
4.9/5 (24)
Use the information below for questions.
The average monthly rainfall (cm) in several cities in a certain province are:
11.3 29.6 16.3 31.4 29.2 14.5 16.9 25.8 21.3 32.7 15.3 13.5 25.2 22.5 18.6 14.3 26.9 22.9
-Draw a cumulative frequency polygon, showing both absolute and relative frequencies.
(Essay)
4.8/5 (33)
The speeds of 180 randomly chosen cars passing a certain point on a highway were measured. The mean was found to be and their standard deviation was . Estimate the mean speed of the entire population of cars with a confidence level of .
(Short Answer)
5.0/5 (34)
Find the area under the normal curve between 1.2 standard deviations on both sides of the mean.
(Short Answer)
4.8/5 (40)
Consider the below set of lengths for questions:
123 422 566 329 247 296 245 522 362 593 229 475 357 227 489 326
-Find the mode of the lengths.
(Short Answer)
4.9/5 (32)
A factory claims a defective rate on items produced. If a quality control engineer samples 25 items, what is the probability that 3 are defective? Express your answer to four decimal places.
(Short Answer)
4.9/5 (29)
Define the following type of data as continuous, discrete, or categorical: The number of times a person dines out at a restaurant (per month).
(Short Answer)
4.9/5 (39)
A random survey of 100 people asking the number of cups of coffee they drank per week found a mean of 8 with standard deviation of 2.5 . Find the confidence interval for the population mean.
(Short Answer)
4.9/5 (43)
Use the information below for questions.
The average monthly rainfall (cm) in several cities in a certain province are:
11.3 29.6 16.3 31.4 29.2 14.5 16.9 25.8 21.3 32.7 15.3 13.5 25.2 22.5 18.6 14.3 26.9 22.9
-Draw a frequency polygon showing both absolute and relative frequencies.
(Essay)
4.7/5 (32)
What is the probability of a sum of 6 when rolling 3 standard six sided dice?
(Short Answer)
4.8/5 (37)
Filters
- Essay(0)
- Multiple Choice(0)
- Short Answer(0)
- True False(0)
- Matching(0)