Deck 10: Introduction to Statistics
Full screen (f)
Question
Prepare a frequency distribution for the given data with columns for intervals and frequencies.
-A medical research team studied the ages of patients who had strokes caused by stress. The ages of 34 patients who suffered stress strokes were as follows. Use 8 intervals starting with 25-29.
29 30 36 41 45 50 57 61 28 50 36 58
60 38 36 47 40 32 58 46 61 40 55 32
61 56 45 46 62 36 38 40 50 27
A)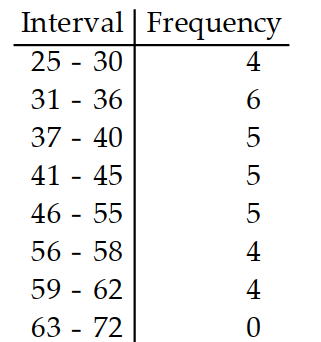
B)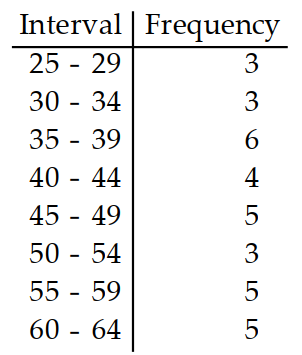
C)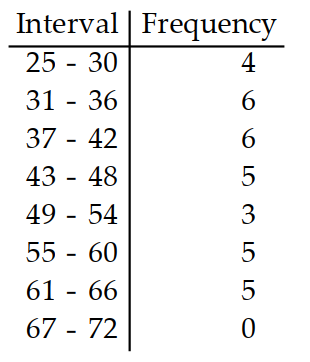
D)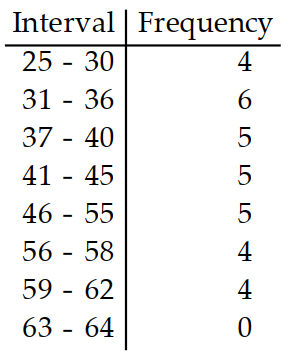
Question
Prepare a frequency distribution for the given data with columns for intervals and frequencies.
-The following is the number of hours students worked per week at after-school jobs. Use five intervals, starting with .
3 7 13 19 20 20 17 14 7 2 6 10 16 24 18 10 4 9 14 19
A)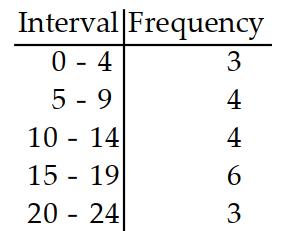
B)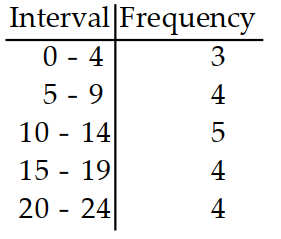
C)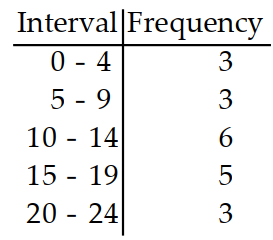
D)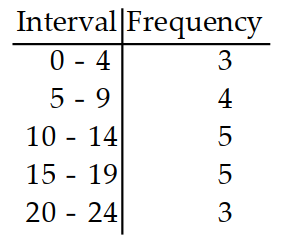
-The following is the number of hours students worked per week at after-school jobs. Use five intervals, starting with .
3 7 13 19 20 20 17 14 7 2 6 10 16 24 18 10 4 9 14 19
A)
B)
C)
D)
Question
Prepare a frequency distribution for the given data with columns for intervals and frequencies.
-The following is the number of hours students studied per week on average. Use five intervals, starting with .
A)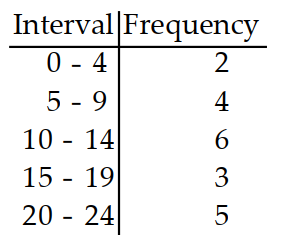
B)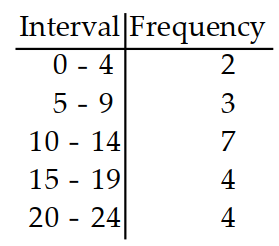
C)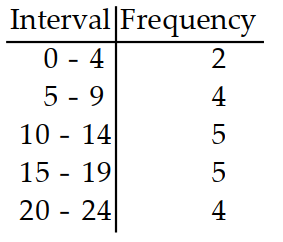
D)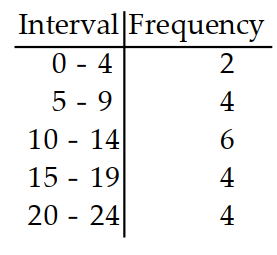
-The following is the number of hours students studied per week on average. Use five intervals, starting with .
A)
B)
C)
D)
Question
Prepare a frequency distribution for the given data with columns for intervals and frequencies.
-On a 25-point math test student scores were as follows. Use five intervals, starting with 0 - 4 .
A)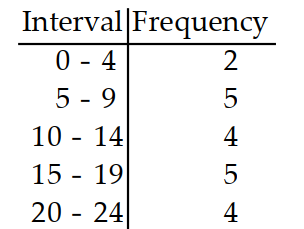
B)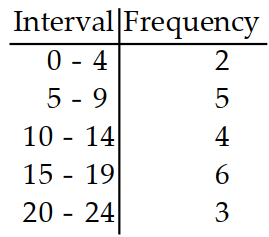
C)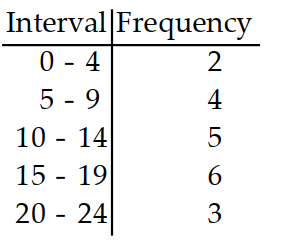
D)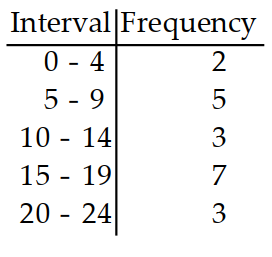
-On a 25-point math test student scores were as follows. Use five intervals, starting with 0 - 4 .
A)
B)
C)
D)
Question
Prepare a frequency distribution for the given data with columns for intervals and frequencies.
-The following is the number of bonus points that 24 students have gotten for extra work. Use six intervals, starting with 0 - 49.
A)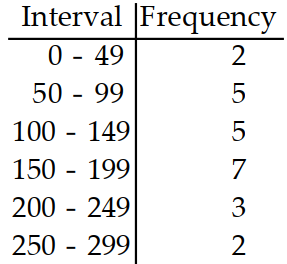
B)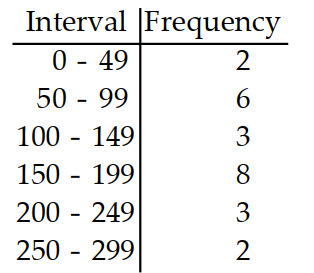
C)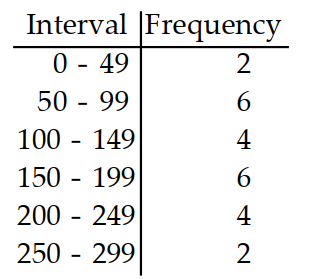
D)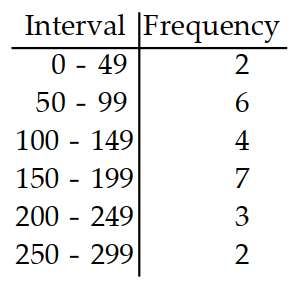
-The following is the number of bonus points that 24 students have gotten for extra work. Use six intervals, starting with 0 - 49.
A)
B)
C)
D)
Question
Construct the specified histogram.
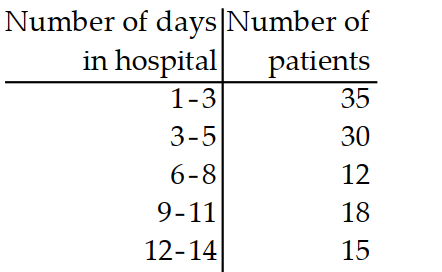
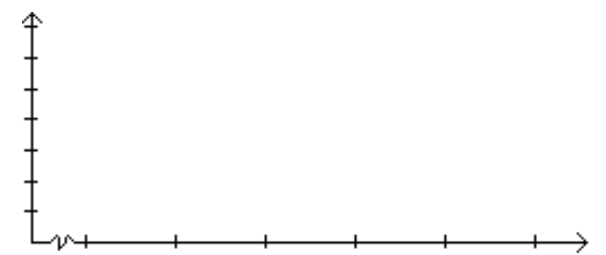
-The frequency table below shows the number of days off in a given year for 30 police detectives.
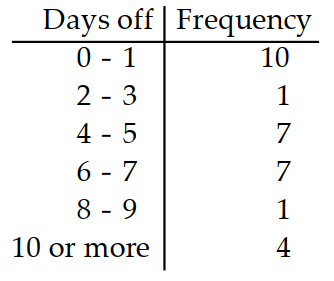
Construct a histogram.
-The frequency table below shows the number of days off in a given year for 30 police detectives.
Construct a histogram.
Question
Construct the specified histogram.
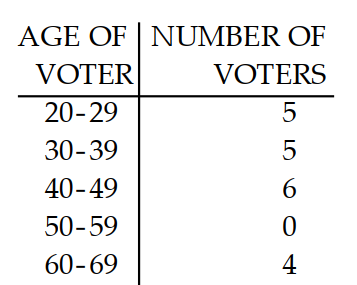
-In a survey, 20 voters were asked their age. The results are summarized in the frequency table below. Construct a histogram corresponding to the frequency table.
-In a survey, 20 voters were asked their age. The results are summarized in the frequency table below. Construct a histogram corresponding to the frequency table.
Question
Construct the specified histogram.
-In a survey, 20 people were asked how many magazines they had purchased during the previous year. The results are shown in the frequency distribution below. Construct a histogram.
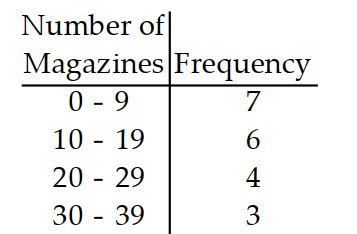

-In a survey, 20 people were asked how many magazines they had purchased during the previous year. The results are shown in the frequency distribution below. Construct a histogram.
Question
Construct the specified histogram.
-In a survey, 26 voters were asked their age. The results are shown below. Construct a histogram to represent the data. Use 5 intervals.

-In a survey, 26 voters were asked their age. The results are shown below. Construct a histogram to represent the data. Use 5 intervals.
Question
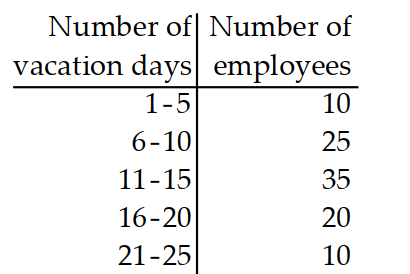
Construct a frequency polygon.
-
A)
B)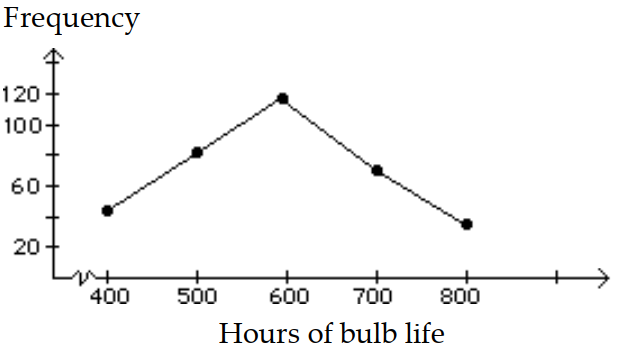
-
A)
B)
Question
Construct a frequency polygon.
-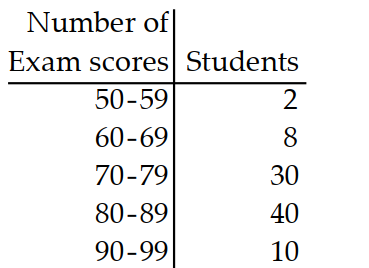
A)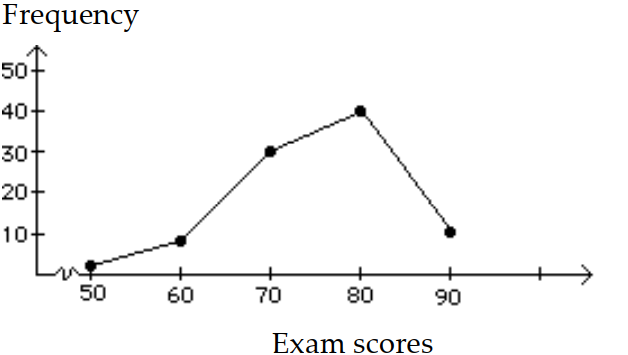
B)
-
A)
B)
Question
Construct a frequency polygon.
-
A)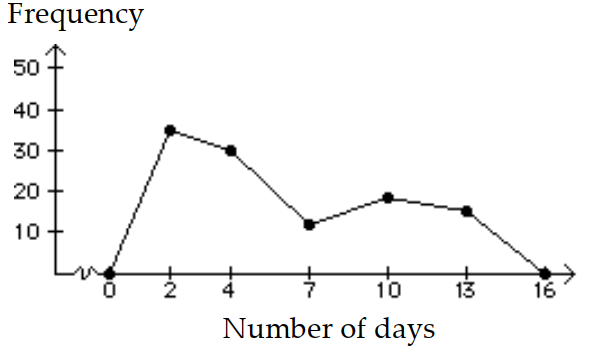
B)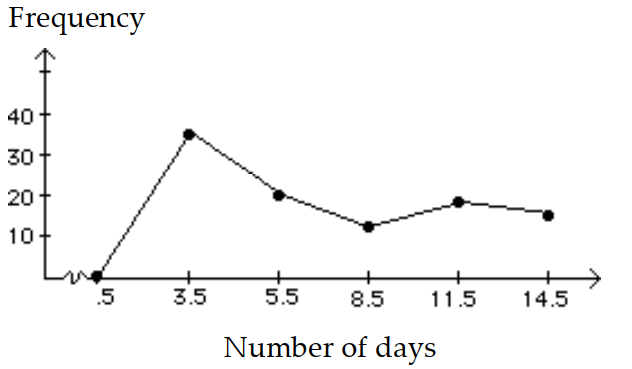
-
A)
B)
Question
Construct a frequency polygon.
-
A)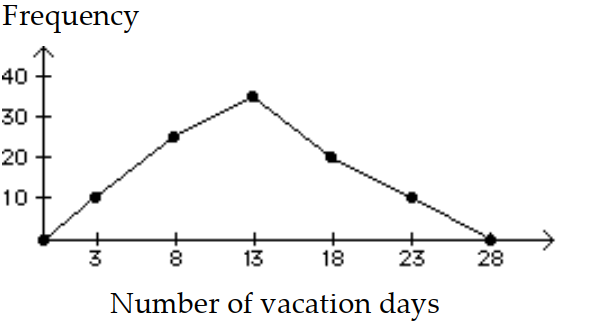
B)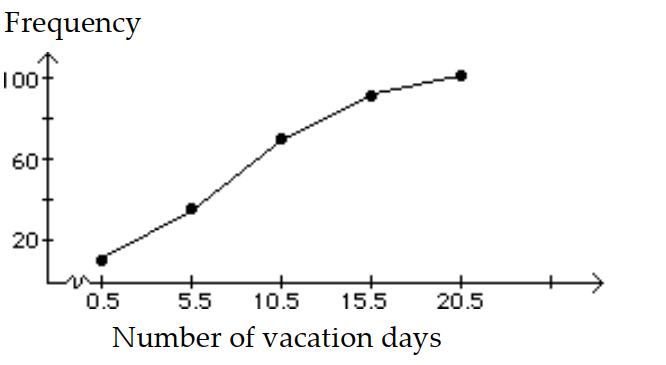
-
A)
B)
Question
Question
Question
Question
Question
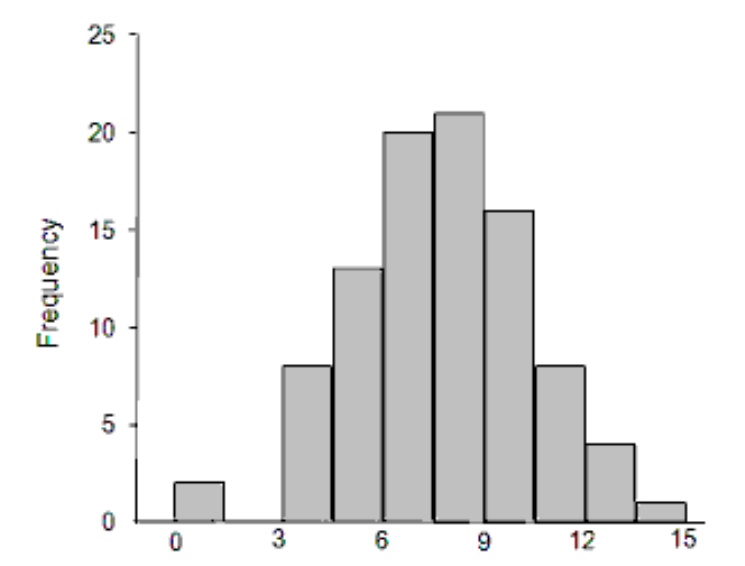
Describe the shape of the given histogram.
-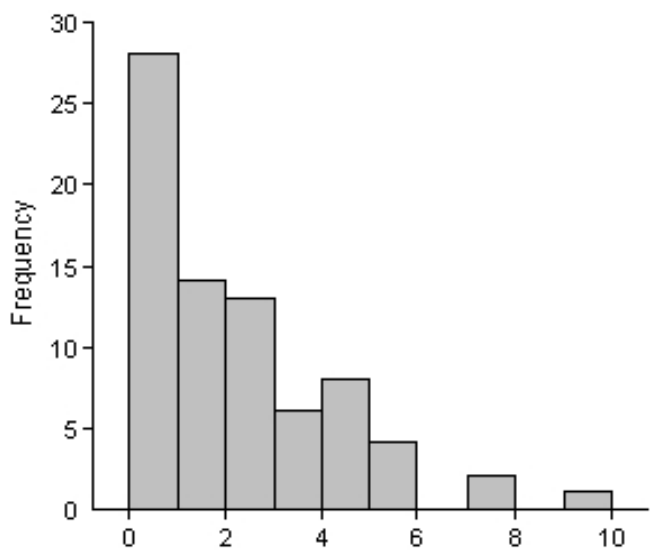
A) Uniform
B) Right skewed
C) Normal
D) Left skewed
-
A) Uniform
B) Right skewed
C) Normal
D) Left skewed
Question
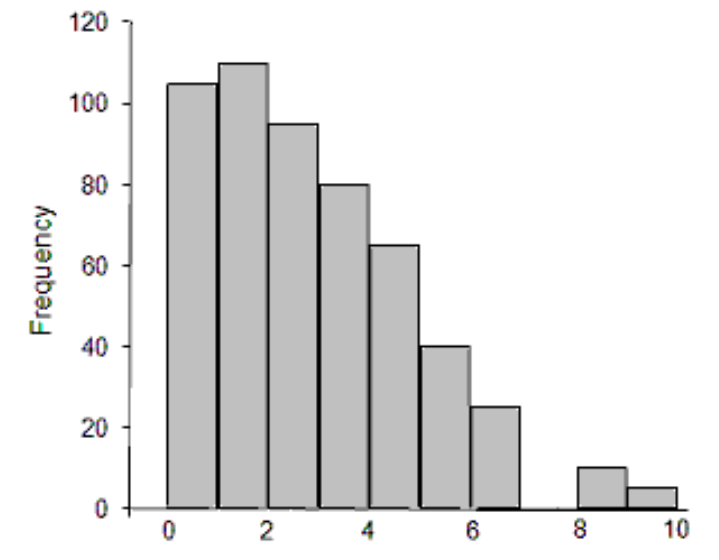
Describe the shape of the given histogram.
-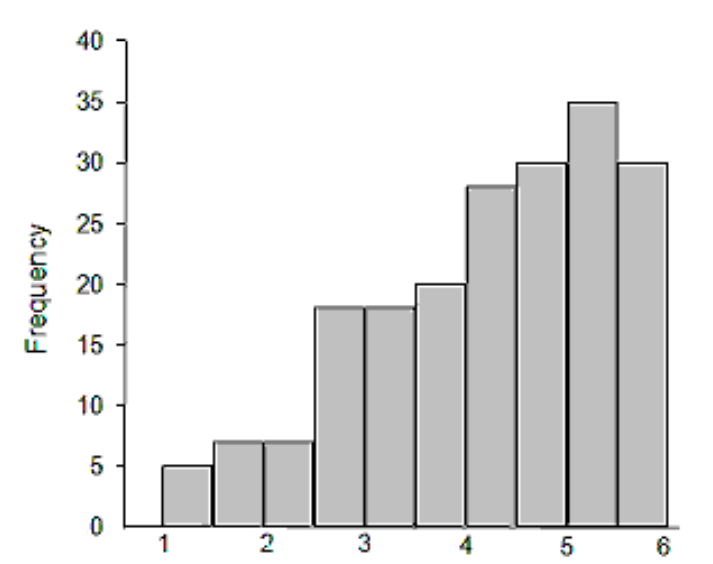
A) Right skewed
B) Uniform
C) Left skewed
D) Normal
-
A) Right skewed
B) Uniform
C) Left skewed
D) Normal
Question
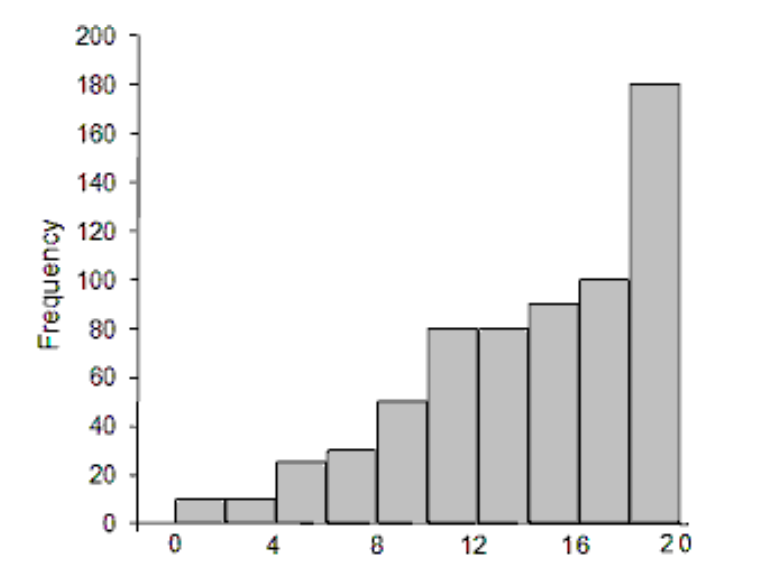
Describe the shape of the given histogram.
-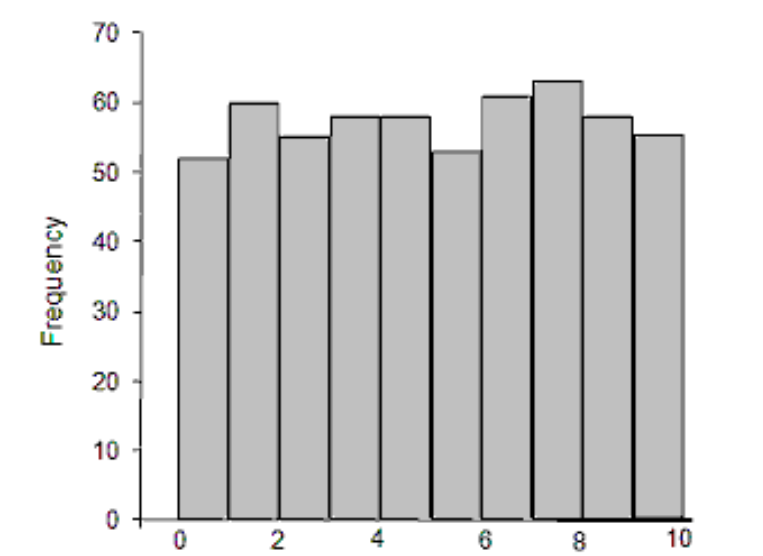
A) Uniform
B) Normal
C) Left skewed
D) Right skewed
-
A) Uniform
B) Normal
C) Left skewed
D) Right skewed
Question
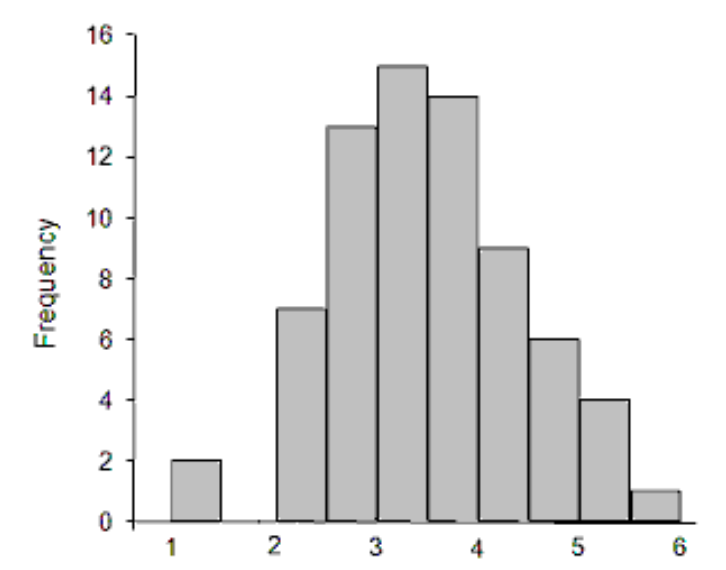
Describe the shape of the given histogram.
-
A) Uniform
B) Left skewed
C) Right skewed
D) Normal
-
A) Uniform
B) Left skewed
C) Right skewed
D) Normal
Question
Describe the shape of the given histogram.
-
A) Left skewed
B) Normal
C) Right skewed
D) Uniform
-
A) Left skewed
B) Normal
C) Right skewed
D) Uniform
Question
Describe the shape of the given histogram.
-
A) Normal
B) Uniform
C) Right skewed
D) Left skewed
-
A) Normal
B) Uniform
C) Right skewed
D) Left skewed
Question
Describe the shape of the given histogram.
-
A) Right skewed
B) Normal
C) Uniform
D) Left skewed
-
A) Right skewed
B) Normal
C) Uniform
D) Left skewed
Question
Describe the shape of the given histogram.
-
A) Uniform
B) Left skewed
C) Normal
D) Right skewed
-
A) Uniform
B) Left skewed
C) Normal
D) Right skewed
Question
Solve the problem.
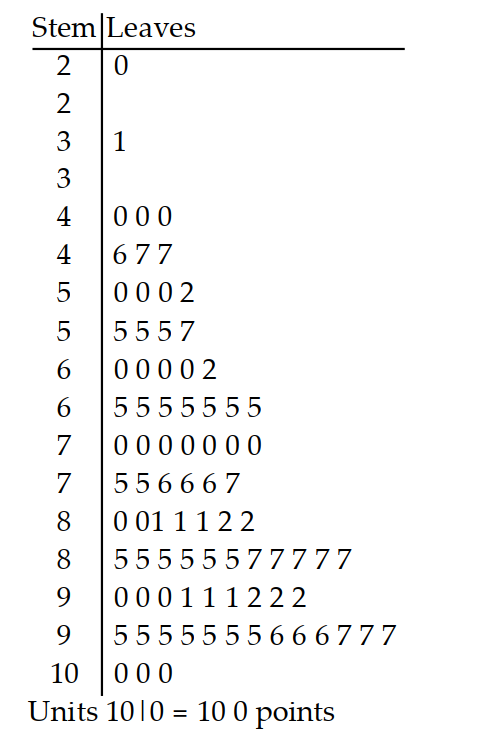
-The stem and leaf plot depicts the debt-to-income ratios of loan applicants at a nearby bank.
Describe the shape of the distribution.
A) Uniform
B) Right skewed
C) Left skewed
D) Normal
-The stem and leaf plot depicts the debt-to-income ratios of loan applicants at a nearby bank.
Describe the shape of the distribution.
A) Uniform
B) Right skewed
C) Left skewed
D) Normal
Question
Solve the problem.
-The stem and leaf plot depicts the debt-to-income ratios of loan applicants at a nearby bank.
How many applicants have debt-to-income ratios of at least ?
A) 31
B) 26
C) 27
D) 28
-The stem and leaf plot depicts the debt-to-income ratios of loan applicants at a nearby bank.
How many applicants have debt-to-income ratios of at least ?
A) 31
B) 26
C) 27
D) 28
Question
Solve the problem.
-The stem and leaf plot depicts the debt-to-income ratios of loan applicants at a nearby bank.
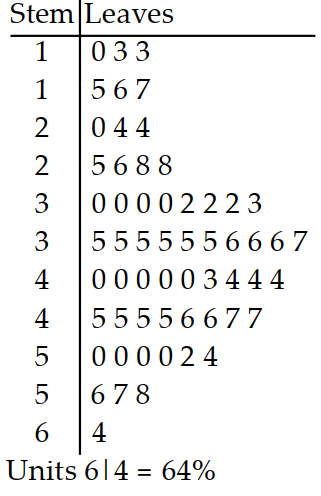
Do more applicants have debt-to-income ratios in the 20's or 50's?
A) 20 's
B) 50 's
-The stem and leaf plot depicts the debt-to-income ratios of loan applicants at a nearby bank.
Do more applicants have debt-to-income ratios in the 20's or 50's?
A) 20 's
B) 50 's
Question
Solve the problem.
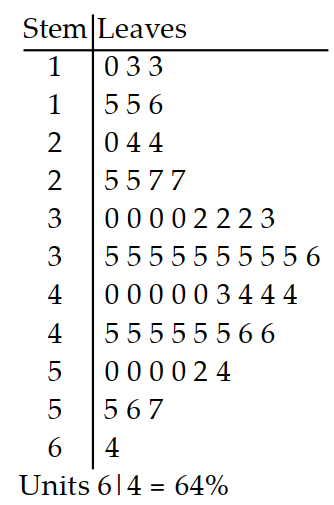
-The stem and leaf plot depicts the scores earned on individual driver tests in the month of July.
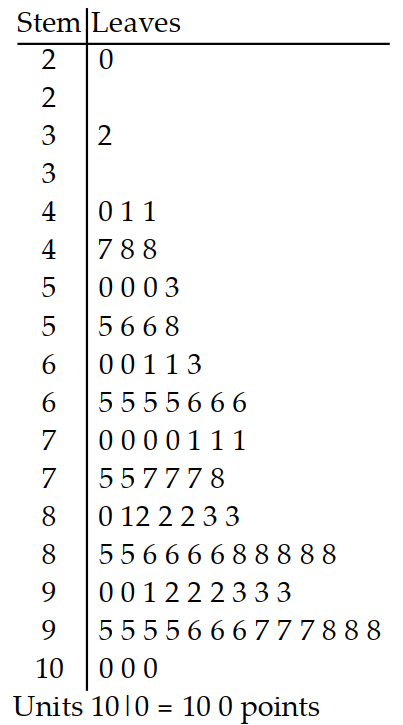
Describe the shape of the distribution.
A) Uniform
B) Right skewed
C) Normal
D) Left skewed
-The stem and leaf plot depicts the scores earned on individual driver tests in the month of July.
Describe the shape of the distribution.
A) Uniform
B) Right skewed
C) Normal
D) Left skewed
Question
Solve the problem.
-The stem and leaf plot depicts the scores earned on individual driver tests in the month of July.
If the minimum passing score is 80 points, how many people passed the driver test?
A) 41
B) 44
C) 42
D) 43
-The stem and leaf plot depicts the scores earned on individual driver tests in the month of July.
If the minimum passing score is 80 points, how many people passed the driver test?
A) 41
B) 44
C) 42
D) 43
Question
Solve the problem.
-The stem and leaf plot depicts the scores earned on individual driver tests in the month of July.
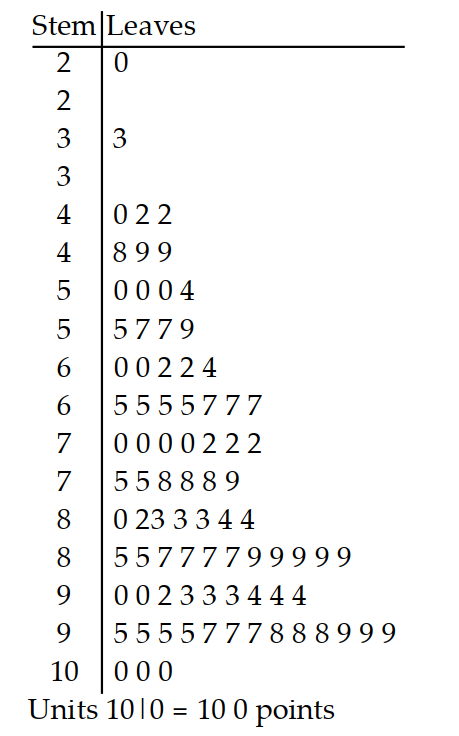
How many people scored fewer than 50 points?
A) 10
B) 8
C) 76
D) 11
-The stem and leaf plot depicts the scores earned on individual driver tests in the month of July.
How many people scored fewer than 50 points?
A) 10
B) 8
C) 76
D) 11
Question
Solve the problem.
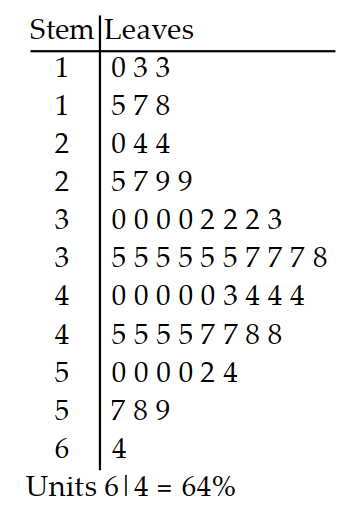
-The stem and leaf plot depicts the average weight (in pounds) of all four year olds receiving their annual influenza vaccine from the local health clinic.
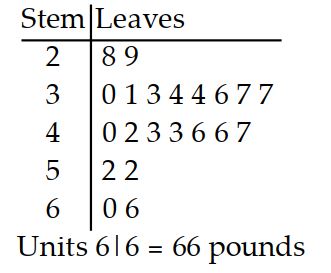
Describe the shape of the distribution.
A) Right skewed
B) Left skewed
C) Normal
D) Uniform
-The stem and leaf plot depicts the average weight (in pounds) of all four year olds receiving their annual influenza vaccine from the local health clinic.
Describe the shape of the distribution.
A) Right skewed
B) Left skewed
C) Normal
D) Uniform
Question
Solve the problem.
-The stem and leaf plot depicts the average weight (in pounds) of all four year olds receiving their annual influenza vaccine from the local health clinic.
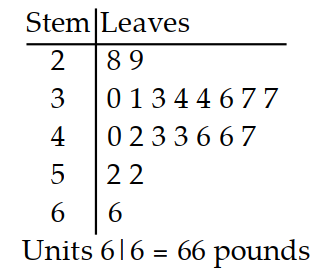
How many children weighed more than 40 pounds at the time of their influenza vaccine?
A) 8
B) 10
C) 9
D) 11
-The stem and leaf plot depicts the average weight (in pounds) of all four year olds receiving their annual influenza vaccine from the local health clinic.
How many children weighed more than 40 pounds at the time of their influenza vaccine?
A) 8
B) 10
C) 9
D) 11
Question
Solve the problem.
-The stem and leaf plot depicts the average weight (in pounds) of all four year olds receiving their annual influenza vaccine from the local health clinic.
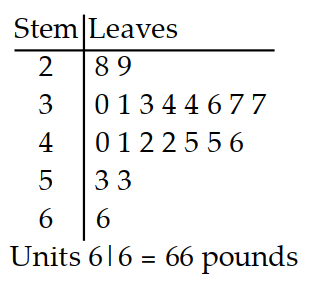
How many children weighed 45 pounds at the time of their influenza vaccine?
A) 2
B) 1
C) 3
D) 4
-The stem and leaf plot depicts the average weight (in pounds) of all four year olds receiving their annual influenza vaccine from the local health clinic.
How many children weighed 45 pounds at the time of their influenza vaccine?
A) 2
B) 1
C) 3
D) 4
Question
Solve the problem.
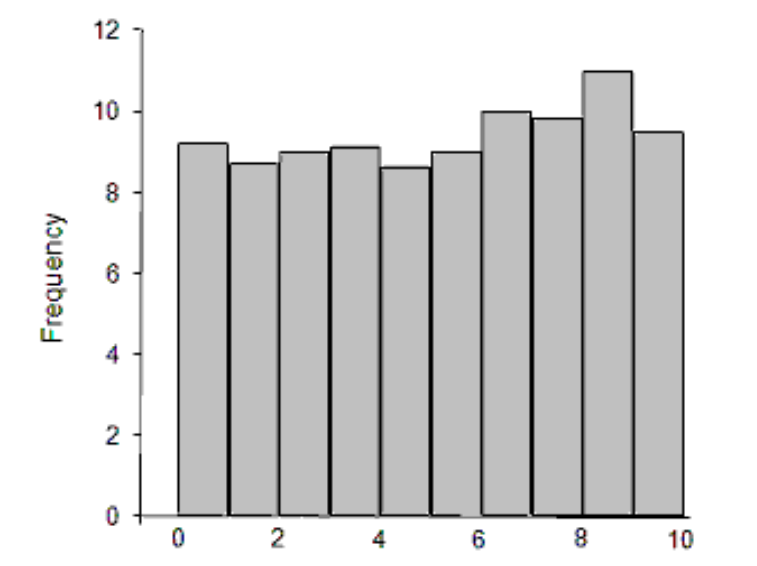
-The histogram shows the percentage of residential properties in negative equity or near negative equity for several states.
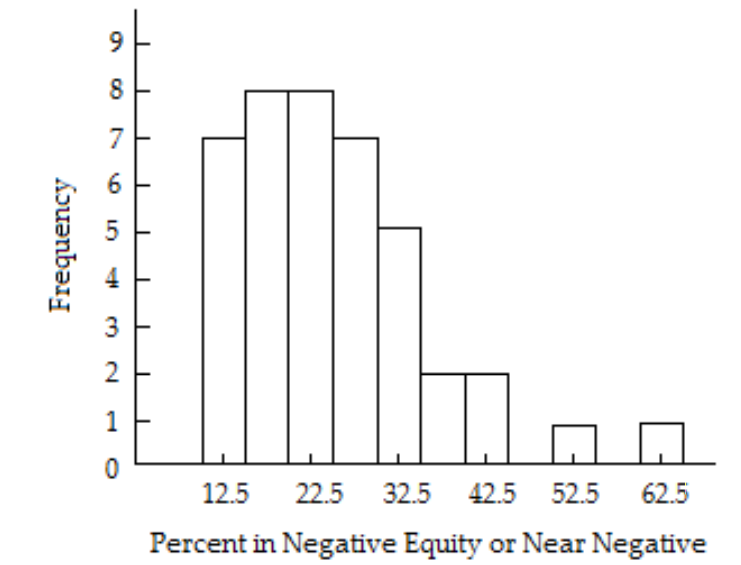
Describe the shape of the distribution.
A) Left skewed
B) Right skewed
C) Normal
D) Uniform
-The histogram shows the percentage of residential properties in negative equity or near negative equity for several states.
Describe the shape of the distribution.
A) Left skewed
B) Right skewed
C) Normal
D) Uniform
Question
Solve the problem.
-The histogram shows the percentage of residential properties in negative equity or near negative equity for several states.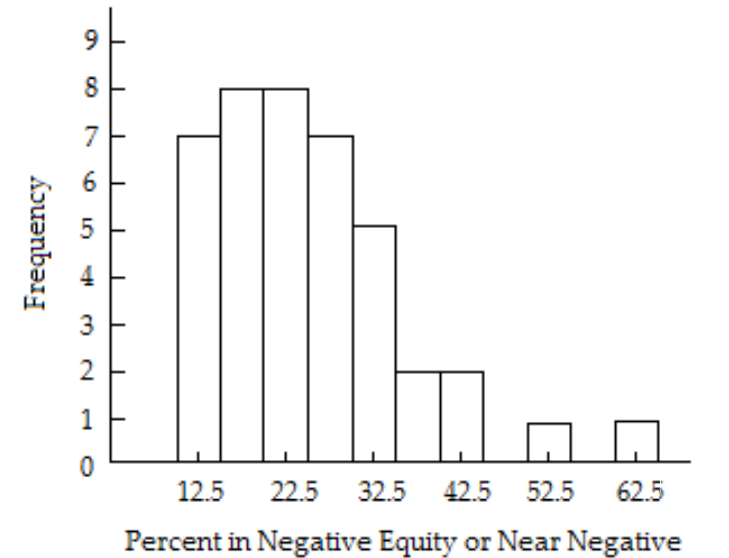
How many states had their percentage above ?
A) 32.5
B) 18
C) 11
D) 30
-The histogram shows the percentage of residential properties in negative equity or near negative equity for several states.
How many states had their percentage above ?
A) 32.5
B) 18
C) 11
D) 30
Question
Question
Question
Question
Question
Question
Question
Question
Question
Question
Find the mean for the frequency distribution. Round to the nearest tenth.
-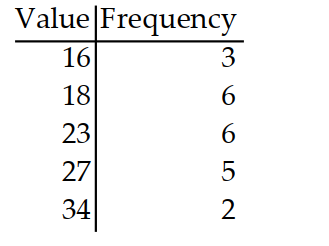
A) 22.6
B) 24.9
C) 23.3
D) 5.4
-
A) 22.6
B) 24.9
C) 23.3
D) 5.4
Question
Find the mean for the frequency distribution. Round to the nearest tenth.
-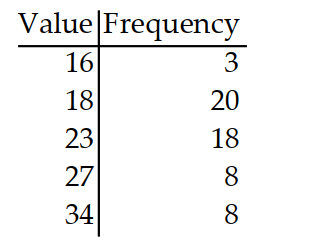
A) 2.1
B) 23.8
C) 26.3
D) 23.0
-
A) 2.1
B) 23.8
C) 26.3
D) 23.0
Question
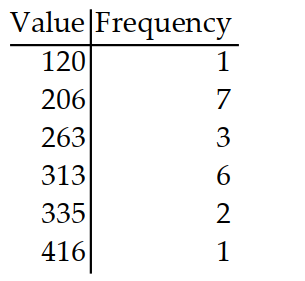
Find the mean for the frequency distribution. Round to the nearest tenth.
-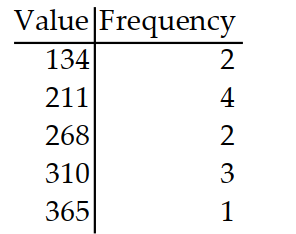
A) 107.3
B) 294.3
C) 245.3
D) 309.7
-
A) 107.3
B) 294.3
C) 245.3
D) 309.7
Question
Find the mean for the frequency distribution. Round to the nearest tenth.
-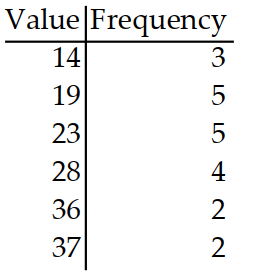
A) 26.8
B) 24.3
C) 23.3
D) 7.5
-
A) 26.8
B) 24.3
C) 23.3
D) 7.5
Question
Find the mean for the frequency distribution. Round to the nearest tenth.
-
A) 263.3
B) 265.8
C) 82.7
D) 295.3
-
A) 263.3
B) 265.8
C) 82.7
D) 295.3
Question
Question
Question
Question
Question
Question
Question
Question
Question
Question
Question
Question
Question
Question
Question
Question
Question
Question
Question
Question
Question
Question
Question
Solve the problem. Round to the nearest hundredth.
-Using the employment information in the table on Alpha Corporation, find the mean for the grouped data.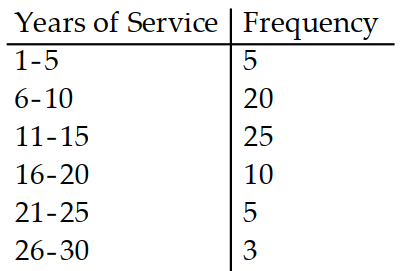
A) 12.93
B) 13.57
C) 15.50
D) 10.83
-Using the employment information in the table on Alpha Corporation, find the mean for the grouped data.
A) 12.93
B) 13.57
C) 15.50
D) 10.83
Question
Solve the problem. Round to the nearest hundredth.
-Using the information in the table on home sale prices in the city of Summerhill for the month of June, find the mean for the grouped data.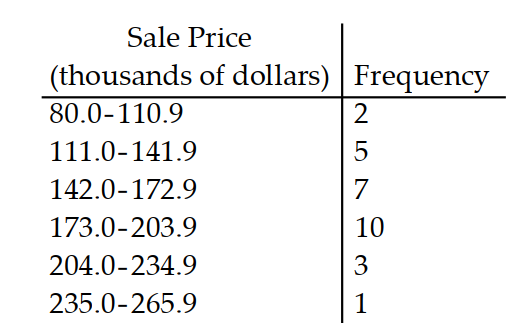
A) 188.45
B) 168.52
C) 157.50
D) 172.95
-Using the information in the table on home sale prices in the city of Summerhill for the month of June, find the mean for the grouped data.
A) 188.45
B) 168.52
C) 157.50
D) 172.95
Question
Solve the problem. Round to the nearest hundredth.
-The table summarizes the total incomes in the year 2000 of the residents of a particular town. Only those residents with full-time employment are included. Estimate the mean income for fully employed residents of the town in 2000 .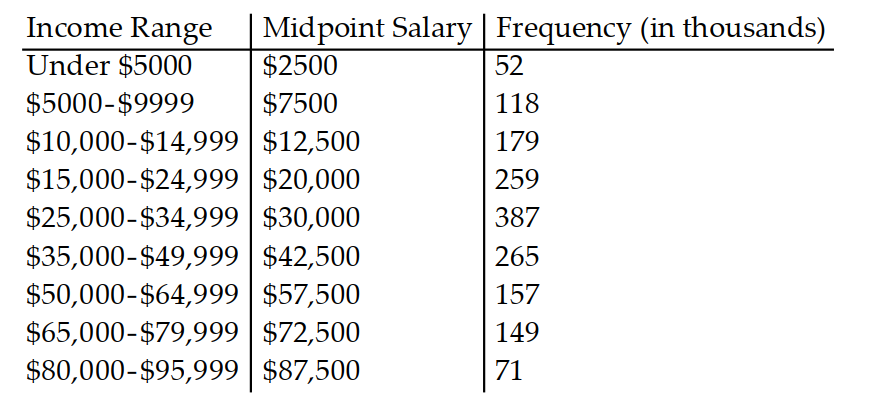
A)
B)
C)
D)
-The table summarizes the total incomes in the year 2000 of the residents of a particular town. Only those residents with full-time employment are included. Estimate the mean income for fully employed residents of the town in 2000 .
A)
B)
C)
D)
Question
Question
Question
Question
Question

Unlock Deck
Sign up to unlock the cards in this deck!
Unlock Deck
Unlock Deck
1/169
Play
Full screen (f)
Deck 10: Introduction to Statistics
1
Prepare a frequency distribution for the given data with columns for intervals and frequencies.
-A medical research team studied the ages of patients who had strokes caused by stress. The ages of 34 patients who suffered stress strokes were as follows. Use 8 intervals starting with 25-29.
29 30 36 41 45 50 57 61 28 50 36 58
60 38 36 47 40 32 58 46 61 40 55 32
61 56 45 46 62 36 38 40 50 27
A)
B)
C)
D)
2
Prepare a frequency distribution for the given data with columns for intervals and frequencies.
-The following is the number of hours students worked per week at after-school jobs. Use five intervals, starting with .
3 7 13 19 20 20 17 14 7 2 6 10 16 24 18 10 4 9 14 19
A)
B)
C)
D)
-The following is the number of hours students worked per week at after-school jobs. Use five intervals, starting with .
3 7 13 19 20 20 17 14 7 2 6 10 16 24 18 10 4 9 14 19
A)
B)
C)
D)
3
Prepare a frequency distribution for the given data with columns for intervals and frequencies.
-The following is the number of hours students studied per week on average. Use five intervals, starting with .
A)
B)
C)
D)
-The following is the number of hours students studied per week on average. Use five intervals, starting with .
A)
B)
C)
D)
4
Prepare a frequency distribution for the given data with columns for intervals and frequencies.
-On a 25-point math test student scores were as follows. Use five intervals, starting with 0 - 4 .
A)
B)
C)
D)
-On a 25-point math test student scores were as follows. Use five intervals, starting with 0 - 4 .
A)
B)
C)
D)
Unlock Deck
Unlock for access to all 169 flashcards in this deck.
Unlock Deck
k this deck
5
Prepare a frequency distribution for the given data with columns for intervals and frequencies.
-The following is the number of bonus points that 24 students have gotten for extra work. Use six intervals, starting with 0 - 49.
A)
B)
C)
D)
-The following is the number of bonus points that 24 students have gotten for extra work. Use six intervals, starting with 0 - 49.
A)
B)
C)
D)
Unlock Deck
Unlock for access to all 169 flashcards in this deck.
Unlock Deck
k this deck
6
Construct the specified histogram.
-The frequency table below shows the number of days off in a given year for 30 police detectives.
Construct a histogram.
-The frequency table below shows the number of days off in a given year for 30 police detectives.
Construct a histogram.
Unlock Deck
Unlock for access to all 169 flashcards in this deck.
Unlock Deck
k this deck
7
Construct the specified histogram.
-In a survey, 20 voters were asked their age. The results are summarized in the frequency table below. Construct a histogram corresponding to the frequency table.
-In a survey, 20 voters were asked their age. The results are summarized in the frequency table below. Construct a histogram corresponding to the frequency table.
Unlock Deck
Unlock for access to all 169 flashcards in this deck.
Unlock Deck
k this deck
8
Construct the specified histogram.
-In a survey, 20 people were asked how many magazines they had purchased during the previous year. The results are shown in the frequency distribution below. Construct a histogram.
-In a survey, 20 people were asked how many magazines they had purchased during the previous year. The results are shown in the frequency distribution below. Construct a histogram.
Unlock Deck
Unlock for access to all 169 flashcards in this deck.
Unlock Deck
k this deck
9
Construct the specified histogram.
-In a survey, 26 voters were asked their age. The results are shown below. Construct a histogram to represent the data. Use 5 intervals.
-In a survey, 26 voters were asked their age. The results are shown below. Construct a histogram to represent the data. Use 5 intervals.
Unlock Deck
Unlock for access to all 169 flashcards in this deck.
Unlock Deck
k this deck
10
Construct a frequency polygon.
-
A)
B)
-
A)
B)
Unlock Deck
Unlock for access to all 169 flashcards in this deck.
Unlock Deck
k this deck
11
Construct a frequency polygon.
-
A)
B)
-
A)
B)
Unlock Deck
Unlock for access to all 169 flashcards in this deck.
Unlock Deck
k this deck
12
Construct a frequency polygon.
-
A)
B)
-
A)
B)
Unlock Deck
Unlock for access to all 169 flashcards in this deck.
Unlock Deck
k this deck
13
Construct a frequency polygon.
-
A)
B)
-
A)
B)
Unlock Deck
Unlock for access to all 169 flashcards in this deck.
Unlock Deck
k this deck
14
Construct a-stem and leaf display for the given data table.
-
-
Unlock Deck
Unlock for access to all 169 flashcards in this deck.
Unlock Deck
k this deck
15
Construct a-stem and leaf display for the given data table.
-
-
Unlock Deck
Unlock for access to all 169 flashcards in this deck.
Unlock Deck
k this deck
16
Construct a-stem and leaf display for the given data table.
-
-
Unlock Deck
Unlock for access to all 169 flashcards in this deck.
Unlock Deck
k this deck
17
Construct a-stem and leaf display for the given data table.
-
-
Unlock Deck
Unlock for access to all 169 flashcards in this deck.
Unlock Deck
k this deck
18
Describe the shape of the given histogram.
-
A) Uniform
B) Right skewed
C) Normal
D) Left skewed
-
A) Uniform
B) Right skewed
C) Normal
D) Left skewed
Unlock Deck
Unlock for access to all 169 flashcards in this deck.
Unlock Deck
k this deck
19
Describe the shape of the given histogram.
-
A) Right skewed
B) Uniform
C) Left skewed
D) Normal
-
A) Right skewed
B) Uniform
C) Left skewed
D) Normal
Unlock Deck
Unlock for access to all 169 flashcards in this deck.
Unlock Deck
k this deck
20
Describe the shape of the given histogram.
-
A) Uniform
B) Normal
C) Left skewed
D) Right skewed
-
A) Uniform
B) Normal
C) Left skewed
D) Right skewed
Unlock Deck
Unlock for access to all 169 flashcards in this deck.
Unlock Deck
k this deck
21
Describe the shape of the given histogram.
-
A) Uniform
B) Left skewed
C) Right skewed
D) Normal
-
A) Uniform
B) Left skewed
C) Right skewed
D) Normal
Unlock Deck
Unlock for access to all 169 flashcards in this deck.
Unlock Deck
k this deck
22
Describe the shape of the given histogram.
-
A) Left skewed
B) Normal
C) Right skewed
D) Uniform
-
A) Left skewed
B) Normal
C) Right skewed
D) Uniform
Unlock Deck
Unlock for access to all 169 flashcards in this deck.
Unlock Deck
k this deck
23
Describe the shape of the given histogram.
-
A) Normal
B) Uniform
C) Right skewed
D) Left skewed
-
A) Normal
B) Uniform
C) Right skewed
D) Left skewed
Unlock Deck
Unlock for access to all 169 flashcards in this deck.
Unlock Deck
k this deck
24
Describe the shape of the given histogram.
-
A) Right skewed
B) Normal
C) Uniform
D) Left skewed
-
A) Right skewed
B) Normal
C) Uniform
D) Left skewed
Unlock Deck
Unlock for access to all 169 flashcards in this deck.
Unlock Deck
k this deck
25
Describe the shape of the given histogram.
-
A) Uniform
B) Left skewed
C) Normal
D) Right skewed
-
A) Uniform
B) Left skewed
C) Normal
D) Right skewed
Unlock Deck
Unlock for access to all 169 flashcards in this deck.
Unlock Deck
k this deck
26
Solve the problem.
-The stem and leaf plot depicts the debt-to-income ratios of loan applicants at a nearby bank.
Describe the shape of the distribution.
A) Uniform
B) Right skewed
C) Left skewed
D) Normal
-The stem and leaf plot depicts the debt-to-income ratios of loan applicants at a nearby bank.
Describe the shape of the distribution.
A) Uniform
B) Right skewed
C) Left skewed
D) Normal
Unlock Deck
Unlock for access to all 169 flashcards in this deck.
Unlock Deck
k this deck
27
Solve the problem.
-The stem and leaf plot depicts the debt-to-income ratios of loan applicants at a nearby bank.
How many applicants have debt-to-income ratios of at least ?
A) 31
B) 26
C) 27
D) 28
-The stem and leaf plot depicts the debt-to-income ratios of loan applicants at a nearby bank.
How many applicants have debt-to-income ratios of at least ?
A) 31
B) 26
C) 27
D) 28
Unlock Deck
Unlock for access to all 169 flashcards in this deck.
Unlock Deck
k this deck
28
Solve the problem.
-The stem and leaf plot depicts the debt-to-income ratios of loan applicants at a nearby bank.
Do more applicants have debt-to-income ratios in the 20's or 50's?
A) 20 's
B) 50 's
-The stem and leaf plot depicts the debt-to-income ratios of loan applicants at a nearby bank.
Do more applicants have debt-to-income ratios in the 20's or 50's?
A) 20 's
B) 50 's
Unlock Deck
Unlock for access to all 169 flashcards in this deck.
Unlock Deck
k this deck
29
Solve the problem.
-The stem and leaf plot depicts the scores earned on individual driver tests in the month of July.
Describe the shape of the distribution.
A) Uniform
B) Right skewed
C) Normal
D) Left skewed
-The stem and leaf plot depicts the scores earned on individual driver tests in the month of July.
Describe the shape of the distribution.
A) Uniform
B) Right skewed
C) Normal
D) Left skewed
Unlock Deck
Unlock for access to all 169 flashcards in this deck.
Unlock Deck
k this deck
30
Solve the problem.
-The stem and leaf plot depicts the scores earned on individual driver tests in the month of July.
If the minimum passing score is 80 points, how many people passed the driver test?
A) 41
B) 44
C) 42
D) 43
-The stem and leaf plot depicts the scores earned on individual driver tests in the month of July.
If the minimum passing score is 80 points, how many people passed the driver test?
A) 41
B) 44
C) 42
D) 43
Unlock Deck
Unlock for access to all 169 flashcards in this deck.
Unlock Deck
k this deck
31
Solve the problem.
-The stem and leaf plot depicts the scores earned on individual driver tests in the month of July.
How many people scored fewer than 50 points?
A) 10
B) 8
C) 76
D) 11
-The stem and leaf plot depicts the scores earned on individual driver tests in the month of July.
How many people scored fewer than 50 points?
A) 10
B) 8
C) 76
D) 11
Unlock Deck
Unlock for access to all 169 flashcards in this deck.
Unlock Deck
k this deck
32
Solve the problem.
-The stem and leaf plot depicts the average weight (in pounds) of all four year olds receiving their annual influenza vaccine from the local health clinic.
Describe the shape of the distribution.
A) Right skewed
B) Left skewed
C) Normal
D) Uniform
-The stem and leaf plot depicts the average weight (in pounds) of all four year olds receiving their annual influenza vaccine from the local health clinic.
Describe the shape of the distribution.
A) Right skewed
B) Left skewed
C) Normal
D) Uniform
Unlock Deck
Unlock for access to all 169 flashcards in this deck.
Unlock Deck
k this deck
33
Solve the problem.
-The stem and leaf plot depicts the average weight (in pounds) of all four year olds receiving their annual influenza vaccine from the local health clinic.
How many children weighed more than 40 pounds at the time of their influenza vaccine?
A) 8
B) 10
C) 9
D) 11
-The stem and leaf plot depicts the average weight (in pounds) of all four year olds receiving their annual influenza vaccine from the local health clinic.
How many children weighed more than 40 pounds at the time of their influenza vaccine?
A) 8
B) 10
C) 9
D) 11
Unlock Deck
Unlock for access to all 169 flashcards in this deck.
Unlock Deck
k this deck
34
Solve the problem.
-The stem and leaf plot depicts the average weight (in pounds) of all four year olds receiving their annual influenza vaccine from the local health clinic.
How many children weighed 45 pounds at the time of their influenza vaccine?
A) 2
B) 1
C) 3
D) 4
-The stem and leaf plot depicts the average weight (in pounds) of all four year olds receiving their annual influenza vaccine from the local health clinic.
How many children weighed 45 pounds at the time of their influenza vaccine?
A) 2
B) 1
C) 3
D) 4
Unlock Deck
Unlock for access to all 169 flashcards in this deck.
Unlock Deck
k this deck
35
Solve the problem.
-The histogram shows the percentage of residential properties in negative equity or near negative equity for several states.
Describe the shape of the distribution.
A) Left skewed
B) Right skewed
C) Normal
D) Uniform
-The histogram shows the percentage of residential properties in negative equity or near negative equity for several states.
Describe the shape of the distribution.
A) Left skewed
B) Right skewed
C) Normal
D) Uniform
Unlock Deck
Unlock for access to all 169 flashcards in this deck.
Unlock Deck
k this deck
36
Solve the problem.
-The histogram shows the percentage of residential properties in negative equity or near negative equity for several states.
How many states had their percentage above ?
A) 32.5
B) 18
C) 11
D) 30
-The histogram shows the percentage of residential properties in negative equity or near negative equity for several states.
How many states had their percentage above ?
A) 32.5
B) 18
C) 11
D) 30
Unlock Deck
Unlock for access to all 169 flashcards in this deck.
Unlock Deck
k this deck
37
Find the mean for the list of numbers. Round to the nearest tenth.
-
A)2 4
B) 17.5
C) 17
D) 15.5
-
A)2 4
B) 17.5
C) 17
D) 15.5
Unlock Deck
Unlock for access to all 169 flashcards in this deck.
Unlock Deck
k this deck
38
Find the mean for the list of numbers. Round to the nearest tenth.
-
A) 69.1
B) 69.6
C) 70.1
D) 87
-
A) 69.1
B) 69.6
C) 70.1
D) 87
Unlock Deck
Unlock for access to all 169 flashcards in this deck.
Unlock Deck
k this deck
39
Find the mean for the list of numbers. Round to the nearest tenth.
-
A) 6.7
B) 8.7
C) 8.2
D) 9.8
-
A) 6.7
B) 8.7
C) 8.2
D) 9.8
Unlock Deck
Unlock for access to all 169 flashcards in this deck.
Unlock Deck
k this deck
40
Find the mean for the list of numbers. Round to the nearest tenth.
-
A) 7.2
B) 9.2
C) 9
D) 7.7
-
A) 7.2
B) 9.2
C) 9
D) 7.7
Unlock Deck
Unlock for access to all 169 flashcards in this deck.
Unlock Deck
k this deck
41
Find the mean for the list of numbers. Round to the nearest tenth.
-
A) 60.2
B) 72.2
C) 59.7
D) 60.7
-
A) 60.2
B) 72.2
C) 59.7
D) 60.7
Unlock Deck
Unlock for access to all 169 flashcards in this deck.
Unlock Deck
k this deck
42
Find the mean for the list of numbers. Round to the nearest tenth.
-
A) 154.8
B) 206.3
C) 154.3
D) 155.3
-
A) 154.8
B) 206.3
C) 154.3
D) 155.3
Unlock Deck
Unlock for access to all 169 flashcards in this deck.
Unlock Deck
k this deck
43
Find the mean for the list of numbers. Round to the nearest tenth.
-
A)
B) 24,918
C) 24,425
D) 20,765
-
A)
B) 24,918
C) 24,425
D) 20,765
Unlock Deck
Unlock for access to all 169 flashcards in this deck.
Unlock Deck
k this deck
44
Find the mean for the list of numbers. Round to the nearest tenth.
-
A) 9
B) 8.5
C) 8.1
D) 7.7
-
A) 9
B) 8.5
C) 8.1
D) 7.7
Unlock Deck
Unlock for access to all 169 flashcards in this deck.
Unlock Deck
k this deck
45
Find the mean for the list of numbers. Round to the nearest tenth.
-
A) 40.5
B) 38
C) 34.6
D) 36.2
-
A) 40.5
B) 38
C) 34.6
D) 36.2
Unlock Deck
Unlock for access to all 169 flashcards in this deck.
Unlock Deck
k this deck
46
Find the mean for the frequency distribution. Round to the nearest tenth.
-
A) 22.6
B) 24.9
C) 23.3
D) 5.4
-
A) 22.6
B) 24.9
C) 23.3
D) 5.4
Unlock Deck
Unlock for access to all 169 flashcards in this deck.
Unlock Deck
k this deck
47
Find the mean for the frequency distribution. Round to the nearest tenth.
-
A) 2.1
B) 23.8
C) 26.3
D) 23.0
-
A) 2.1
B) 23.8
C) 26.3
D) 23.0
Unlock Deck
Unlock for access to all 169 flashcards in this deck.
Unlock Deck
k this deck
48
Find the mean for the frequency distribution. Round to the nearest tenth.
-
A) 107.3
B) 294.3
C) 245.3
D) 309.7
-
A) 107.3
B) 294.3
C) 245.3
D) 309.7
Unlock Deck
Unlock for access to all 169 flashcards in this deck.
Unlock Deck
k this deck
49
Find the mean for the frequency distribution. Round to the nearest tenth.
-
A) 26.8
B) 24.3
C) 23.3
D) 7.5
-
A) 26.8
B) 24.3
C) 23.3
D) 7.5
Unlock Deck
Unlock for access to all 169 flashcards in this deck.
Unlock Deck
k this deck
50
Find the mean for the frequency distribution. Round to the nearest tenth.
-
A) 263.3
B) 265.8
C) 82.7
D) 295.3
-
A) 263.3
B) 265.8
C) 82.7
D) 295.3
Unlock Deck
Unlock for access to all 169 flashcards in this deck.
Unlock Deck
k this deck
51
Find the median.
-
A) 23
B) 14
C) 32
D) 21
-
A) 23
B) 14
C) 32
D) 21
Unlock Deck
Unlock for access to all 169 flashcards in this deck.
Unlock Deck
k this deck
52
Find the median.
-
A) 61
B) 46
C) 38
D) 49
-
A) 61
B) 46
C) 38
D) 49
Unlock Deck
Unlock for access to all 169 flashcards in this deck.
Unlock Deck
k this deck
53
Find the median.
-
A) 39
B) 25
C) 11
D) 28
-
A) 39
B) 25
C) 11
D) 28
Unlock Deck
Unlock for access to all 169 flashcards in this deck.
Unlock Deck
k this deck
54
Find the median.
-
A) 25
B) 23.5
C) 29
D) 27
-
A) 25
B) 23.5
C) 29
D) 27
Unlock Deck
Unlock for access to all 169 flashcards in this deck.
Unlock Deck
k this deck
55
Find the median.
-
A) 22.5
B) 23.5
C) 22
D) 25
-
A) 22.5
B) 23.5
C) 22
D) 25
Unlock Deck
Unlock for access to all 169 flashcards in this deck.
Unlock Deck
k this deck
56
Find the median.
-
A) 25
B) 27
C) 21
D) 24
-
A) 25
B) 27
C) 21
D) 24
Unlock Deck
Unlock for access to all 169 flashcards in this deck.
Unlock Deck
k this deck
57
Find the median.
-
A) 214.0
B) 428
C) 35.5
D) None of these
-
A) 214.0
B) 428
C) 35.5
D) None of these
Unlock Deck
Unlock for access to all 169 flashcards in this deck.
Unlock Deck
k this deck
58
Find the median.
-The number of vehicles passing through a bank drive-up line during each 15-minute period was recorded. The results are shown below. Find the median number of vehicles going through the line in a fifteen-minute period.
A) 22.85
B) 24
C) 27
D) 23
-The number of vehicles passing through a bank drive-up line during each 15-minute period was recorded. The results are shown below. Find the median number of vehicles going through the line in a fifteen-minute period.
A) 22.85
B) 24
C) 27
D) 23
Unlock Deck
Unlock for access to all 169 flashcards in this deck.
Unlock Deck
k this deck
59
Find the median.
-The weights (in ounces) of 21 cookies are shown. Find the median weight. Round to the nearest hundredth.
A) 1.48 ounces
B) 0.92 ounces
C) 0.69 ounces
D) 0.81 ounces
-The weights (in ounces) of 21 cookies are shown. Find the median weight. Round to the nearest hundredth.
A) 1.48 ounces
B) 0.92 ounces
C) 0.69 ounces
D) 0.81 ounces
Unlock Deck
Unlock for access to all 169 flashcards in this deck.
Unlock Deck
k this deck
60
Find the median.
-The normal monthly precipitation (in inches) for August is listed for 20 different U.S. cities. Find the median of the data. Round to the nearest hundredth.
A) 3.45 in.
B) .
C) 2.94 in.
D) .
-The normal monthly precipitation (in inches) for August is listed for 20 different U.S. cities. Find the median of the data. Round to the nearest hundredth.
A) 3.45 in.
B) .
C) 2.94 in.
D) .
Unlock Deck
Unlock for access to all 169 flashcards in this deck.
Unlock Deck
k this deck
61
Find the mode or modes.
-
A) 37.1
B) 49
C) 46
D) 32
-
A) 37.1
B) 49
C) 46
D) 32
Unlock Deck
Unlock for access to all 169 flashcards in this deck.
Unlock Deck
k this deck
62
Find the mode or modes.
-
A) 68
B) 65.2
C) 97,68
D) 97
-
A) 68
B) 65.2
C) 97,68
D) 97
Unlock Deck
Unlock for access to all 169 flashcards in this deck.
Unlock Deck
k this deck
63
Find the mode or modes.
-
A) 7.08
B) 7.41
C) 7.56
D) 7.517
-
A) 7.08
B) 7.41
C) 7.56
D) 7.517
Unlock Deck
Unlock for access to all 169 flashcards in this deck.
Unlock Deck
k this deck
64
Find the mode or modes.
-
A) 54.1
B) 25
C) 42.5
D) 95
-
A) 54.1
B) 25
C) 42.5
D) 95
Unlock Deck
Unlock for access to all 169 flashcards in this deck.
Unlock Deck
k this deck
65
Find the mean
-Bill kept track of the number of hours he spent exercising each week. The results for four months are shown below. Find the mean number of hours Bill spent exercising per week. Round to the nearest hundredth.
A) 7.40
B) 7.84
C) 7.61
D) 7.01
-Bill kept track of the number of hours he spent exercising each week. The results for four months are shown below. Find the mean number of hours Bill spent exercising per week. Round to the nearest hundredth.
A) 7.40
B) 7.84
C) 7.61
D) 7.01
Unlock Deck
Unlock for access to all 169 flashcards in this deck.
Unlock Deck
k this deck
66
Find the mean
-The normal monthly precipitation (in inches) for August is listed for 20 different U.S. cities. Find the mean of the data. Round to the nearest hundredth.
A) 3.27 in.
B) .
C) 2.80 in.
D) 2.94 in.
-The normal monthly precipitation (in inches) for August is listed for 20 different U.S. cities. Find the mean of the data. Round to the nearest hundredth.
A) 3.27 in.
B) .
C) 2.80 in.
D) 2.94 in.
Unlock Deck
Unlock for access to all 169 flashcards in this deck.
Unlock Deck
k this deck
67
Find the mean
-The six Cane brothers spent , and on groceries. Find the mean grocery bill.
A)
B)
C)
D)
-The six Cane brothers spent , and on groceries. Find the mean grocery bill.
A)
B)
C)
D)
Unlock Deck
Unlock for access to all 169 flashcards in this deck.
Unlock Deck
k this deck
68
Find the mean
-Six college buddies bought each other Christmas gifts. They spent , , and . Find the mean amount spent for Christmas gifts.
A)
B)
C)
D)
-Six college buddies bought each other Christmas gifts. They spent , , and . Find the mean amount spent for Christmas gifts.
A)
B)
C)
D)
Unlock Deck
Unlock for access to all 169 flashcards in this deck.
Unlock Deck
k this deck
69
Find the mean
-Frank's Furniture employees earned , and for last week. Find the mean wage.
A)
B)
C)
D)
-Frank's Furniture employees earned , and for last week. Find the mean wage.
A)
B)
C)
D)
Unlock Deck
Unlock for access to all 169 flashcards in this deck.
Unlock Deck
k this deck
70
Find the mean
-The local Tupperware dealers earned commissions last month of , , and .
A)
B)
C)
D)
-The local Tupperware dealers earned commissions last month of , , and .
A)
B)
C)
D)
Unlock Deck
Unlock for access to all 169 flashcards in this deck.
Unlock Deck
k this deck
71
Find the mean
-The Wellspring Company's fleet of trucks get 20, 9, 19, 8, 16, 9, and 24 miles per gallon. Round to the nearest whole number.
A) 14 miles per gallon
B) 16 miles per gallon
C) 18 miles per gallon
D) 15 miles per gallon
-The Wellspring Company's fleet of trucks get 20, 9, 19, 8, 16, 9, and 24 miles per gallon. Round to the nearest whole number.
A) 14 miles per gallon
B) 16 miles per gallon
C) 18 miles per gallon
D) 15 miles per gallon
Unlock Deck
Unlock for access to all 169 flashcards in this deck.
Unlock Deck
k this deck
72
Find the mean
-The weight gains (in pounds) over a one month period of 10 patients on a special diet were: 7.7, . Find the mean. Round your answer to the nearest hundredth.
A) 2.41 pounds
B) 2.30 pounds
C) 2.54 pounds
D) 5.01 pounds
-The weight gains (in pounds) over a one month period of 10 patients on a special diet were: 7.7, . Find the mean. Round your answer to the nearest hundredth.
A) 2.41 pounds
B) 2.30 pounds
C) 2.54 pounds
D) 5.01 pounds
Unlock Deck
Unlock for access to all 169 flashcards in this deck.
Unlock Deck
k this deck
73
Solve the problem. Round to the nearest hundredth.
-Using the employment information in the table on Alpha Corporation, find the mean for the grouped data.
A) 12.93
B) 13.57
C) 15.50
D) 10.83
-Using the employment information in the table on Alpha Corporation, find the mean for the grouped data.
A) 12.93
B) 13.57
C) 15.50
D) 10.83
Unlock Deck
Unlock for access to all 169 flashcards in this deck.
Unlock Deck
k this deck
74
Solve the problem. Round to the nearest hundredth.
-Using the information in the table on home sale prices in the city of Summerhill for the month of June, find the mean for the grouped data.
A) 188.45
B) 168.52
C) 157.50
D) 172.95
-Using the information in the table on home sale prices in the city of Summerhill for the month of June, find the mean for the grouped data.
A) 188.45
B) 168.52
C) 157.50
D) 172.95
Unlock Deck
Unlock for access to all 169 flashcards in this deck.
Unlock Deck
k this deck
75
Solve the problem. Round to the nearest hundredth.
-The table summarizes the total incomes in the year 2000 of the residents of a particular town. Only those residents with full-time employment are included. Estimate the mean income for fully employed residents of the town in 2000 .
A)
B)
C)
D)
-The table summarizes the total incomes in the year 2000 of the residents of a particular town. Only those residents with full-time employment are included. Estimate the mean income for fully employed residents of the town in 2000 .
A)
B)
C)
D)
Unlock Deck
Unlock for access to all 169 flashcards in this deck.
Unlock Deck
k this deck
76
Calculate the weighted average.
-Annie enrolled in a class where the homework counts as of the final grade, two midterm exams count as each, and a final exam counts as of the final grade. Annie earned on the homework, and on the two midterm exams, and on the final exam. What is Annie's final average? If necessary, round to the nearest hundredth.
A)
B)
C)
D)
Unlock Deck
Unlock for access to all 169 flashcards in this deck.
Unlock Deck
k this deck
77
Calculate the weighted average.
-Boris enrolled in a course where attendance counted as of the final grade, a midterm paper counted as of the final grade, and a final paper counted as of the final grade. He had attendance. He earned a score of on the midterm paper and a on his final paper. What is Boris' final average? If necessary, round to the nearest hundredth.
A)
B)
C)
D)
Unlock Deck
Unlock for access to all 169 flashcards in this deck.
Unlock Deck
k this deck
78
Calculate the weighted average.
-Rafi enrolled in a class where attendance counted as of the final grade, quizzes counted as , one midterm exam counted as , and the final exam counted as . Rafi earned on attendance, on the quizzes, and on the midterm exam. If is needed to earn a grade of , what is the minimum score Rafi needs to earn on the final exam in order to earn a final grade of ? Round to the nearest hundredth.
A)
B)
C)
D)
Unlock Deck
Unlock for access to all 169 flashcards in this deck.
Unlock Deck
k this deck
79
Find the range for the set of data numbers.
-
A) 5
B) 20
C) 1
D) 19
-
A) 5
B) 20
C) 1
D) 19
Unlock Deck
Unlock for access to all 169 flashcards in this deck.
Unlock Deck
k this deck
80
Find the range for the set of data numbers.
-
A) 15
B) 51
C) 36
D) 12
-
A) 15
B) 51
C) 36
D) 12
Unlock Deck
Unlock for access to all 169 flashcards in this deck.
Unlock Deck
k this deck
Unlock Deck
Unlock for access to all 169 flashcards in this deck.


