Exam 10: Introduction to Statistics
Exam 1: Algebra and Equations409 Questions
Exam 2: Graphs, Lines, and Inequalities255 Questions
Exam 3: Functions and Graphs323 Questions
Exam 4: Exponential and Logarithmic Functions192 Questions
Exam 5: Mathematics of Finance183 Questions
Exam 6: Systems of Linear Equations and Matrices215 Questions
Exam 7: Linear Programming203 Questions
Exam 8: Sets and Probability240 Questions
Exam 9: Counting, Probability Distributions, and Further Topics in Probability210 Questions
Exam 10: Introduction to Statistics169 Questions
Exam 11: Differential Calculus342 Questions
Exam 12: Applications of the Derivative220 Questions
Exam 13: Integral Calculus227 Questions
Exam 14: Multivariate Calculus152 Questions
Select questions type
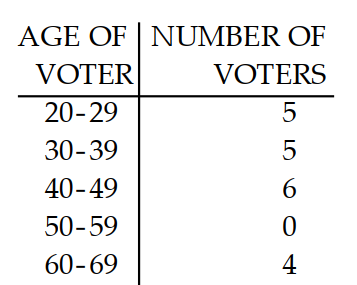
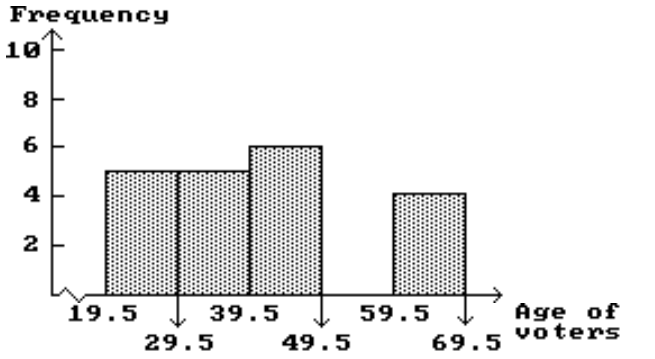
Construct the specified histogram.
-In a survey, 20 voters were asked their age. The results are summarized in the frequency table below. Construct a histogram corresponding to the frequency table.
Free
(Essay)
4.7/5  (38)
(38)
Correct Answer: Verified
Construct a frequency polygon.
-
Free
(Multiple Choice)
4.9/5 (33)
Correct Answer:Verified
A
Find the area under the normal curve.
-Find the percent of the area under a normal curve between the mean and 0.83 deviations from the mean.
Free
(Multiple Choice)
4.7/5 (41)
Correct Answer:Verified
A
Solve the problem.
-Find the percent of the area under the standard normal curve between and .
(Multiple Choice)
4.8/5 (32)
Solve the problem.
-The stem and leaf plot depicts the average weight (in pounds) of all four year olds receiving their annual influenza vaccine from the local health clinic.
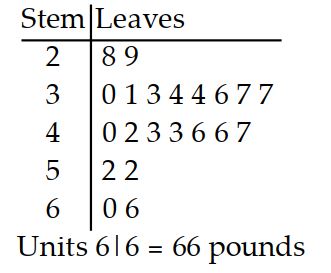 Describe the shape of the distribution.
(Multiple Choice)
4.9/5 (35)
Calculate the weighted average.
-Rafi enrolled in a class where attendance counted as of the final grade, quizzes counted as , one midterm exam counted as , and the final exam counted as . Rafi earned on attendance, on the quizzes, and on the midterm exam. If is needed to earn a grade of , what is the minimum score Rafi needs to earn on the final exam in order to earn a final grade of ? Round to the nearest hundredth.
(Multiple Choice)
4.8/5 (31)
Calculate the weighted average.
-Annie enrolled in a class where the homework counts as of the final grade, two midterm exams count as each, and a final exam counts as of the final grade. Annie earned on the homework, and on the two midterm exams, and on the final exam. What is Annie's final average? If necessary, round to the nearest hundredth.
(Multiple Choice)
4.8/5 (35)
Find a score satisfying the given condition.
- of the total area is to the left of .
(Multiple Choice)
5.0/5 (29)
In a certain distribution, the mean is 50 with a standard deviation of 6 . Use Chebyshev's theorem to tell the probabilitythat a number lies in the following interval. Round your results to the nearest whole percent.
-Less than 20 or more than 80
(Multiple Choice)
4.7/5 (29)
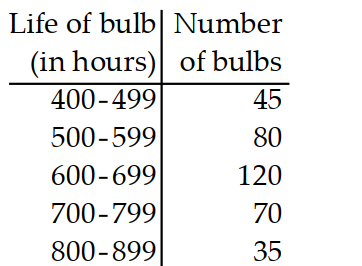
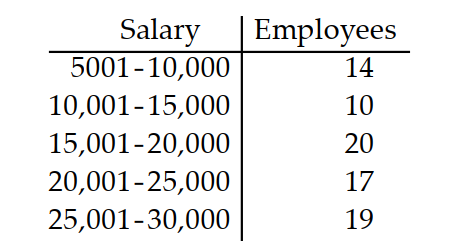
Find the standard deviation of the data summarized in the given frequency table.
-A company had 80 employees whose salaries are summarized in the frequency table below. Find the standard deviation.
(Multiple Choice)
4.9/5 (35)
Find the area under the normal curve.
-Find the percent of the area under a normal curve between the mean and 1.64 deviations from the mean.
(Multiple Choice)
4.8/5 (37)
At one high school, students can run the 100-yard dash in an average of 15.2 seconds with a standard deviation of .9 seconds. The times are very closely approximated by a normal curve. Find the percent of times that are indicated. Round to the nearest whole percent.
-Less than 17 seconds
(Multiple Choice)
4.8/5 (37)
Construct a boxplot.
-The ages of the 21 members of a track and field team are listed below. Construct a boxplot for the data.
15 18 18 19 22 23 24
24 24 24 25 26 26 27
28 28 30 32 33 40 42
(Multiple Choice)
4.9/5 (34)
Construct a-stem and leaf display for the given data table.
- 56 72 40 42 62
37 31 42 63 81
38 36 48 67 83
44 73 58 56 51
(Essay)
4.9/5 (34)
Construct a boxplot.
-The normal monthly precipitation (in inches) for August is listed for 20 different U.S. cities. Construct a boxplot for the data set.
0.4 1.0 1.5 1.6 2.0
2.2 2.4 2.7 3.4 3.4
3.5 3.6 3.6 3.7 3.7
3.9 4.1 4.2 4.2 7.0
(Multiple Choice)
4.8/5 (41)
Assume the distribution is normal. Use the area of the normal curve to answer the question. Round to the nearest whole percent.
-A certain grade egg must weigh at least . If the average weight of an egg is , with a standard deviation of , how many eggs in a sample of 9 dozen would you expect to be over the 2.5 oz size?
(Multiple Choice)
4.7/5 (30)
Assume the distribution is normal. Use the area of the normal curve to answer the question. Round to the nearest whole percent.
-The average size of the fish in a lake is 11.4 inches, with a standard deviation of 3.2 inches. Find the probability of catching a fish longer than 17 inches.
(Multiple Choice)
4.8/5 (33)
Find a score satisfying the given condition.
- of the total area is to the right of .
(Multiple Choice)
4.9/5 (39)
Obtain the five number summary for the given data.
-The weights (in pounds) of 18 randomly selected adults are given below.
120 144 187 154 119 136
127 143 179 164 182 202
114 173 133 152 169 173
(Multiple Choice)
4.8/5 (34)
Filters
- Essay(0)
- Multiple Choice(0)
- Short Answer(0)
- True False(0)
- Matching(0)