Deck 8: Drawing Inferences From Large Samples
Full screen (f)
Question
Question
Question
Question
Question
Consider the problem of estimating , the mean time per day spent in the gym for freshmen students. Obtain the point estimate of and the estimated standard error.

A)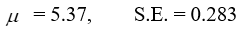
B)
C)
D)
A)
B)
C)
D)
Question
Consider the following data set.
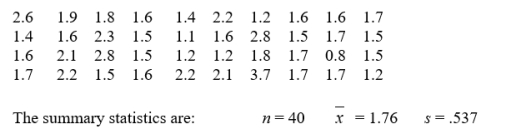 Find the standard error.
Find the standard error. Question
The following summary of a data set refers to the girth of grizzly bears in centimenters.
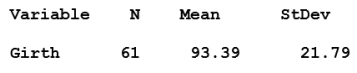 Find the 94% error margin. Round your answer to two decimal places.
Find the 94% error margin. Round your answer to two decimal places. Question
Determine the sample size n that is required for estimating the population mean. The population standard deviation and the desired error margin are specified.
 90% error margin 4
A) 3314
B) 3315
C) 58
D) 47
90% error margin 4A) 3314
B) 3315
C) 58
D) 47
Question
Question
Question
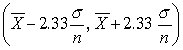
Assuming the population is normal and is known, a 98% confidence interval for is given by
Question
Question
Question
Question
Question
Question
Question
Question
Question
If the goal of the study is to establish that the mean amount of gasoline consumed by a S.U.V. in 100 miles of highway is over 8.5 gallons, the null and alternative hypotheses are:

Question
Question
Question
Given the standard deviation σ, the statement of your claim about μ, the sample size, and the desired level of significance α.
 Formulate:
a) the hypotheses,
b) the test statistic Z,
c) the rejection region.
Formulate:a) the hypotheses,
b) the test statistic Z,
c) the rejection region.
Question
Given the standard deviation σ, the statement of your claim about μ , the sample size, and the desired level of significance α.
Formulate:
a) the hypotheses,
b) the test statistic Z,
c) the rejection region.
Formulate:
a) the hypotheses,
b) the test statistic Z,
c) the rejection region.
Question
Given the standard deviation σ, the statement of your claim about μ, the sample size, and the desired level of significance α.

Formulate:
a) the hypotheses,
b) the test statistic Z,
c) the rejection region.
Formulate:
a) the hypotheses,
b) the test statistic Z,
c) the rejection region.
Question
An industrial researcher wants to perform a test with the intent of establishing that this company's compact fluorescent lamp has a mean life greater than 6300 hours. The sample size is 106 and he knows that =53 hours.
If he set the rejection region to be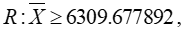 what is the level of significance of his test?
If he set the rejection region to be
what is the level of significance of his test? Question
An industrial researcher wants to perform a test with the intent of establishing that this company's compact fluorescent lamp has a mean life greater than 7100 hours. The sample size is 128 and he knows that =79 hours.
Find the numerical value of c so that the test has a 5% level of significance.
A) 7106.98
B) 7107.13
C) 7111.49
D) 7088.51
Find the numerical value of c so that the test
has a 5% level of significance.A) 7106.98
B) 7107.13
C) 7111.49
D) 7088.51
Question
Question
Question
Question
Question
Question
Question
Question
Question
Question
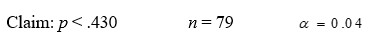
Given your claim about a population proportion, the sample size n, and the desired level of significance α.
 Formulate:
A) the hypotheses,
B) the test statistic Z,
C) the rejection region.
Formulate: A) the hypotheses,
B) the test statistic Z,
C) the rejection region.
Question
Given your claim about a population proportion, the sample size n, and the desired level of significance α.
 Formulate:
A) the hypotheses,
B) the test statistic Z,
C) the rejection region
Formulate: A) the hypotheses,
B) the test statistic Z,
C) the rejection region
Question
Given your claim about a population proportion, the sample size n, and the desired level of significance α.
 Formulate:
A) the hypotheses,
B) the test statistic Z,
C) the rejection region
Formulate: A) the hypotheses,
B) the test statistic Z,
C) the rejection region
Question
Question
Question
Question
Question
Question
Question
Question
Question

Unlock Deck
Sign up to unlock the cards in this deck!
Unlock Deck
Unlock Deck
1/48
Play
Full screen (f)
Deck 8: Drawing Inferences From Large Samples
1
A parameter is a numerical feature of a probability distribution.
True
2
When using to estimate μ , find the standard error for n = 160, σ =51 . Round your answer to three decimal places.
4.032
3
When using to estimate μ find the 100 (1-α)% error margin for
n = 146 σ =63 98% error margin.
Round your answer to three decimal places.
n = 146 σ =63 98% error margin.
Round your answer to three decimal places.
12.148
4
For the following data estimate.
A) The point estimate of μ.
B) The 100(1-α)% error margin.
n = 68 X̄=138 s=6 1-α= 0.86
A) The point estimate of μ.
B) The 100(1-α)% error margin.
n = 68 X̄=138 s=6 1-α= 0.86
Unlock Deck
Unlock for access to all 48 flashcards in this deck.
Unlock Deck
k this deck
5
Consider the problem of estimating , the mean time per day spent in the gym for freshmen students. Obtain the point estimate of and the estimated standard error.
A)
B)
C)
D)
A)
B)
C)
D)
Unlock Deck
Unlock for access to all 48 flashcards in this deck.
Unlock Deck
k this deck
6
Consider the following data set.
Find the standard error.
Find the standard error. Unlock Deck
Unlock for access to all 48 flashcards in this deck.
Unlock Deck
k this deck
7
The following summary of a data set refers to the girth of grizzly bears in centimenters.
Find the 94% error margin. Round your answer to two decimal places.
Find the 94% error margin. Round your answer to two decimal places. Unlock Deck
Unlock for access to all 48 flashcards in this deck.
Unlock Deck
k this deck
8
Determine the sample size n that is required for estimating the population mean. The population standard deviation and the desired error margin are specified.
90% error margin 4
A) 3314
B) 3315
C) 58
D) 47
90% error margin 4A) 3314
B) 3315
C) 58
D) 47
Unlock Deck
Unlock for access to all 48 flashcards in this deck.
Unlock Deck
k this deck
9
When estimating the mean of a population, how large a sample is required in order that 96% error margin be of the population standard deviation?
Unlock Deck
Unlock for access to all 48 flashcards in this deck.
Unlock Deck
k this deck
10
When estimating the mean of a population, how large a sample is required in order that the 94% error margin be 14% of the population standard deviation?
Unlock Deck
Unlock for access to all 48 flashcards in this deck.
Unlock Deck
k this deck
11
Assuming the population is normal and is known, a 98% confidence interval for is given by
Unlock Deck
Unlock for access to all 48 flashcards in this deck.
Unlock Deck
k this deck
12
Assume n = 38, = 23.367, and s = 11.056. Obtain a 98% confidence interval for μ, the population mean.
Unlock Deck
Unlock for access to all 48 flashcards in this deck.
Unlock Deck
k this deck
13
The research department of a biochemical industry took a sample of 60 bacteria cultures of the same kind and observed that the mean weight was 25.267 grams with standard deviation of 8.816 grams. Obtain a 99% confidence interval for the mean weight of the bacteria cultures.
Unlock Deck
Unlock for access to all 48 flashcards in this deck.
Unlock Deck
k this deck
14
Each day, the featured fixed price menu is rated by 35 persons and a 99 \% confidence
Interval obtained for the population mean rating $\mu$. Over a period of one year, 300 confidence intervals are calculated. Of these 300 confidence intervals, approximately how many will cover their respective population means?
Interval obtained for the population mean rating $\mu$. Over a period of one year, 300 confidence intervals are calculated. Of these 300 confidence intervals, approximately how many will cover their respective population means?
Unlock Deck
Unlock for access to all 48 flashcards in this deck.
Unlock Deck
k this deck
15
An employee of the College Board analyzes the mathematics section of the SAT for 99 students and finds = 31.3 and s = 12.8. She reports that a 99% confidence interval for the mean number of correct answers is (27.981, 34.619). Does the interval (27.981, 34.619) cover the true mean?
Which of the following alternatives is the best answer for the above question?
A) Yes, (27.981, 34.619) covers the true mean
B) No, (27.981, 34.619) does not cover the true mean
C) We will never know whether (27.981, 34.619) covers the true mean.
Which of the following alternatives is the best answer for the above question?
A) Yes, (27.981, 34.619) covers the true mean
B) No, (27.981, 34.619) does not cover the true mean
C) We will never know whether (27.981, 34.619) covers the true mean.
Unlock Deck
Unlock for access to all 48 flashcards in this deck.
Unlock Deck
k this deck
16
In a study on the annual salary of recently graduated engineers, a random sample of 50 professional was taken. The sample mean and standard deviation were found to be $79,100 and $9200 respectively. Use these data to construct a 95% confidence interval for the mean annual salary of recently graduated engineers. Round your answer to the nearest integer.
Unlock Deck
Unlock for access to all 48 flashcards in this deck.
Unlock Deck
k this deck
17
In a study about poverty level by county, the number of residents living below the poverty level was measured for a random sample of 40 counties with less than 500 residents living below the poverty level. The sample mean and standard deviation were found to be 307 and 145 residents, respectively. Use these data to construct a 98% confidence interval for the mean of the number of residents by county living below the poverty level. Round your answer to the nearest integer.
Unlock Deck
Unlock for access to all 48 flashcards in this deck.
Unlock Deck
k this deck
18
Based on a survey of 120 persons employed by the state of Kansas, the mean and standard deviation of their ages are found to be 37 and 9 years, respectively. Determine a 90% confidence interval for the mean age of the state of Kansas employees. Round your answer to the nearest integer.
Unlock Deck
Unlock for access to all 48 flashcards in this deck.
Unlock Deck
k this deck
19
A Type II error consist of the ______ of H0 when H1 is true.
Unlock Deck
Unlock for access to all 48 flashcards in this deck.
Unlock Deck
k this deck
20
If the goal of the study is to establish that the mean amount of gasoline consumed by a S.U.V. in 100 miles of highway is over 8.5 gallons, the null and alternative hypotheses are:
Unlock Deck
Unlock for access to all 48 flashcards in this deck.
Unlock Deck
k this deck
21
Consider the following statement,
The mean amount of money spent in leisure activities for a 4-number family in the east coast is less than $200 per month.
Suppose that the decision has been to reject the null hypothesis.
A)When is it a wrong decision?
B) What type of error is then made?
The mean amount of money spent in leisure activities for a 4-number family in the east coast is less than $200 per month.
The mean amount of money spent in leisure activities for a 4-number family in the east coast is less than $200 per month.
Suppose that the decision has been to reject the null hypothesis.
A)When is it a wrong decision?
B) What type of error is then made?
The mean amount of money spent in leisure activities for a 4-number family in the east coast is less than $200 per month.
Unlock Deck
Unlock for access to all 48 flashcards in this deck.
Unlock Deck
k this deck
22
Consider the following statement,
The mean time of pregnancy is 287 days.
Suppose that the decision has been made to retain the null hypothesis
A) When is it a wrong decision?
B) What type of error is then made?
The mean time of pregnancy is 287 days.
Suppose that the decision has been made to retain the null hypothesis
A) When is it a wrong decision?
B) What type of error is then made?
Unlock Deck
Unlock for access to all 48 flashcards in this deck.
Unlock Deck
k this deck
23
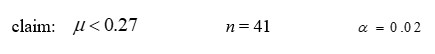
Given the standard deviation σ, the statement of your claim about μ, the sample size, and the desired level of significance α.
Formulate:
a) the hypotheses,
b) the test statistic Z,
c) the rejection region.
Formulate:a) the hypotheses,
b) the test statistic Z,
c) the rejection region.
Unlock Deck
Unlock for access to all 48 flashcards in this deck.
Unlock Deck
k this deck
24
Given the standard deviation σ, the statement of your claim about μ , the sample size, and the desired level of significance α.
Formulate:
a) the hypotheses,
b) the test statistic Z,
c) the rejection region.
Formulate:
a) the hypotheses,
b) the test statistic Z,
c) the rejection region.
Unlock Deck
Unlock for access to all 48 flashcards in this deck.
Unlock Deck
k this deck
25
Given the standard deviation σ, the statement of your claim about μ, the sample size, and the desired level of significance α.
Formulate:
a) the hypotheses,
b) the test statistic Z,
c) the rejection region.
Formulate:
a) the hypotheses,
b) the test statistic Z,
c) the rejection region.
Unlock Deck
Unlock for access to all 48 flashcards in this deck.
Unlock Deck
k this deck
26
An industrial researcher wants to perform a test with the intent of establishing that this company's compact fluorescent lamp has a mean life greater than 6300 hours. The sample size is 106 and he knows that =53 hours.
If he set the rejection region to be what is the level of significance of his test?
If he set the rejection region to be
what is the level of significance of his test? Unlock Deck
Unlock for access to all 48 flashcards in this deck.
Unlock Deck
k this deck
27
An industrial researcher wants to perform a test with the intent of establishing that this company's compact fluorescent lamp has a mean life greater than 7100 hours. The sample size is 128 and he knows that =79 hours.
Find the numerical value of c so that the test has a 5% level of significance.
A) 7106.98
B) 7107.13
C) 7111.49
D) 7088.51
Find the numerical value of c so that the test
has a 5% level of significance.A) 7106.98
B) 7107.13
C) 7111.49
D) 7088.51
Unlock Deck
Unlock for access to all 48 flashcards in this deck.
Unlock Deck
k this deck
28
The baggage manager of an airport wants to improve the time that passengers wait in the baggage claim area. She has a sample of 129 domestic flights. The mean waiting time is = 12 minutes and s = 3.6 minutes. Is the claim that μ>13.5 minutes substantiated by these data? Test with α = 0.01.
Unlock Deck
Unlock for access to all 48 flashcards in this deck.
Unlock Deck
k this deck
29
Suppose = 4.55 and s = 5.17 for N = 40. We claim that H0 = 2.3 and H1 ≠ 2.3
. Find the P- value. Round your answer to four decimal places.
. Find the P- value. Round your answer to four decimal places.
Unlock Deck
Unlock for access to all 48 flashcards in this deck.
Unlock Deck
k this deck
30
A survey is conducted of n = 957 adults (65 years or older) and x = 258 reported high blood pressure problems.
A) Provide a point estimate of p. Round your answer to three decimal places.
B) Determine the 96% error margin. Round your answer to four decimal places.
A) Provide a point estimate of p. Round your answer to three decimal places.
B) Determine the 96% error margin. Round your answer to four decimal places.
Unlock Deck
Unlock for access to all 48 flashcards in this deck.
Unlock Deck
k this deck
31
Employees of a movie theater ask their customers whether they like the movie exhibited or not. Out of 492 customers surveyed, 341 liked the movie. Compute a 88% confidence interval for the population proportion of satisfied customers.
Unlock Deck
Unlock for access to all 48 flashcards in this deck.
Unlock Deck
k this deck
32
A staff member of the office of institutional research in a large university wants to estimate the proportion of students that fail the Calculus I course. A faculty member mentioned to her that 35% of the students fail the course. How many academic reports should the staff member analyze to be 90% confident that the error estimation is within 0.03?
Unlock Deck
Unlock for access to all 48 flashcards in this deck.
Unlock Deck
k this deck
33
A travel agency wants to estimate the proportion of cancellations per year they receive. How large a sample of records must be examined to be 86% sure that the estimate does not differ from the true proportion by more than 0.02? The travel agent knows that the proportion is about 29%
Unlock Deck
Unlock for access to all 48 flashcards in this deck.
Unlock Deck
k this deck
34
Out of a sample of 596 gasoline purchases at a self-service gas station, 436 were made with a credit or debit card.
Estimate the proportion of sales made with a credit or debit card.
A) .732
B) .738
C) .744
D) .750
Estimate the proportion of sales made with a credit or debit card.
A) .732
B) .738
C) .744
D) .750
Unlock Deck
Unlock for access to all 48 flashcards in this deck.
Unlock Deck
k this deck
35
Out of a sample of 500 students, 401 owned a smart phone that was less than 3 years old. Obtain the estimated standard error. Round your answer to three decimal places.
Unlock Deck
Unlock for access to all 48 flashcards in this deck.
Unlock Deck
k this deck
36
Out of a sample of 645 students, 429 had binge watched a TV series last month.
Find a 95% confidence interval for the population proportion of purchases paid with credit or debit card.
Find a 95% confidence interval for the population proportion of purchases paid with credit or debit card.
Unlock Deck
Unlock for access to all 48 flashcards in this deck.
Unlock Deck
k this deck
37
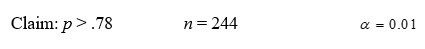
Given your claim about a population proportion, the sample size n, and the desired level of significance α.
Formulate:
A) the hypotheses,
B) the test statistic Z,
C) the rejection region.
Formulate: A) the hypotheses,
B) the test statistic Z,
C) the rejection region.
Unlock Deck
Unlock for access to all 48 flashcards in this deck.
Unlock Deck
k this deck
38
Given your claim about a population proportion, the sample size n, and the desired level of significance α.
Formulate:
A) the hypotheses,
B) the test statistic Z,
C) the rejection region
Formulate: A) the hypotheses,
B) the test statistic Z,
C) the rejection region
Unlock Deck
Unlock for access to all 48 flashcards in this deck.
Unlock Deck
k this deck
39
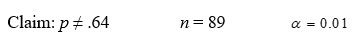
Given your claim about a population proportion, the sample size n, and the desired level of significance α.
Formulate:
A) the hypotheses,
B) the test statistic Z,
C) the rejection region
Formulate: A) the hypotheses,
B) the test statistic Z,
C) the rejection region
Unlock Deck
Unlock for access to all 48 flashcards in this deck.
Unlock Deck
k this deck
40
A random sample of 781 applicants for drivers license was taken, 270 of the applicants failed the driving test. Find a 90% confidence interval for the corresponding population proportion.
Unlock Deck
Unlock for access to all 48 flashcards in this deck.
Unlock Deck
k this deck
41
The number of times an undergraduate binge watched a TV se- ries in the past month was recorded for a sample of size 49. The summary statistics are
n = 49 = 2.1 s = 1.61
Let µ =population mean number of times.
(a) Conduct a test of hypotheses with the intent of showing that
µ > 1.5. Take α = .05.
(b) Calculate the P-value. Does this strengthen your conclusion to the test of hypotheses? Explain.
(c) Based on the conclusion to your test in Part a, what error could you have made.
Unlock Deck
Unlock for access to all 48 flashcards in this deck.
Unlock Deck
k this deck
42
Thirty-six measurements are made on the amount of meat in a pizza product. The summary statistics are
n = 36 = 17.4 grams s = 1.8 grams
Let µ =population mean amount of meat.
(a) Conduct a test of hypotheses with the intent of showing that
µ /= 17. Take α = .05.
(b) Explain your choice of sampling distribution.
(c) Sketch the null distribution of your statistic and the rejection region.
(d) Based on the conclusion to your test in Part a, what error could you have made?
Unlock Deck
Unlock for access to all 48 flashcards in this deck.
Unlock Deck
k this deck
43
The number of times an undergraduate binge watched a TV se- ries in the past month was recorded for a sample of size 49. The summary statistics are
n = 49 = 2.1 s = 1.61
Let µ =population mean number of times.
(a) Give a point estimate of µ and its estimated standard error.
(b) Obtain a 95 % confidence interval for the population mean µ.
(c) Does your interval cover µ? Explain
n = 49 = 2.1 s = 1.61
Let µ =population mean number of times.
(a) Give a point estimate of µ and its estimated standard error.
(b) Obtain a 95 % confidence interval for the population mean µ.
(c) Does your interval cover µ? Explain
Unlock Deck
Unlock for access to all 48 flashcards in this deck.
Unlock Deck
k this deck
44
Thirty-six measurements are made on the amount of meat in a pizza product. The summary statistics are
n = 36 = 17.4 grams s = 1.8 grams
Let µ =population mean amount of meat.
(a) Obtain a 98 % confidence interval for µ.
(b) Does your 98 % confidence interval cover µ. Explain.
(c) When a large number of these 98 % intervals are calculated, from data collected on different occasions, explain the reason you are 98% confident that any one of them covers µ. confi- dence that
Unlock Deck
Unlock for access to all 48 flashcards in this deck.
Unlock Deck
k this deck
45
5 An inspection of eight wind turbines revealed that 13 operate too loudly according to new sound restrictions. The summary statistics are
n = 80 x = 13
Let p =population proportion that are too loud.
(a) Conduct a test of hypotheses with the intent of showing that
p > .1. Take α = .05.
(b) Calculate the P-value. Does this strengthen your conclusion to the test of hypotheses? Explain.
(c) Based on the conclusion to your test in Part a, what error could you have made.
(d) Explain why, prior to sampling, that this possible error seldom occur.
Unlock Deck
Unlock for access to all 48 flashcards in this deck.
Unlock Deck
k this deck
46
A cell phone provider surveyed four hundred customers about sat- isfaction with their student service plan. The number that replied unsatisfactory, X, was recorded. The summary statistics are n =
400 x = 24. Let p =population proportion.
(a) Conduct a test of hypotheses with intent of showing that p /=
17. Take = .05.
(b) Explain your choice of sampling distribution.
(c) Sketch the null distribution of your statistic and the rejection region.
(d) Based on the conclusion to your test in Part a, what error could you have made?
Unlock Deck
Unlock for access to all 48 flashcards in this deck.
Unlock Deck
k this deck
47
An inspection of eight wind turbines revealed that 13 operate too loudly according to new sound restrictions. The summary statistics are
n = 80 x = 13
Let p = population proportion that are too loud.
(a) Give a point estimate of p and its estimated standard error
(b) Obtain a 95 % confidence interval for the population mean p.
(c) Does your interval cover p? Explain.
n = 80 x = 13
Let p = population proportion that are too loud.
(a) Give a point estimate of p and its estimated standard error
(b) Obtain a 95 % confidence interval for the population mean p.
(c) Does your interval cover p? Explain.
Unlock Deck
Unlock for access to all 48 flashcards in this deck.
Unlock Deck
k this deck
48
A cell phone provider surveyed four hundred customers about sat- isfaction with their student service plan. The number that replied unsatisfactory, X, was recorded. The summary statistics are n = 400 x = 24. Let p =population proportion.
(a) Obtain a 99 % confidence interval for p.
(b) Does your 99 % confidence interval cover p. Explain.
(c) When a large number of these 99 % intervals are calculated from different samples, explain the reason you are 99% confi- dent that any particular one of them covers p.
(a) Obtain a 99 % confidence interval for p.
(b) Does your 99 % confidence interval cover p. Explain.
(c) When a large number of these 99 % intervals are calculated from different samples, explain the reason you are 99% confi- dent that any particular one of them covers p.
Unlock Deck
Unlock for access to all 48 flashcards in this deck.
Unlock Deck
k this deck
Unlock Deck
Unlock for access to all 48 flashcards in this deck.


