Deck 4: Efficiency in Resource Allocation: How Much Do We Have How Much Do We Want
Full screen (f)
Question
Question
Question
Question
Question
Question
Question
Question
Question
Question
Question
Question
Question
Question
Question
Question
Question
Question
Question
Question
Question
Use the following diagram to answer the following questions.
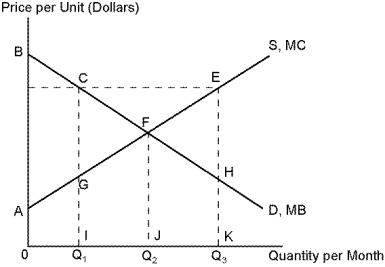
Refer to Diagram 4-1. The efficient level of compact discs is given by quantity:
A) Q₁.
B) Q₂.
C) Q3.
D) Q₁ - Q3.
Refer to Diagram 4-1. The efficient level of compact discs is given by quantity:
A) Q₁.
B) Q₂.
C) Q3.
D) Q₁ - Q3.
Question
Question
Use the following diagram to answer the following questions.
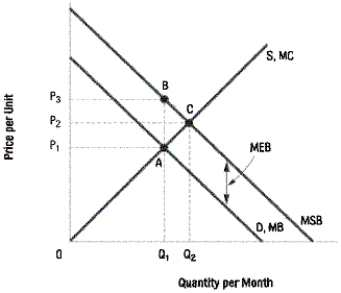
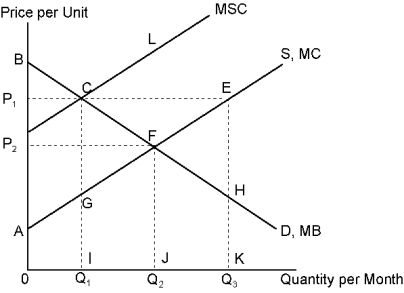
Refer to Diagram 4-2. In the above diagram, counting the external benefits increases total costs by area:
A) Q₁BCQ₂
B) Q₁ACQ₂
C) ABC
D) P₁AQ₁
Refer to Diagram 4-2. In the above diagram, counting the external benefits increases total costs by area:
A) Q₁BCQ₂
B) Q₁ACQ₂
C) ABC
D) P₁AQ₁
Question
Use the following diagram to answer the following questions.
Refer to Diagram 4-1. If a monopolist produces at Q₁, the quantity and price that maximizes its profits, the loss in total net benefits can be calculated as the value of the area;
A) GCF.
B) OAFJ.
C) FEH.
D) ABF.
Refer to Diagram 4-1. If a monopolist produces at Q₁, the quantity and price that maximizes its profits, the loss in total net benefits can be calculated as the value of the area;
A) GCF.
B) OAFJ.
C) FEH.
D) ABF.
Question
Use the following diagram to answer the following questions.
Refer to Diagram 4-2. In the above diagram the competitive level of output is:
A) Q₁
B) Q₂
C) P3
D) C
Refer to Diagram 4-2. In the above diagram the competitive level of output is:
A) Q₁
B) Q₂
C) P3
D) C
Question
Question
Question
Use the following diagram to answer the following questions.
Refer to Diagram 4-1. If production of compact discs is currently represented by quantity Q₁. The total cost of this production is given by area:
A) 0AFJ.
B) 0BFJ.
C) 0AGI.
D) 0BCI.
Refer to Diagram 4-1. If production of compact discs is currently represented by quantity Q₁. The total cost of this production is given by area:
A) 0AFJ.
B) 0BFJ.
C) 0AGI.
D) 0BCI.
Question
Use the following information to answer the following questions.

Refer to Bicycles. The marginal benefit of the fourth bicycle is:
A) $375.
B) $325.
C) $50.
D) $25.
Refer to Bicycles. The marginal benefit of the fourth bicycle is:
A) $375.
B) $325.
C) $50.
D) $25.
Question
Use the following diagram to answer the following questions.
Refer to Diagram 4-1. If individuals are currently consuming Q₂ units of compact discs. The total benefit of this consumption is given by area:
A) 0BFJ.
B) ABF.
C) 0AFJ.
D) 0BCI.
Refer to Diagram 4-1. If individuals are currently consuming Q₂ units of compact discs. The total benefit of this consumption is given by area:
A) 0BFJ.
B) ABF.
C) 0AFJ.
D) 0BCI.
Question
Question
Question
Question
Use the following diagram to answer the following questions.
Refer to Diagram 4-1. Total net benefits at the efficient level of production is given by area:
A) GCF.
B) OAFJ.
C) FEH.
D) ABF.
Refer to Diagram 4-1. Total net benefits at the efficient level of production is given by area:
A) GCF.
B) OAFJ.
C) FEH.
D) ABF.
Question
Question
Question
Question
Use the following diagram to answer the following questions.
Refer to Diagram 4-1. If production of compact discs is currently represented by quantity Q₂. The total cost of this production is given by area:
A) 0BFJ.
B) ABF.
C) 0AFJ.
D) 0BCI.
Refer to Diagram 4-1. If production of compact discs is currently represented by quantity Q₂. The total cost of this production is given by area:
A) 0BFJ.
B) ABF.
C) 0AFJ.
D) 0BCI.
Question
Use the following information to answer the following questions.
Refer to Bicycles. The total benefit of 3 bicycles is:
A) $375.
B) $350.
C) $300.
D) $225.
Refer to Bicycles. The total benefit of 3 bicycles is:
A) $375.
B) $350.
C) $300.
D) $225.
Question
Use the following diagram to answer the following questions.
Refer to Diagram 4-2. In the above diagram, the efficient price and quantity will be
A) Q₁ and P₁
B) Q₁ and P₂
C) Q₂ and P3
D) Q₂ and P₂
Refer to Diagram 4-2. In the above diagram, the efficient price and quantity will be
A) Q₁ and P₁
B) Q₁ and P₂
C) Q₂ and P3
D) Q₂ and P₂
Question
Question
Use the following diagram to answer the following questions.
Use the following diagram. The total net efficiency loss from government rent controls is given by area: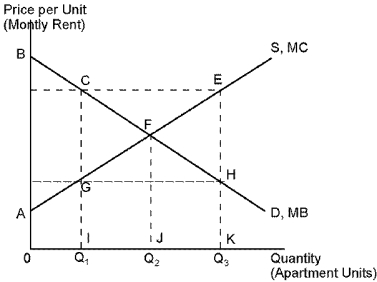
A) CFG.
B) ABF.
C) FEH.
D) CFE.
Use the following diagram. The total net efficiency loss from government rent controls is given by area:
A) CFG.
B) ABF.
C) FEH.
D) CFE.
Question
Use the following diagram to answer the following questions.
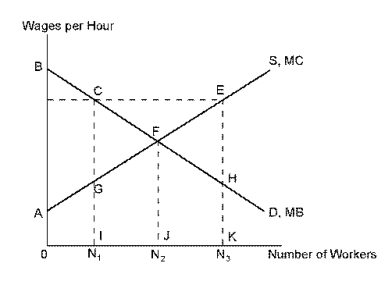
Refer to Wages. The total net efficiency loss from government imposing a minimum wage is given by area:
A) CFG.
B) ABF.
C) FEH.
D) CFE.
Refer to Wages. The total net efficiency loss from government imposing a minimum wage is given by area:
A) CFG.
B) ABF.
C) FEH.
D) CFE.
Question
Use the following diagram to answer the following questions.
Refer to Wages. Employment loss from government imposing a minimum wage is given by:
A) N1.
B) N2.
C) N3-N1.
D) N2-N1.
Refer to Wages. Employment loss from government imposing a minimum wage is given by:
A) N1.
B) N2.
C) N3-N1.
D) N2-N1.
Question
Use the following diagram to answer the following questions.
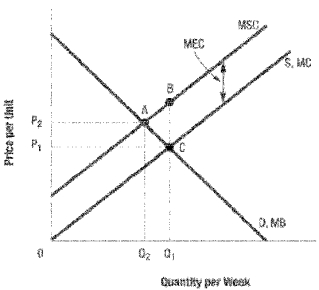
Refer to Diagram 4-3. In the above diagram, if the external costs are internalized (accounted for), the efficient price and quantity will be
A) Q₁ and P₁
B) Q₁ and P₂
C) Q₂ and P₁
D) Q₂ and P₂
Refer to Diagram 4-3. In the above diagram, if the external costs are internalized (accounted for), the efficient price and quantity will be
A) Q₁ and P₁
B) Q₁ and P₂
C) Q₂ and P₁
D) Q₂ and P₂
Question
Use the following diagram to answer the following questions.
Refer to Diagram 4-3. In the above diagram the competitive level of output is:
A) Q₁
B) Q₂
C) P3
D) C
Refer to Diagram 4-3. In the above diagram the competitive level of output is:
A) Q₁
B) Q₂
C) P3
D) C
Question
Use the following diagram to find the loss in net benefits associated with pollution.
Question
Use the following diagram to answer the following questions.
Refer to Diagram 4-3. In the above diagram the efficient level of output is:
A) Q₁
B) Q₂
C) P3
D) C
Refer to Diagram 4-3. In the above diagram the efficient level of output is:
A) Q₁
B) Q₂
C) P3
D) C
Question
Use the following diagram to answer the following questions.
Use the following diagram. The total net efficiency loss from government agricultural price supports is given by area: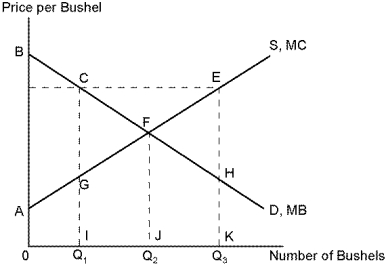
A) CFG.
B) ABF.
C) FEH.
D) CFE.
Use the following diagram. The total net efficiency loss from government agricultural price supports is given by area:
A) CFG.
B) ABF.
C) FEH.
D) CFE.

Unlock Deck
Sign up to unlock the cards in this deck!
Unlock Deck
Unlock Deck
1/49
Play
Full screen (f)
Deck 4: Efficiency in Resource Allocation: How Much Do We Have How Much Do We Want
1
If marginal social cost is greater than marginal social benefit, allocative efficiency can be improved by increasing production.
False
2
No external benefits are provided by the public goods.
False
3
Output is being produced efficiently if marginal social benefit is equal to marginal social cost.
True
4
The monopolist will set the price at the level where its profits are maximized.
Unlock Deck
Unlock for access to all 49 flashcards in this deck.
Unlock Deck
k this deck
5
Government rent controls promote efficiency and equity.
Unlock Deck
Unlock for access to all 49 flashcards in this deck.
Unlock Deck
k this deck
6
The total cost of production is measured as the:
A) the area under the supply curve.
B) the area under the demand curve.
C) the net area under the demand and supply curves.
D) the intersection of the demand and supply curves.
A) the area under the supply curve.
B) the area under the demand curve.
C) the net area under the demand and supply curves.
D) the intersection of the demand and supply curves.
Unlock Deck
Unlock for access to all 49 flashcards in this deck.
Unlock Deck
k this deck
7
The cost to producers when they produce an additional unit of a good is measured by:
A) the height of the supply curve.
B) the height of the demand curve.
C) the height of the marginal revenue curve.
D) the intersection of the demand and supply curves.
A) the height of the supply curve.
B) the height of the demand curve.
C) the height of the marginal revenue curve.
D) the intersection of the demand and supply curves.
Unlock Deck
Unlock for access to all 49 flashcards in this deck.
Unlock Deck
k this deck
8
The benefit consumers receive when they consume an additional unit of a good is measured by:
A) the height of the supply curve.
B) the height of the demand curve.
C) the height of the marginal revenue curve.
D) the intersection of the demand and supply curves.
A) the height of the supply curve.
B) the height of the demand curve.
C) the height of the marginal revenue curve.
D) the intersection of the demand and supply curves.
Unlock Deck
Unlock for access to all 49 flashcards in this deck.
Unlock Deck
k this deck
9
Pollution is an example of external costs.
Unlock Deck
Unlock for access to all 49 flashcards in this deck.
Unlock Deck
k this deck
10
Government subsidized medical care results in inefficiently high levels of demand for medical care.
Unlock Deck
Unlock for access to all 49 flashcards in this deck.
Unlock Deck
k this deck
11
The area under the demand curve represents the benefits producers receive when they sell some quantity of a product.
Unlock Deck
Unlock for access to all 49 flashcards in this deck.
Unlock Deck
k this deck
12
Allocative efficiency exists when net benefit is as large as possible.
Unlock Deck
Unlock for access to all 49 flashcards in this deck.
Unlock Deck
k this deck
13
A lighthouse is an example of a public good.
Unlock Deck
Unlock for access to all 49 flashcards in this deck.
Unlock Deck
k this deck
14
Minimum wage laws give rise to unemployment.
Unlock Deck
Unlock for access to all 49 flashcards in this deck.
Unlock Deck
k this deck
15
Marginal social cost
Unlock Deck
Unlock for access to all 49 flashcards in this deck.
Unlock Deck
k this deck
16
The supply curve represents the marginal cost of producing various quantities of a good or service.
Unlock Deck
Unlock for access to all 49 flashcards in this deck.
Unlock Deck
k this deck
17
Income taxes result in allocative inefficiency because most people would work the same number of hours per year regardless of their hourly wage.
Unlock Deck
Unlock for access to all 49 flashcards in this deck.
Unlock Deck
k this deck
18
A competitive industry usually produces the efficient level of output.
Unlock Deck
Unlock for access to all 49 flashcards in this deck.
Unlock Deck
k this deck
19
In determining the efficient amount of a good or service, it is only required that the benefits provided by a good or service be equal to or greater than the costs of providing it.
Unlock Deck
Unlock for access to all 49 flashcards in this deck.
Unlock Deck
k this deck
20
A monopoly is a market in which only one seller exists.
Unlock Deck
Unlock for access to all 49 flashcards in this deck.
Unlock Deck
k this deck
21
Use the following diagram to answer the following questions.
Refer to Diagram 4-1. The efficient level of compact discs is given by quantity:
A) Q₁.
B) Q₂.
C) Q3.
D) Q₁ - Q3.
Refer to Diagram 4-1. The efficient level of compact discs is given by quantity:
A) Q₁.
B) Q₂.
C) Q3.
D) Q₁ - Q3.
Unlock Deck
Unlock for access to all 49 flashcards in this deck.
Unlock Deck
k this deck
22
Currently 75 pairs of sandals are being exchanged in the market. The marginal social benefit of the last unit is $15 while the marginal cost of this unit is $30. We know that with regard to efficiency:
A) efficiency is occurring.
B) production should be decreased.
C) production should be expanded.
D) there should be no change in production levels.
A) efficiency is occurring.
B) production should be decreased.
C) production should be expanded.
D) there should be no change in production levels.
Unlock Deck
Unlock for access to all 49 flashcards in this deck.
Unlock Deck
k this deck
23
Use the following diagram to answer the following questions.
Refer to Diagram 4-2. In the above diagram, counting the external benefits increases total costs by area:
A) Q₁BCQ₂
B) Q₁ACQ₂
C) ABC
D) P₁AQ₁
Refer to Diagram 4-2. In the above diagram, counting the external benefits increases total costs by area:
A) Q₁BCQ₂
B) Q₁ACQ₂
C) ABC
D) P₁AQ₁
Unlock Deck
Unlock for access to all 49 flashcards in this deck.
Unlock Deck
k this deck
24
Use the following diagram to answer the following questions.
Refer to Diagram 4-1. If a monopolist produces at Q₁, the quantity and price that maximizes its profits, the loss in total net benefits can be calculated as the value of the area;
A) GCF.
B) OAFJ.
C) FEH.
D) ABF.
Refer to Diagram 4-1. If a monopolist produces at Q₁, the quantity and price that maximizes its profits, the loss in total net benefits can be calculated as the value of the area;
A) GCF.
B) OAFJ.
C) FEH.
D) ABF.
Unlock Deck
Unlock for access to all 49 flashcards in this deck.
Unlock Deck
k this deck
25
Use the following diagram to answer the following questions.
Refer to Diagram 4-2. In the above diagram the competitive level of output is:
A) Q₁
B) Q₂
C) P3
D) C
Refer to Diagram 4-2. In the above diagram the competitive level of output is:
A) Q₁
B) Q₂
C) P3
D) C
Unlock Deck
Unlock for access to all 49 flashcards in this deck.
Unlock Deck
k this deck
26
To determine the efficient amount of a good or service.
A) The benefits provided by a good or service must be equal to or less than the costs of providing it.
B) The difference between the benefits and costs must be as small as possible, or maximized.
C) The marginal benefit of a good or service must be greater than the marginal cost.
D) The benefits provided by a good or service must be equal to or greater than the costs of providing it, and the difference between the benefits and costs must be maximized.
Unlock Deck
Unlock for access to all 49 flashcards in this deck.
Unlock Deck
k this deck
27
Suppose a market is currently producing at a point where marginal social benefit exceeds marginal cost. For efficiency, production should:
A) be increased.
B) be decreased.
C) not be changed. The current level of production is generating positive net benefits for society.
D) be temporarily increased in order for firms to create more jobs and then decreased to the original level before cost increases set in.
A) be increased.
B) be decreased.
C) not be changed. The current level of production is generating positive net benefits for society.
D) be temporarily increased in order for firms to create more jobs and then decreased to the original level before cost increases set in.
Unlock Deck
Unlock for access to all 49 flashcards in this deck.
Unlock Deck
k this deck
28
Use the following diagram to answer the following questions.
Refer to Diagram 4-1. If production of compact discs is currently represented by quantity Q₁. The total cost of this production is given by area:
A) 0AFJ.
B) 0BFJ.
C) 0AGI.
D) 0BCI.
Refer to Diagram 4-1. If production of compact discs is currently represented by quantity Q₁. The total cost of this production is given by area:
A) 0AFJ.
B) 0BFJ.
C) 0AGI.
D) 0BCI.
Unlock Deck
Unlock for access to all 49 flashcards in this deck.
Unlock Deck
k this deck
29
Use the following information to answer the following questions.
Refer to Bicycles. The marginal benefit of the fourth bicycle is:
A) $375.
B) $325.
C) $50.
D) $25.
Refer to Bicycles. The marginal benefit of the fourth bicycle is:
A) $375.
B) $325.
C) $50.
D) $25.
Unlock Deck
Unlock for access to all 49 flashcards in this deck.
Unlock Deck
k this deck
30
Use the following diagram to answer the following questions.
Refer to Diagram 4-1. If individuals are currently consuming Q₂ units of compact discs. The total benefit of this consumption is given by area:
A) 0BFJ.
B) ABF.
C) 0AFJ.
D) 0BCI.
Refer to Diagram 4-1. If individuals are currently consuming Q₂ units of compact discs. The total benefit of this consumption is given by area:
A) 0BFJ.
B) ABF.
C) 0AFJ.
D) 0BCI.
Unlock Deck
Unlock for access to all 49 flashcards in this deck.
Unlock Deck
k this deck
31
Which of the following is an example of market failure?
A) Monopoly.
B) Rent controls.
C) Agricultural price support.
D) Taxes.
A) Monopoly.
B) Rent controls.
C) Agricultural price support.
D) Taxes.
Unlock Deck
Unlock for access to all 49 flashcards in this deck.
Unlock Deck
k this deck
32
Which of the following is NOT an example of market failure?
A) Monopoly.
B) Rent controls.
C) External benefits.
D) External costs.
A) Monopoly.
B) Rent controls.
C) External benefits.
D) External costs.
Unlock Deck
Unlock for access to all 49 flashcards in this deck.
Unlock Deck
k this deck
33
Which of the following is NOT an example of government failure?
A) Public goods.
B) Rent controls.
C) Agricultural price support.
D) Taxes.
A) Public goods.
B) Rent controls.
C) Agricultural price support.
D) Taxes.
Unlock Deck
Unlock for access to all 49 flashcards in this deck.
Unlock Deck
k this deck
34
Use the following diagram to answer the following questions.
Refer to Diagram 4-1. Total net benefits at the efficient level of production is given by area:
A) GCF.
B) OAFJ.
C) FEH.
D) ABF.
Refer to Diagram 4-1. Total net benefits at the efficient level of production is given by area:
A) GCF.
B) OAFJ.
C) FEH.
D) ABF.
Unlock Deck
Unlock for access to all 49 flashcards in this deck.
Unlock Deck
k this deck
35
The total benefits derived from consumption is measured as the:
A) the area under the supply curve.
B) the area under the demand curve.
C) the net area under the demand and supply curves.
D) the intersection of the demand and supply curves.
A) the area under the supply curve.
B) the area under the demand curve.
C) the net area under the demand and supply curves.
D) the intersection of the demand and supply curves.
Unlock Deck
Unlock for access to all 49 flashcards in this deck.
Unlock Deck
k this deck
36
Suppose that at current production levels, marginal social benefit is $75 while marginal cost is $80. We know that:
A) the efficient level of output is being produced.
B) the level of output should be decreased in order to improve efficiency.
C) the level of output should be increased in order to improve efficiency.
D) output should be redistributed so those with lower income will be able to consume more.
A) the efficient level of output is being produced.
B) the level of output should be decreased in order to improve efficiency.
C) the level of output should be increased in order to improve efficiency.
D) output should be redistributed so those with lower income will be able to consume more.
Unlock Deck
Unlock for access to all 49 flashcards in this deck.
Unlock Deck
k this deck
37
Which of the following is an example of government failure?
A) Monopoly.
B) Rent controls.
C) External benefits.
D) External costs.
A) Monopoly.
B) Rent controls.
C) External benefits.
D) External costs.
Unlock Deck
Unlock for access to all 49 flashcards in this deck.
Unlock Deck
k this deck
38
Use the following diagram to answer the following questions.
Refer to Diagram 4-1. If production of compact discs is currently represented by quantity Q₂. The total cost of this production is given by area:
A) 0BFJ.
B) ABF.
C) 0AFJ.
D) 0BCI.
Refer to Diagram 4-1. If production of compact discs is currently represented by quantity Q₂. The total cost of this production is given by area:
A) 0BFJ.
B) ABF.
C) 0AFJ.
D) 0BCI.
Unlock Deck
Unlock for access to all 49 flashcards in this deck.
Unlock Deck
k this deck
39
Use the following information to answer the following questions.
Refer to Bicycles. The total benefit of 3 bicycles is:
A) $375.
B) $350.
C) $300.
D) $225.
Refer to Bicycles. The total benefit of 3 bicycles is:
A) $375.
B) $350.
C) $300.
D) $225.
Unlock Deck
Unlock for access to all 49 flashcards in this deck.
Unlock Deck
k this deck
40
Use the following diagram to answer the following questions.
Refer to Diagram 4-2. In the above diagram, the efficient price and quantity will be
A) Q₁ and P₁
B) Q₁ and P₂
C) Q₂ and P3
D) Q₂ and P₂
Refer to Diagram 4-2. In the above diagram, the efficient price and quantity will be
A) Q₁ and P₁
B) Q₁ and P₂
C) Q₂ and P3
D) Q₂ and P₂
Unlock Deck
Unlock for access to all 49 flashcards in this deck.
Unlock Deck
k this deck
41
Moneymakers Incorporated currently produces 100 units of output per day. At this level of production, the marginal benefit of production is $25 while the marginal cost is $20. Moneymakers is obviously producing at the efficient level because society is getting a net benefit. Is this statement true or False? Defend your answer.
Unlock Deck
Unlock for access to all 49 flashcards in this deck.
Unlock Deck
k this deck
42
Use the following diagram to answer the following questions.
Use the following diagram. The total net efficiency loss from government rent controls is given by area:
A) CFG.
B) ABF.
C) FEH.
D) CFE.
Use the following diagram. The total net efficiency loss from government rent controls is given by area:
A) CFG.
B) ABF.
C) FEH.
D) CFE.
Unlock Deck
Unlock for access to all 49 flashcards in this deck.
Unlock Deck
k this deck
43
Use the following diagram to answer the following questions.
Refer to Wages. The total net efficiency loss from government imposing a minimum wage is given by area:
A) CFG.
B) ABF.
C) FEH.
D) CFE.
Refer to Wages. The total net efficiency loss from government imposing a minimum wage is given by area:
A) CFG.
B) ABF.
C) FEH.
D) CFE.
Unlock Deck
Unlock for access to all 49 flashcards in this deck.
Unlock Deck
k this deck
44
Use the following diagram to answer the following questions.
Refer to Wages. Employment loss from government imposing a minimum wage is given by:
A) N1.
B) N2.
C) N3-N1.
D) N2-N1.
Refer to Wages. Employment loss from government imposing a minimum wage is given by:
A) N1.
B) N2.
C) N3-N1.
D) N2-N1.
Unlock Deck
Unlock for access to all 49 flashcards in this deck.
Unlock Deck
k this deck
45
Use the following diagram to answer the following questions.
Refer to Diagram 4-3. In the above diagram, if the external costs are internalized (accounted for), the efficient price and quantity will be
A) Q₁ and P₁
B) Q₁ and P₂
C) Q₂ and P₁
D) Q₂ and P₂
Refer to Diagram 4-3. In the above diagram, if the external costs are internalized (accounted for), the efficient price and quantity will be
A) Q₁ and P₁
B) Q₁ and P₂
C) Q₂ and P₁
D) Q₂ and P₂
Unlock Deck
Unlock for access to all 49 flashcards in this deck.
Unlock Deck
k this deck
46
Use the following diagram to answer the following questions.
Refer to Diagram 4-3. In the above diagram the competitive level of output is:
A) Q₁
B) Q₂
C) P3
D) C
Refer to Diagram 4-3. In the above diagram the competitive level of output is:
A) Q₁
B) Q₂
C) P3
D) C
Unlock Deck
Unlock for access to all 49 flashcards in this deck.
Unlock Deck
k this deck
47
Use the following diagram to find the loss in net benefits associated with pollution.
Unlock Deck
Unlock for access to all 49 flashcards in this deck.
Unlock Deck
k this deck
48
Use the following diagram to answer the following questions.
Refer to Diagram 4-3. In the above diagram the efficient level of output is:
A) Q₁
B) Q₂
C) P3
D) C
Refer to Diagram 4-3. In the above diagram the efficient level of output is:
A) Q₁
B) Q₂
C) P3
D) C
Unlock Deck
Unlock for access to all 49 flashcards in this deck.
Unlock Deck
k this deck
49
Use the following diagram to answer the following questions.
Use the following diagram. The total net efficiency loss from government agricultural price supports is given by area:
A) CFG.
B) ABF.
C) FEH.
D) CFE.
Use the following diagram. The total net efficiency loss from government agricultural price supports is given by area:
A) CFG.
B) ABF.
C) FEH.
D) CFE.
Unlock Deck
Unlock for access to all 49 flashcards in this deck.
Unlock Deck
k this deck
Unlock Deck
Unlock for access to all 49 flashcards in this deck.


