Exam 4: Efficiency in Resource Allocation: How Much Do We Have How Much Do We Want
Exam 1: Economic Growth: an Introduction to Scarcity and Choice89 Questions
Exam 2: An Introduction to Economic Systems and the Workings of the Price System94 Questions
Exam 3: Competitive Markets and Government Policy: Agriculture138 Questions
Exam 4: Efficiency in Resource Allocation: How Much Do We Have How Much Do We Want49 Questions
Exam 5: Market Power: Does It Help or Hurt the Economy93 Questions
Exam 6: Air Pollution: Balancing Benefits and Costs85 Questions
Exam 7: Health Care: How Much for Whom70 Questions
Exam 8: Crime and Drugs: a Modern Dilemma104 Questions
Exam 9: College Education: Is It Worth the Cost71 Questions
Exam 10: Educational Reform: the Role of Incentives and Choice79 Questions
Exam 11: Poverty: Old and New Approaches to a Persistent Problem96 Questions
Exam 12: Tracking and Explaining the Macroeconomy116 Questions
Exam 13: Unemployment: the Legacy of Recession, Technological Change, and Free Choice101 Questions
Exam 14: Inflation: a Monetary Phenomenon103 Questions
Exam 15: Sustained Budget Deficits: Is This Any Way to Run a Government84 Questions
Exam 16: Social Security: Leading Issues and Approaches to Reform65 Questions
Exam 17: International Trade: Beneficial, but Controversial88 Questions
Exam 18: Financing Trade and the Trade Deficit77 Questions
Select questions type
Use the following diagram to answer the following questions.
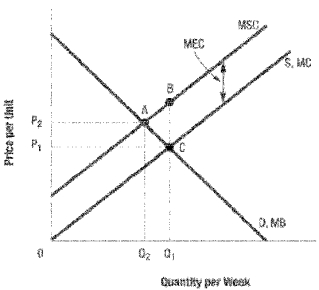 -Refer to Diagram 4-3. In the above diagram the efficient level of output is:
Free
(Multiple Choice)
4.8/5  (39)
(39)
Correct Answer: Verified
B
Use the following diagram to answer the following questions.
-Refer to Diagram 4-3. In the above diagram, if the external costs are internalized (accounted for), the efficient price and quantity will be
Free
(Multiple Choice)
4.8/5 (44)
Correct Answer:Verified
D
No external benefits are provided by the public goods.
Free
(True/False)
4.9/5 (29)
Correct Answer:Verified
False
Use the following diagram to answer the following questions.
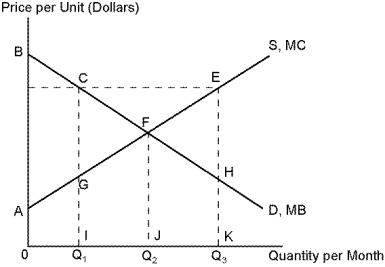 -Refer to Diagram 4-1. If production of compact discs is currently represented by quantity Q₂. The total cost of this production is given by area:
(Multiple Choice)
4.9/5 (31)
Use the following diagram to answer the following questions.
-Refer to Diagram 4-1. Total net benefits at the efficient level of production is given by area:
(Multiple Choice)
4.8/5 (33)
Use the following diagram to answer the following questions.
-Refer to Diagram 4-1. If individuals are currently consuming Q₂ units of compact discs. The total benefit of this consumption is given by area:
(Multiple Choice)
4.9/5 (30)
Use the following diagram to answer the following questions.
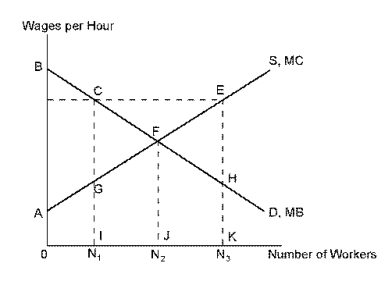 -Refer to Wages. The total net efficiency loss from government imposing a minimum wage is given by area:
(Multiple Choice)
4.8/5 (26)
Output is being produced efficiently if marginal social benefit is equal to marginal social cost.
(True/False)
5.0/5 (38)
Use the following information to answer the following questions.
 -Refer to Bicycles. The total benefit of 3 bicycles is:
(Multiple Choice)
4.8/5 (42)
Moneymakers Incorporated currently produces 100 units of output per day. At this level of production, the marginal benefit of production is $25 while the marginal cost is $20. Moneymakers is obviously producing at the efficient level because society is getting a net benefit. Is this statement true or False? Defend your answer.
(Essay)
4.8/5 (35)
Currently 75 pairs of sandals are being exchanged in the market. The marginal social benefit of the last unit is $15 while the marginal cost of this unit is $30. We know that with regard to efficiency:
(Multiple Choice)
4.8/5 (46)
Use the following diagram to answer the following questions.
-Refer to Diagram 4-1. If a monopolist produces at Q₁, the quantity and price that maximizes its profits, the loss in total net benefits can be calculated as the value of the area;
(Multiple Choice)
4.9/5 (38)
The supply curve represents the marginal cost of producing various quantities of a good or service.
(True/False)
4.8/5 (36)
Filters
- Essay(0)
- Multiple Choice(0)
- Short Answer(0)
- True False(0)
- Matching(0)