Deck 2: Trade-Offs, Comparative Advantage, and the Market System
Full screen (f)
Question
Question
Question
Question
Question
Question
Question
Figure 2.1  Alt text for Figure 2.1: In figure 2.1, a graph compares roadsters and S U Vs.
Long description for Figure 2.1: The x-axis is labelled, S U Vs, and the y-axis is labelled, roadsters.3 points A, B, and C are plotted on the graph.A concave curve is drawn between the y-axis and the x-axis, from near the top of the y-axis, to near the end of the y-axis.Near the mid-point of the curve, it passes through point B.Point A is between the curve and the origin, and point C is outside the curve, midway along the x-axis and near the top of the y-axis.
Refer to Figure 2.1.At point A the opportunity cost of producing more SUVs is
A)0 roadsters.
B)0 SUVs.
C)2)5 roadsters per SUV.
D)impossible to determine.
Alt text for Figure 2.1: In figure 2.1, a graph compares roadsters and S U Vs.Long description for Figure 2.1: The x-axis is labelled, S U Vs, and the y-axis is labelled, roadsters.3 points A, B, and C are plotted on the graph.A concave curve is drawn between the y-axis and the x-axis, from near the top of the y-axis, to near the end of the y-axis.Near the mid-point of the curve, it passes through point B.Point A is between the curve and the origin, and point C is outside the curve, midway along the x-axis and near the top of the y-axis.
Refer to Figure 2.1.At point A the opportunity cost of producing more SUVs is
A)0 roadsters.
B)0 SUVs.
C)2)5 roadsters per SUV.
D)impossible to determine.
Question
Figure 2.1 Alt text for Figure 2.1: In figure 2.1, a graph compares roadsters and S U Vs.
Long description for Figure 2.1: The x-axis is labelled, S U Vs, and the y-axis is labelled, roadsters.3 points A, B, and C are plotted on the graph.A concave curve is drawn between the y-axis and the x-axis, from near the top of the y-axis, to near the end of the y-axis.Near the mid-point of the curve, it passes through point B.Point A is between the curve and the origin, and point C is outside the curve, midway along the x-axis and near the top of the y-axis.
Refer to Figure 2.1.Point C is
A)technically efficient.
B)unattainable with current resources.
C)inefficient in that not all resources are being used.
D)is the equilibrium output combination.
Alt text for Figure 2.1: In figure 2.1, a graph compares roadsters and S U Vs.Long description for Figure 2.1: The x-axis is labelled, S U Vs, and the y-axis is labelled, roadsters.3 points A, B, and C are plotted on the graph.A concave curve is drawn between the y-axis and the x-axis, from near the top of the y-axis, to near the end of the y-axis.Near the mid-point of the curve, it passes through point B.Point A is between the curve and the origin, and point C is outside the curve, midway along the x-axis and near the top of the y-axis.
Refer to Figure 2.1.Point C is
A)technically efficient.
B)unattainable with current resources.
C)inefficient in that not all resources are being used.
D)is the equilibrium output combination.
Question
Figure 2.1 Alt text for Figure 2.1: In figure 2.1, a graph compares roadsters and S U Vs.
Long description for Figure 2.1: The x-axis is labelled, S U Vs, and the y-axis is labelled, roadsters.3 points A, B, and C are plotted on the graph.A concave curve is drawn between the y-axis and the x-axis, from near the top of the y-axis, to near the end of the y-axis.Near the mid-point of the curve, it passes through point B.Point A is between the curve and the origin, and point C is outside the curve, midway along the x-axis and near the top of the y-axis.
Refer to Figure 2.1.Point A is
A)technically efficient.
B)unattainable with current resources.
C)inefficient in that not all resources are being used.
D)the equilibrium output combination.
Alt text for Figure 2.1: In figure 2.1, a graph compares roadsters and S U Vs.Long description for Figure 2.1: The x-axis is labelled, S U Vs, and the y-axis is labelled, roadsters.3 points A, B, and C are plotted on the graph.A concave curve is drawn between the y-axis and the x-axis, from near the top of the y-axis, to near the end of the y-axis.Near the mid-point of the curve, it passes through point B.Point A is between the curve and the origin, and point C is outside the curve, midway along the x-axis and near the top of the y-axis.
Refer to Figure 2.1.Point A is
A)technically efficient.
B)unattainable with current resources.
C)inefficient in that not all resources are being used.
D)the equilibrium output combination.
Question
Figure 2.2 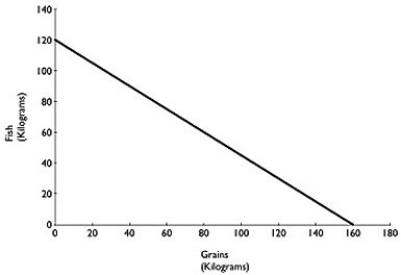 Figure 2.2 above shows the production possibilities frontier for Atikamekw Cree (ca.1600)with a historical tradition of fishing and farming.Assume they produce two goods: fish and grains.
Alt text for Figure 2.2: In figure 2.2, a graph compares production of grains and fish.
Long description for Figure 2.2: The x-axis is labelled, grains in kilograms, and the y-axis is labelled, fish in kilograms.The x-axis is marked from 0 to 180, in increments of 20.The y-axis is marked from 0 to 140, in increments of 20.A line slopes down from the point 0, 120 to the point 160, 0.
Refer to Figure 2.2.What is the opportunity cost of one kilogram of Fish?
A) kilogram of grain
B) kilograms of grain
C)1)6 kilograms of grain
D)16 kilograms of grain
Figure 2.2 above shows the production possibilities frontier for Atikamekw Cree (ca.1600)with a historical tradition of fishing and farming.Assume they produce two goods: fish and grains.Alt text for Figure 2.2: In figure 2.2, a graph compares production of grains and fish.
Long description for Figure 2.2: The x-axis is labelled, grains in kilograms, and the y-axis is labelled, fish in kilograms.The x-axis is marked from 0 to 180, in increments of 20.The y-axis is marked from 0 to 140, in increments of 20.A line slopes down from the point 0, 120 to the point 160, 0.
Refer to Figure 2.2.What is the opportunity cost of one kilogram of Fish?
A)
kilogram of grainB)
kilograms of grainC)1)6 kilograms of grain
D)16 kilograms of grain
Question
Question
Question
Figure 2.2 Figure 2.2 above shows the production possibilities frontier for Atikamekw Cree (ca.1600)with a historical tradition of fishing and farming.Assume they produce two goods: fish and grains.
Alt text for Figure 2.2: In figure 2.2, a graph compares production of grains and fish.
Long description for Figure 2.2: The x-axis is labelled, grains in kilograms, and the y-axis is labelled, fish in kilograms.The x-axis is marked from 0 to 180, in increments of 20.The y-axis is marked from 0 to 140, in increments of 20.A line slopes down from the point 0, 120 to the point 160, 0.
Refer to Figure 2.2.What is the opportunity cost of one kilogram of grain?
A) kilograms of fish
B)1)2 kilograms of fish
C) kilograms of fish
D)12 kilograms of fish
Figure 2.2 above shows the production possibilities frontier for Atikamekw Cree (ca.1600)with a historical tradition of fishing and farming.Assume they produce two goods: fish and grains.Alt text for Figure 2.2: In figure 2.2, a graph compares production of grains and fish.
Long description for Figure 2.2: The x-axis is labelled, grains in kilograms, and the y-axis is labelled, fish in kilograms.The x-axis is marked from 0 to 180, in increments of 20.The y-axis is marked from 0 to 140, in increments of 20.A line slopes down from the point 0, 120 to the point 160, 0.
Refer to Figure 2.2.What is the opportunity cost of one kilogram of grain?
A)
kilograms of fishB)1)2 kilograms of fish
C)
kilograms of fishD)12 kilograms of fish
Question
Figure 2.2 Figure 2.2 above shows the production possibilities frontier for Atikamekw Cree (ca.1600)with a historical tradition of fishing and farming.Assume they produce two goods: fish and grains.
Alt text for Figure 2.2: In figure 2.2, a graph compares production of grains and fish.
Long description for Figure 2.2: The x-axis is labelled, grains in kilograms, and the y-axis is labelled, fish in kilograms.The x-axis is marked from 0 to 180, in increments of 20.The y-axis is marked from 0 to 140, in increments of 20.A line slopes down from the point 0, 120 to the point 160, 0.
Refer to Figure 2.2.Suppose Atikamekw Cree are currently producing 60 kilograms of grain per period.How much fish is it also producing, assuming that resources are fully utilized?
A)45 kilograms of fish
B)75 kilograms of fish
C)80 kilograms of fish
D)100 kilograms of fish
Figure 2.2 above shows the production possibilities frontier for Atikamekw Cree (ca.1600)with a historical tradition of fishing and farming.Assume they produce two goods: fish and grains.Alt text for Figure 2.2: In figure 2.2, a graph compares production of grains and fish.
Long description for Figure 2.2: The x-axis is labelled, grains in kilograms, and the y-axis is labelled, fish in kilograms.The x-axis is marked from 0 to 180, in increments of 20.The y-axis is marked from 0 to 140, in increments of 20.A line slopes down from the point 0, 120 to the point 160, 0.
Refer to Figure 2.2.Suppose Atikamekw Cree are currently producing 60 kilograms of grain per period.How much fish is it also producing, assuming that resources are fully utilized?
A)45 kilograms of fish
B)75 kilograms of fish
C)80 kilograms of fish
D)100 kilograms of fish
Question
Figure 2.2 Figure 2.2 above shows the production possibilities frontier for Atikamekw Cree (ca.1600)with a historical tradition of fishing and farming.Assume they produce two goods: fish and grains.
Alt text for Figure 2.2: In figure 2.2, a graph compares production of grains and fish.
Long description for Figure 2.2: The x-axis is labelled, grains in kilograms, and the y-axis is labelled, fish in kilograms.The x-axis is marked from 0 to 180, in increments of 20.The y-axis is marked from 0 to 140, in increments of 20.A line slopes down from the point 0, 120 to the point 160, 0.
Refer to Figure 2.2.The linear production possibilities frontier in the figure indicates that
A)Atikamekw Cree have a comparative advantage in the production of vegetables.
B)Atikamekw Cree have a comparative disadvantage in the production of meat.
C)the trade-off between producing fish and grain is constant.
D)it is progressively more expensive to produce fish.
Figure 2.2 above shows the production possibilities frontier for Atikamekw Cree (ca.1600)with a historical tradition of fishing and farming.Assume they produce two goods: fish and grains.Alt text for Figure 2.2: In figure 2.2, a graph compares production of grains and fish.
Long description for Figure 2.2: The x-axis is labelled, grains in kilograms, and the y-axis is labelled, fish in kilograms.The x-axis is marked from 0 to 180, in increments of 20.The y-axis is marked from 0 to 140, in increments of 20.A line slopes down from the point 0, 120 to the point 160, 0.
Refer to Figure 2.2.The linear production possibilities frontier in the figure indicates that
A)Atikamekw Cree have a comparative advantage in the production of vegetables.
B)Atikamekw Cree have a comparative disadvantage in the production of meat.
C)the trade-off between producing fish and grain is constant.
D)it is progressively more expensive to produce fish.
Question
Question
Question
Question
Question
Figure 2.1 Alt text for Figure 2.1: In figure 2.1, a graph compares roadsters and S U Vs.
Long description for Figure 2.1: The x-axis is labelled, S U Vs, and the y-axis is labelled, roadsters.3 points A, B, and C are plotted on the graph.A concave curve is drawn between the y-axis and the x-axis, from near the top of the y-axis, to near the end of the y-axis.Near the mid-point of the curve, it passes through point B.Point A is between the curve and the origin, and point C is outside the curve, midway along the x-axis and near the top of the y-axis.
Refer to Figure 2.1.Point B is
A)technically efficient.
B)unattainable with current resources.
C)inefficient in that not all resources are being used.
D)the equilibrium output combination.
Alt text for Figure 2.1: In figure 2.1, a graph compares roadsters and S U Vs.Long description for Figure 2.1: The x-axis is labelled, S U Vs, and the y-axis is labelled, roadsters.3 points A, B, and C are plotted on the graph.A concave curve is drawn between the y-axis and the x-axis, from near the top of the y-axis, to near the end of the y-axis.Near the mid-point of the curve, it passes through point B.Point A is between the curve and the origin, and point C is outside the curve, midway along the x-axis and near the top of the y-axis.
Refer to Figure 2.1.Point B is
A)technically efficient.
B)unattainable with current resources.
C)inefficient in that not all resources are being used.
D)the equilibrium output combination.
Question
Question
Table 2.1
Production choices for Tomaso's Trattoria
Refer to Table 2.1.Assume Tomaso's Trattoria only produces pizzas and calzones.A combination of 24 pizzas and 15 calzones would appear
A)along Tomaso's production possibilities frontier.
B)inside Tomaso's production possibilities frontier.
C)outside Tomaso's production possibilities frontier.
D)at the horizontal intercept of Tomaso's production possibilities frontier.
Question
Question
Question
Table 2.1
Production choices for Tomaso's Trattoria
Refer to Table 2.1.Assume Tomaso's Trattoria only produces pizzas and calzones.Tomaso faces ________ opportunity costs in the production of pizzas and calzones.
A)increasing
B)decreasing
C)constant
D)negative
Production choices for Tomaso's Trattoria
Refer to Table 2.1.Assume Tomaso's Trattoria only produces pizzas and calzones.Tomaso faces ________ opportunity costs in the production of pizzas and calzones.
A)increasing
B)decreasing
C)constant
D)negative
Question
Figure 2.4 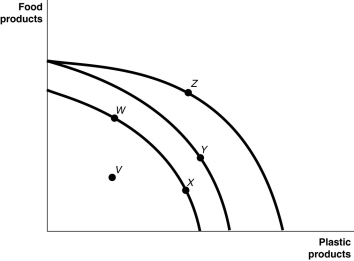 Figure 2.4 shows various points on three different production possibilities frontiers for a nation.
Alt text for Figure 2.4: In figure 2.4, a graph illustrates 3 different production possibilities.
Long description for Figure 2.4: The x-axis is labelled, plastic products, and the y-axis is labelled, food products.3 convex curves are shown, with points V, W, X, Y, and Z plotted.The first curve begins just past the half-way point on the y-axis, and ends just past the half-way point on the x-axis.Points W and X are plotted along the curve, with point W approximately 1 third of the way from the start of the curve, and point X more than 2 thirds of the way along the curve.The second curve begins almost 3 quarters of the way up the y-axis and ends just past the termination of the first curve on the x-axis.Point Y is plotted on the second curve, approximately 2 thirds of the way along the curve.The third curve begins at the same point as the second curve, and ends approximately 3 quarters of the way along the x-axis.Point Z is plotted on the third curve, a little less than half-way along the curve.Point V is plotted between the first curve and the origin.
Refer to Figure 2.4.Consider the following events: a.an increase in the unemployment rate
b.a decrease in a nation's money supply
c.a war that kills a significant portion of a nation's population
Which of the events listed above could cause a movement from Y to W ?
A)a, b and c
B)a and b only
C)a and c only
D)a only
E)c only
Figure 2.4 shows various points on three different production possibilities frontiers for a nation.Alt text for Figure 2.4: In figure 2.4, a graph illustrates 3 different production possibilities.
Long description for Figure 2.4: The x-axis is labelled, plastic products, and the y-axis is labelled, food products.3 convex curves are shown, with points V, W, X, Y, and Z plotted.The first curve begins just past the half-way point on the y-axis, and ends just past the half-way point on the x-axis.Points W and X are plotted along the curve, with point W approximately 1 third of the way from the start of the curve, and point X more than 2 thirds of the way along the curve.The second curve begins almost 3 quarters of the way up the y-axis and ends just past the termination of the first curve on the x-axis.Point Y is plotted on the second curve, approximately 2 thirds of the way along the curve.The third curve begins at the same point as the second curve, and ends approximately 3 quarters of the way along the x-axis.Point Z is plotted on the third curve, a little less than half-way along the curve.Point V is plotted between the first curve and the origin.
Refer to Figure 2.4.Consider the following events: a.an increase in the unemployment rate
b.a decrease in a nation's money supply
c.a war that kills a significant portion of a nation's population
Which of the events listed above could cause a movement from Y to W ?
A)a, b and c
B)a and b only
C)a and c only
D)a only
E)c only
Question
Figure 2.3 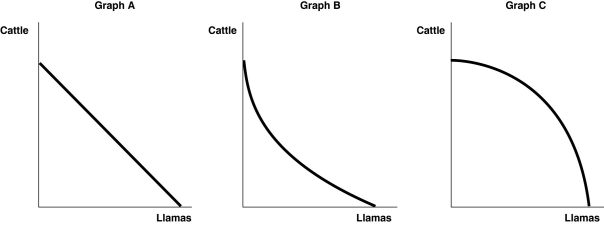 Alt text for Figure 2.3: In figure 2.3, 3 graphs, A, B and C comparing production of cattle and llamas.
Long description for Figure 2.3: Graph A: the x-axis is labelled, llamas, and y-axis is labelled, cattle.A line slopes down from the top left corner of the quadrant, near the top of the y-axis to the bottom right corner, near the end of the x-axis.Graph B: the x-axis is labelled, llamas, and y-axis is labelled, cattle.A convex curve begins in the top left corner, near the top of the y-axis and ends in the bottom right corner, near the end of the x-axis.Graph C: the x-axis is labelled, llamas, and y-axis is labelled, cattle.A concave curve begins in the top left corner near the top of the y-axis, and ends in the bottom right corner, near the end of the x-axis.
Refer to Figure 2.3.Sergio Vignetto raises cattle and llamas on his land.Half the land is more suitable for raising cattle and half the land is better suited for raising llamas.Which of the graphs in Figure 2.3 represent his production possibilities frontier?
A)Graph A
B)Graph B
C)Graph C
D)either Graph A or Graph C
E)either Graph B or Graph C
Alt text for Figure 2.3: In figure 2.3, 3 graphs, A, B and C comparing production of cattle and llamas.Long description for Figure 2.3: Graph A: the x-axis is labelled, llamas, and y-axis is labelled, cattle.A line slopes down from the top left corner of the quadrant, near the top of the y-axis to the bottom right corner, near the end of the x-axis.Graph B: the x-axis is labelled, llamas, and y-axis is labelled, cattle.A convex curve begins in the top left corner, near the top of the y-axis and ends in the bottom right corner, near the end of the x-axis.Graph C: the x-axis is labelled, llamas, and y-axis is labelled, cattle.A concave curve begins in the top left corner near the top of the y-axis, and ends in the bottom right corner, near the end of the x-axis.
Refer to Figure 2.3.Sergio Vignetto raises cattle and llamas on his land.Half the land is more suitable for raising cattle and half the land is better suited for raising llamas.Which of the graphs in Figure 2.3 represent his production possibilities frontier?
A)Graph A
B)Graph B
C)Graph C
D)either Graph A or Graph C
E)either Graph B or Graph C
Question
Question
Question
Figure 2.4 Figure 2.4 shows various points on three different production possibilities frontiers for a nation.
Alt text for Figure 2.4: In figure 2.4, a graph illustrates 3 different production possibilities.
Long description for Figure 2.4: The x-axis is labelled, plastic products, and the y-axis is labelled, food products.3 convex curves are shown, with points V, W, X, Y, and Z plotted.The first curve begins just past the half-way point on the y-axis, and ends just past the half-way point on the x-axis.Points W and X are plotted along the curve, with point W approximately 1 third of the way from the start of the curve, and point X more than 2 thirds of the way along the curve.The second curve begins almost 3 quarters of the way up the y-axis and ends just past the termination of the first curve on the x-axis.Point Y is plotted on the second curve, approximately 2 thirds of the way along the curve.The third curve begins at the same point as the second curve, and ends approximately 3 quarters of the way along the x-axis.Point Z is plotted on the third curve, a little less than half-way along the curve.Point V is plotted between the first curve and the origin.
Refer to Figure 2.4.A movement from Y to Z
A)represents an increase in the demand for plastic products.
B)could occur because of general technological advancements.
C)is the result of advancements in food production technology.
D)is the result of advancements in plastic production technology.
Figure 2.4 shows various points on three different production possibilities frontiers for a nation.Alt text for Figure 2.4: In figure 2.4, a graph illustrates 3 different production possibilities.
Long description for Figure 2.4: The x-axis is labelled, plastic products, and the y-axis is labelled, food products.3 convex curves are shown, with points V, W, X, Y, and Z plotted.The first curve begins just past the half-way point on the y-axis, and ends just past the half-way point on the x-axis.Points W and X are plotted along the curve, with point W approximately 1 third of the way from the start of the curve, and point X more than 2 thirds of the way along the curve.The second curve begins almost 3 quarters of the way up the y-axis and ends just past the termination of the first curve on the x-axis.Point Y is plotted on the second curve, approximately 2 thirds of the way along the curve.The third curve begins at the same point as the second curve, and ends approximately 3 quarters of the way along the x-axis.Point Z is plotted on the third curve, a little less than half-way along the curve.Point V is plotted between the first curve and the origin.
Refer to Figure 2.4.A movement from Y to Z
A)represents an increase in the demand for plastic products.
B)could occur because of general technological advancements.
C)is the result of advancements in food production technology.
D)is the result of advancements in plastic production technology.
Question
Question
Table 2.1
Production choices for Tomaso's Trattoria
Refer to Table 2.1.Assume Tomaso's Trattoria only produces pizzas and calzones.A combination of 36 pizzas and 30 calzones would appear
A)along Tomaso's production possibilities frontier.
B)inside Tomaso's production possibilities frontier.
C)outside Tomaso's production possibilities frontier.
D)at the horizontal intercept of Tomaso's production possibilities frontier.
Question
Figure 2.4 Figure 2.4 shows various points on three different production possibilities frontiers for a nation.
Alt text for Figure 2.4: In figure 2.4, a graph illustrates 3 different production possibilities.
Long description for Figure 2.4: The x-axis is labelled, plastic products, and the y-axis is labelled, food products.3 convex curves are shown, with points V, W, X, Y, and Z plotted.The first curve begins just past the half-way point on the y-axis, and ends just past the half-way point on the x-axis.Points W and X are plotted along the curve, with point W approximately 1 third of the way from the start of the curve, and point X more than 2 thirds of the way along the curve.The second curve begins almost 3 quarters of the way up the y-axis and ends just past the termination of the first curve on the x-axis.Point Y is plotted on the second curve, approximately 2 thirds of the way along the curve.The third curve begins at the same point as the second curve, and ends approximately 3 quarters of the way along the x-axis.Point Z is plotted on the third curve, a little less than half-way along the curve.Point V is plotted between the first curve and the origin.
Refer to Figure 2.4.Consider the following events: a.a decrease in the unemployment rate
B.general technological advancement
C.an increase in consumer wealth
Which of the events listed above could cause a movement from V to W ?
A)a only
B)a and b only
C)b and c only
D)a, b, and c
Figure 2.4 shows various points on three different production possibilities frontiers for a nation.Alt text for Figure 2.4: In figure 2.4, a graph illustrates 3 different production possibilities.
Long description for Figure 2.4: The x-axis is labelled, plastic products, and the y-axis is labelled, food products.3 convex curves are shown, with points V, W, X, Y, and Z plotted.The first curve begins just past the half-way point on the y-axis, and ends just past the half-way point on the x-axis.Points W and X are plotted along the curve, with point W approximately 1 third of the way from the start of the curve, and point X more than 2 thirds of the way along the curve.The second curve begins almost 3 quarters of the way up the y-axis and ends just past the termination of the first curve on the x-axis.Point Y is plotted on the second curve, approximately 2 thirds of the way along the curve.The third curve begins at the same point as the second curve, and ends approximately 3 quarters of the way along the x-axis.Point Z is plotted on the third curve, a little less than half-way along the curve.Point V is plotted between the first curve and the origin.
Refer to Figure 2.4.Consider the following events: a.a decrease in the unemployment rate
B.general technological advancement
C.an increase in consumer wealth
Which of the events listed above could cause a movement from V to W ?
A)a only
B)a and b only
C)b and c only
D)a, b, and c
Question
Figure 2.3 Alt text for Figure 2.3: In figure 2.3, 3 graphs, A, B and C comparing production of cattle and llamas.
Long description for Figure 2.3: Graph A: the x-axis is labelled, llamas, and y-axis is labelled, cattle.A line slopes down from the top left corner of the quadrant, near the top of the y-axis to the bottom right corner, near the end of the x-axis.Graph B: the x-axis is labelled, llamas, and y-axis is labelled, cattle.A convex curve begins in the top left corner, near the top of the y-axis and ends in the bottom right corner, near the end of the x-axis.Graph C: the x-axis is labelled, llamas, and y-axis is labelled, cattle.A concave curve begins in the top left corner near the top of the y-axis, and ends in the bottom right corner, near the end of the x-axis.
Refer to Figure 2.3.Sergio Vignetto raises cattle and llamas on his land.His land is equally suitable for raising either animal.Which of the graphs in Figure 2.3 represent his production possibilities frontier?
A)Graph A
B)Graph B
C)Graph C
D)either Graph A or Graph C
E)either Graph B or Graph C
Alt text for Figure 2.3: In figure 2.3, 3 graphs, A, B and C comparing production of cattle and llamas.Long description for Figure 2.3: Graph A: the x-axis is labelled, llamas, and y-axis is labelled, cattle.A line slopes down from the top left corner of the quadrant, near the top of the y-axis to the bottom right corner, near the end of the x-axis.Graph B: the x-axis is labelled, llamas, and y-axis is labelled, cattle.A convex curve begins in the top left corner, near the top of the y-axis and ends in the bottom right corner, near the end of the x-axis.Graph C: the x-axis is labelled, llamas, and y-axis is labelled, cattle.A concave curve begins in the top left corner near the top of the y-axis, and ends in the bottom right corner, near the end of the x-axis.
Refer to Figure 2.3.Sergio Vignetto raises cattle and llamas on his land.His land is equally suitable for raising either animal.Which of the graphs in Figure 2.3 represent his production possibilities frontier?
A)Graph A
B)Graph B
C)Graph C
D)either Graph A or Graph C
E)either Graph B or Graph C
Question
Figure 2.4 Figure 2.4 shows various points on three different production possibilities frontiers for a nation.
Alt text for Figure 2.4: In figure 2.4, a graph illustrates 3 different production possibilities.
Long description for Figure 2.4: The x-axis is labelled, plastic products, and the y-axis is labelled, food products.3 convex curves are shown, with points V, W, X, Y, and Z plotted.The first curve begins just past the half-way point on the y-axis, and ends just past the half-way point on the x-axis.Points W and X are plotted along the curve, with point W approximately 1 third of the way from the start of the curve, and point X more than 2 thirds of the way along the curve.The second curve begins almost 3 quarters of the way up the y-axis and ends just past the termination of the first curve on the x-axis.Point Y is plotted on the second curve, approximately 2 thirds of the way along the curve.The third curve begins at the same point as the second curve, and ends approximately 3 quarters of the way along the x-axis.Point Z is plotted on the third curve, a little less than half-way along the curve.Point V is plotted between the first curve and the origin.
Refer to Figure 2.4.Consider the following movements:
a.from point V to point W
b.from point W to point Y
c.from point Y to point Z
Which of the movements listed above represents economic growth?
A)a, b, and c
B)b and c only
C)a only
D)b only
Figure 2.4 shows various points on three different production possibilities frontiers for a nation.Alt text for Figure 2.4: In figure 2.4, a graph illustrates 3 different production possibilities.
Long description for Figure 2.4: The x-axis is labelled, plastic products, and the y-axis is labelled, food products.3 convex curves are shown, with points V, W, X, Y, and Z plotted.The first curve begins just past the half-way point on the y-axis, and ends just past the half-way point on the x-axis.Points W and X are plotted along the curve, with point W approximately 1 third of the way from the start of the curve, and point X more than 2 thirds of the way along the curve.The second curve begins almost 3 quarters of the way up the y-axis and ends just past the termination of the first curve on the x-axis.Point Y is plotted on the second curve, approximately 2 thirds of the way along the curve.The third curve begins at the same point as the second curve, and ends approximately 3 quarters of the way along the x-axis.Point Z is plotted on the third curve, a little less than half-way along the curve.Point V is plotted between the first curve and the origin.
Refer to Figure 2.4.Consider the following movements:
a.from point V to point W
b.from point W to point Y
c.from point Y to point Z
Which of the movements listed above represents economic growth?
A)a, b, and c
B)b and c only
C)a only
D)b only
Question
Table 2.1
Production choices for Tomaso's Trattoria
Refer to Table 2.1.Assume Tomaso's Trattoria only produces pizzas and calzones.A combination of 24 pizzas and 30 calzones would appear
A)along Tomaso's production possibilities frontier.
B)inside Tomaso's production possibilities frontier.
C)outside Tomaso's production possibilities frontier.
D)at the horizontal intercept of Tomaso's production possibilities frontier.
Question
Question
Question
Question
Figure 2.4 Figure 2.4 shows various points on three different production possibilities frontiers for a nation.
Alt text for Figure 2.4: In figure 2.4, a graph illustrates 3 different production possibilities.
Long description for Figure 2.4: The x-axis is labelled, plastic products, and the y-axis is labelled, food products.3 convex curves are shown, with points V, W, X, Y, and Z plotted.The first curve begins just past the half-way point on the y-axis, and ends just past the half-way point on the x-axis.Points W and X are plotted along the curve, with point W approximately 1 third of the way from the start of the curve, and point X more than 2 thirds of the way along the curve.The second curve begins almost 3 quarters of the way up the y-axis and ends just past the termination of the first curve on the x-axis.Point Y is plotted on the second curve, approximately 2 thirds of the way along the curve.The third curve begins at the same point as the second curve, and ends approximately 3 quarters of the way along the x-axis.Point Z is plotted on the third curve, a little less than half-way along the curve.Point V is plotted between the first curve and the origin.
Refer to Figure 2.4.A movement from X to Y
A)could be due to a change in consumers' tastes and preferences.
B)could occur because of an influx of immigrant labour.
C)is the result of advancements in food production technology only, with no change in the technology for plastic production.
D)is the result of advancements in plastic production technology only, with no change in food production technology.
Figure 2.4 shows various points on three different production possibilities frontiers for a nation.Alt text for Figure 2.4: In figure 2.4, a graph illustrates 3 different production possibilities.
Long description for Figure 2.4: The x-axis is labelled, plastic products, and the y-axis is labelled, food products.3 convex curves are shown, with points V, W, X, Y, and Z plotted.The first curve begins just past the half-way point on the y-axis, and ends just past the half-way point on the x-axis.Points W and X are plotted along the curve, with point W approximately 1 third of the way from the start of the curve, and point X more than 2 thirds of the way along the curve.The second curve begins almost 3 quarters of the way up the y-axis and ends just past the termination of the first curve on the x-axis.Point Y is plotted on the second curve, approximately 2 thirds of the way along the curve.The third curve begins at the same point as the second curve, and ends approximately 3 quarters of the way along the x-axis.Point Z is plotted on the third curve, a little less than half-way along the curve.Point V is plotted between the first curve and the origin.
Refer to Figure 2.4.A movement from X to Y
A)could be due to a change in consumers' tastes and preferences.
B)could occur because of an influx of immigrant labour.
C)is the result of advancements in food production technology only, with no change in the technology for plastic production.
D)is the result of advancements in plastic production technology only, with no change in food production technology.
Question
Figure 2.4 Figure 2.4 shows various points on three different production possibilities frontiers for a nation.
Alt text for Figure 2.4: In figure 2.4, a graph illustrates 3 different production possibilities.
Long description for Figure 2.4: The x-axis is labelled, plastic products, and the y-axis is labelled, food products.3 convex curves are shown, with points V, W, X, Y, and Z plotted.The first curve begins just past the half-way point on the y-axis, and ends just past the half-way point on the x-axis.Points W and X are plotted along the curve, with point W approximately 1 third of the way from the start of the curve, and point X more than 2 thirds of the way along the curve.The second curve begins almost 3 quarters of the way up the y-axis and ends just past the termination of the first curve on the x-axis.Point Y is plotted on the second curve, approximately 2 thirds of the way along the curve.The third curve begins at the same point as the second curve, and ends approximately 3 quarters of the way along the x-axis.Point Z is plotted on the third curve, a little less than half-way along the curve.Point V is plotted between the first curve and the origin.
Refer to Figure 2.4.Consider the following events: a. a reduction in the patent protection period to no more than 2 years
b. a war that destroys a substantial portion of a nation's capital stock
c. the lack of secure and enforceable property rights system
Which of the events listed above could cause a movement from W to V?
A)a only
B)a and b only
C)a and c only
D)b and c only
E)a, b, and c
Figure 2.4 shows various points on three different production possibilities frontiers for a nation.Alt text for Figure 2.4: In figure 2.4, a graph illustrates 3 different production possibilities.
Long description for Figure 2.4: The x-axis is labelled, plastic products, and the y-axis is labelled, food products.3 convex curves are shown, with points V, W, X, Y, and Z plotted.The first curve begins just past the half-way point on the y-axis, and ends just past the half-way point on the x-axis.Points W and X are plotted along the curve, with point W approximately 1 third of the way from the start of the curve, and point X more than 2 thirds of the way along the curve.The second curve begins almost 3 quarters of the way up the y-axis and ends just past the termination of the first curve on the x-axis.Point Y is plotted on the second curve, approximately 2 thirds of the way along the curve.The third curve begins at the same point as the second curve, and ends approximately 3 quarters of the way along the x-axis.Point Z is plotted on the third curve, a little less than half-way along the curve.Point V is plotted between the first curve and the origin.
Refer to Figure 2.4.Consider the following events: a. a reduction in the patent protection period to no more than 2 years
b. a war that destroys a substantial portion of a nation's capital stock
c. the lack of secure and enforceable property rights system
Which of the events listed above could cause a movement from W to V?
A)a only
B)a and b only
C)a and c only
D)b and c only
E)a, b, and c
Question
Question
Figure 2.5 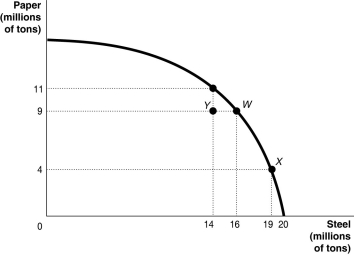 Alt text for Figure 2.5: In figure 2.5, a graph compares paper and steel production.
Long description for Figure 2.5: The x-axis is labelled, steel in millions of tons and the quantities 14, 16, 19, and 20 are marked.The y-axis is labelled, paper in millions of tons, and the quantities 4, 9, and 11 are marked.Points Y(14, 9), W(16, 9), (19, 4), and an unnamed point (14, 11)are plotted on the graph, and joined to the respective axes using dotted lines.A concave curve is drawn from the y-axis to the x-axis, passing through the unnamed point (14, 11), and points W(16, 9), and X(19, 4).Point Y is between the curve and the axes.
Refer to Figure 2.5. If this economy is currently considering switching from point X to point W, what is the opportunity cost of each newly produced ton of paper?
A)0)6 tons of steel
B)3 tons of steel
C)1)67 tons of paper
D)5 tons of paper.
Alt text for Figure 2.5: In figure 2.5, a graph compares paper and steel production.Long description for Figure 2.5: The x-axis is labelled, steel in millions of tons and the quantities 14, 16, 19, and 20 are marked.The y-axis is labelled, paper in millions of tons, and the quantities 4, 9, and 11 are marked.Points Y(14, 9), W(16, 9), (19, 4), and an unnamed point (14, 11)are plotted on the graph, and joined to the respective axes using dotted lines.A concave curve is drawn from the y-axis to the x-axis, passing through the unnamed point (14, 11), and points W(16, 9), and X(19, 4).Point Y is between the curve and the axes.
Refer to Figure 2.5. If this economy is currently considering switching from point X to point W, what is the opportunity cost of each newly produced ton of paper?
A)0)6 tons of steel
B)3 tons of steel
C)1)67 tons of paper
D)5 tons of paper.
Question
Question
Question
Question
Question
Figure 2.6 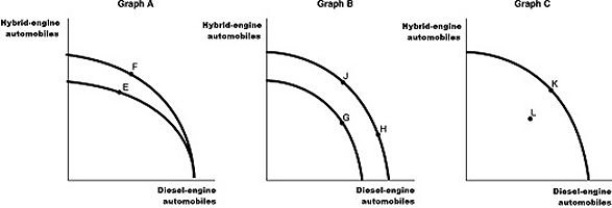 Toyota found the emission standards too difficult to meet to bring its diesel-engine offerings to North America.They have instead focused their research on hybrid-engine technology.Assume Toyota chooses to produce both hybrid-engine vehicles and diesel-engine vehicles (for markets outside North America)for its Prius brand.Figure 2.6 shows changes to its production possibilities frontier in response to new developments and different strategic production decisions.
Alt text for Figure 2.6: In figure 2.6, 3 graphs, A, B and C show the changes to Toyota's production possibilities frontier.
Long description for Figure 2.6: Graph A: The x-axis is labelled, diesel-engine automobiles, and the y-axis is labelled, hybrid-engine automobiles.2 convex curves are shown.The first curve begins slightly above the half-way point of the y-axis and ends near the end of the x-axis.The curve passes through point E about 1 third of the way along the curve.The second curve begins slightly above the first, on the y-axis.It finishes at the exact same point on the x-axis.The second curve passes through point F about 1 third of the way along the curve.Graph B: The x-axis is labelled, diesel-engine automobiles, and the y-axis is labelled hybrid-engine automobiles.2 convex curves are shown.The first curve begins slightly above the half-way mark on the y-axis and finishes about 2 thirds of the way along the x-axis.The curve passes through the point G, about halfway along the curve.The second curve begins slightly above the first on the y-axis, and finishes just past the end of the first on the x-axis.The curve passes through point J about 1 third of the way along the curve, and point H about 3 fourths of the way along the curve.Graph C: The x-axis is labelled, diesel-engine automobiles, and the y-axis is labelled hybrid-engine automobiles.A convex curve begins near the top of the y-axis and finishes near the end of the x-axis.It passes through point K about half-way along the curve.Point L is plotted between the curve and the axes.
Refer to Figure 2.6.Assume that in 2019, after extensive research and development Toyota builds a new factory that can produce both types of vehicles that meet emission standards.This is best represented by the
A)movement from E to F in Graph A.
B)movement from H to J in Graph B.
C)movement from L to K in Graph C.
D)movement from J to G in Graph B.
Toyota found the emission standards too difficult to meet to bring its diesel-engine offerings to North America.They have instead focused their research on hybrid-engine technology.Assume Toyota chooses to produce both hybrid-engine vehicles and diesel-engine vehicles (for markets outside North America)for its Prius brand.Figure 2.6 shows changes to its production possibilities frontier in response to new developments and different strategic production decisions.Alt text for Figure 2.6: In figure 2.6, 3 graphs, A, B and C show the changes to Toyota's production possibilities frontier.
Long description for Figure 2.6: Graph A: The x-axis is labelled, diesel-engine automobiles, and the y-axis is labelled, hybrid-engine automobiles.2 convex curves are shown.The first curve begins slightly above the half-way point of the y-axis and ends near the end of the x-axis.The curve passes through point E about 1 third of the way along the curve.The second curve begins slightly above the first, on the y-axis.It finishes at the exact same point on the x-axis.The second curve passes through point F about 1 third of the way along the curve.Graph B: The x-axis is labelled, diesel-engine automobiles, and the y-axis is labelled hybrid-engine automobiles.2 convex curves are shown.The first curve begins slightly above the half-way mark on the y-axis and finishes about 2 thirds of the way along the x-axis.The curve passes through the point G, about halfway along the curve.The second curve begins slightly above the first on the y-axis, and finishes just past the end of the first on the x-axis.The curve passes through point J about 1 third of the way along the curve, and point H about 3 fourths of the way along the curve.Graph C: The x-axis is labelled, diesel-engine automobiles, and the y-axis is labelled hybrid-engine automobiles.A convex curve begins near the top of the y-axis and finishes near the end of the x-axis.It passes through point K about half-way along the curve.Point L is plotted between the curve and the axes.
Refer to Figure 2.6.Assume that in 2019, after extensive research and development Toyota builds a new factory that can produce both types of vehicles that meet emission standards.This is best represented by the
A)movement from E to F in Graph A.
B)movement from H to J in Graph B.
C)movement from L to K in Graph C.
D)movement from J to G in Graph B.
Question
Figure 2.6 Toyota found the emission standards too difficult to meet to bring its diesel-engine offerings to North America.They have instead focused their research on hybrid-engine technology.Assume Toyota chooses to produce both hybrid-engine vehicles and diesel-engine vehicles (for markets outside North America)for its Prius brand.Figure 2.6 shows changes to its production possibilities frontier in response to new developments and different strategic production decisions.
Alt text for Figure 2.6: In figure 2.6, 3 graphs, A, B and C show the changes to Toyota's production possibilities frontier.
Long description for Figure 2.6: Graph A: The x-axis is labelled, diesel-engine automobiles, and the y-axis is labelled, hybrid-engine automobiles.2 convex curves are shown.The first curve begins slightly above the half-way point of the y-axis and ends near the end of the x-axis.The curve passes through point E about 1 third of the way along the curve.The second curve begins slightly above the first, on the y-axis.It finishes at the exact same point on the x-axis.The second curve passes through point F about 1 third of the way along the curve.Graph B: The x-axis is labelled, diesel-engine automobiles, and the y-axis is labelled hybrid-engine automobiles.2 convex curves are shown.The first curve begins slightly above the half-way mark on the y-axis and finishes about 2 thirds of the way along the x-axis.The curve passes through the point G, about halfway along the curve.The second curve begins slightly above the first on the y-axis, and finishes just past the end of the first on the x-axis.The curve passes through point J about 1 third of the way along the curve, and point H about 3 fourths of the way along the curve.Graph C: The x-axis is labelled, diesel-engine automobiles, and the y-axis is labelled hybrid-engine automobiles.A convex curve begins near the top of the y-axis and finishes near the end of the x-axis.It passes through point K about half-way along the curve.Point L is plotted between the curve and the axes.
Refer to Figure 2.6.Assume a technological advancement greatly reduces the cost to produce hybrid-engine vehicles.This is best represented by the
A)movement from E to F in Graph A.
B)movement from G to H in Graph B.
C)movement from K to L in Graph C.
D)movement from H to J in Graph B.
Toyota found the emission standards too difficult to meet to bring its diesel-engine offerings to North America.They have instead focused their research on hybrid-engine technology.Assume Toyota chooses to produce both hybrid-engine vehicles and diesel-engine vehicles (for markets outside North America)for its Prius brand.Figure 2.6 shows changes to its production possibilities frontier in response to new developments and different strategic production decisions.Alt text for Figure 2.6: In figure 2.6, 3 graphs, A, B and C show the changes to Toyota's production possibilities frontier.
Long description for Figure 2.6: Graph A: The x-axis is labelled, diesel-engine automobiles, and the y-axis is labelled, hybrid-engine automobiles.2 convex curves are shown.The first curve begins slightly above the half-way point of the y-axis and ends near the end of the x-axis.The curve passes through point E about 1 third of the way along the curve.The second curve begins slightly above the first, on the y-axis.It finishes at the exact same point on the x-axis.The second curve passes through point F about 1 third of the way along the curve.Graph B: The x-axis is labelled, diesel-engine automobiles, and the y-axis is labelled hybrid-engine automobiles.2 convex curves are shown.The first curve begins slightly above the half-way mark on the y-axis and finishes about 2 thirds of the way along the x-axis.The curve passes through the point G, about halfway along the curve.The second curve begins slightly above the first on the y-axis, and finishes just past the end of the first on the x-axis.The curve passes through point J about 1 third of the way along the curve, and point H about 3 fourths of the way along the curve.Graph C: The x-axis is labelled, diesel-engine automobiles, and the y-axis is labelled hybrid-engine automobiles.A convex curve begins near the top of the y-axis and finishes near the end of the x-axis.It passes through point K about half-way along the curve.Point L is plotted between the curve and the axes.
Refer to Figure 2.6.Assume a technological advancement greatly reduces the cost to produce hybrid-engine vehicles.This is best represented by the
A)movement from E to F in Graph A.
B)movement from G to H in Graph B.
C)movement from K to L in Graph C.
D)movement from H to J in Graph B.
Question
Question
Figure 2.5 Alt text for Figure 2.5: In figure 2.5, a graph compares paper and steel production.
Long description for Figure 2.5: The x-axis is labelled, steel in millions of tons and the quantities 14, 16, 19, and 20 are marked.The y-axis is labelled, paper in millions of tons, and the quantities 4, 9, and 11 are marked.Points Y(14, 9), W(16, 9), (19, 4), and an unnamed point (14, 11)are plotted on the graph, and joined to the respective axes using dotted lines.A concave curve is drawn from the y-axis to the x-axis, passing through the unnamed point (14, 11), and points W(16, 9), and X(19, 4).Point Y is between the curve and the axes.
Refer to Figure 2.5.If the economy is currently producing at point Y, what is the opportunity cost of moving to point W?
A)2 million tons of steel
B)zero
C)9 million tons of paper
D)16 million tons of paper
Alt text for Figure 2.5: In figure 2.5, a graph compares paper and steel production.Long description for Figure 2.5: The x-axis is labelled, steel in millions of tons and the quantities 14, 16, 19, and 20 are marked.The y-axis is labelled, paper in millions of tons, and the quantities 4, 9, and 11 are marked.Points Y(14, 9), W(16, 9), (19, 4), and an unnamed point (14, 11)are plotted on the graph, and joined to the respective axes using dotted lines.A concave curve is drawn from the y-axis to the x-axis, passing through the unnamed point (14, 11), and points W(16, 9), and X(19, 4).Point Y is between the curve and the axes.
Refer to Figure 2.5.If the economy is currently producing at point Y, what is the opportunity cost of moving to point W?
A)2 million tons of steel
B)zero
C)9 million tons of paper
D)16 million tons of paper
Question
Figure 2.6 Toyota found the emission standards too difficult to meet to bring its diesel-engine offerings to North America.They have instead focused their research on hybrid-engine technology.Assume Toyota chooses to produce both hybrid-engine vehicles and diesel-engine vehicles (for markets outside North America)for its Prius brand.Figure 2.6 shows changes to its production possibilities frontier in response to new developments and different strategic production decisions.
Alt text for Figure 2.6: In figure 2.6, 3 graphs, A, B and C show the changes to Toyota's production possibilities frontier.
Long description for Figure 2.6: Graph A: The x-axis is labelled, diesel-engine automobiles, and the y-axis is labelled, hybrid-engine automobiles.2 convex curves are shown.The first curve begins slightly above the half-way point of the y-axis and ends near the end of the x-axis.The curve passes through point E about 1 third of the way along the curve.The second curve begins slightly above the first, on the y-axis.It finishes at the exact same point on the x-axis.The second curve passes through point F about 1 third of the way along the curve.Graph B: The x-axis is labelled, diesel-engine automobiles, and the y-axis is labelled hybrid-engine automobiles.2 convex curves are shown.The first curve begins slightly above the half-way mark on the y-axis and finishes about 2 thirds of the way along the x-axis.The curve passes through the point G, about halfway along the curve.The second curve begins slightly above the first on the y-axis, and finishes just past the end of the first on the x-axis.The curve passes through point J about 1 third of the way along the curve, and point H about 3 fourths of the way along the curve.Graph C: The x-axis is labelled, diesel-engine automobiles, and the y-axis is labelled hybrid-engine automobiles.A convex curve begins near the top of the y-axis and finishes near the end of the x-axis.It passes through point K about half-way along the curve.Point L is plotted between the curve and the axes.
Refer to Figure 2.6.In response to changing regulations and enforcement, Toyota has cut back on the production of diesel-powered vehicles and increased its hybrid production.This strategy is best represented by the
A)movement from F to E in Graph A.
B)movement from G to J in Graph B.
C)movement from L to K in Graph C.
D)movement from J to H in Graph B.
Toyota found the emission standards too difficult to meet to bring its diesel-engine offerings to North America.They have instead focused their research on hybrid-engine technology.Assume Toyota chooses to produce both hybrid-engine vehicles and diesel-engine vehicles (for markets outside North America)for its Prius brand.Figure 2.6 shows changes to its production possibilities frontier in response to new developments and different strategic production decisions.Alt text for Figure 2.6: In figure 2.6, 3 graphs, A, B and C show the changes to Toyota's production possibilities frontier.
Long description for Figure 2.6: Graph A: The x-axis is labelled, diesel-engine automobiles, and the y-axis is labelled, hybrid-engine automobiles.2 convex curves are shown.The first curve begins slightly above the half-way point of the y-axis and ends near the end of the x-axis.The curve passes through point E about 1 third of the way along the curve.The second curve begins slightly above the first, on the y-axis.It finishes at the exact same point on the x-axis.The second curve passes through point F about 1 third of the way along the curve.Graph B: The x-axis is labelled, diesel-engine automobiles, and the y-axis is labelled hybrid-engine automobiles.2 convex curves are shown.The first curve begins slightly above the half-way mark on the y-axis and finishes about 2 thirds of the way along the x-axis.The curve passes through the point G, about halfway along the curve.The second curve begins slightly above the first on the y-axis, and finishes just past the end of the first on the x-axis.The curve passes through point J about 1 third of the way along the curve, and point H about 3 fourths of the way along the curve.Graph C: The x-axis is labelled, diesel-engine automobiles, and the y-axis is labelled hybrid-engine automobiles.A convex curve begins near the top of the y-axis and finishes near the end of the x-axis.It passes through point K about half-way along the curve.Point L is plotted between the curve and the axes.
Refer to Figure 2.6.In response to changing regulations and enforcement, Toyota has cut back on the production of diesel-powered vehicles and increased its hybrid production.This strategy is best represented by the
A)movement from F to E in Graph A.
B)movement from G to J in Graph B.
C)movement from L to K in Graph C.
D)movement from J to H in Graph B.
Question
Question
Figure 2.5 Alt text for Figure 2.5: In figure 2.5, a graph compares paper and steel production.
Long description for Figure 2.5: The x-axis is labelled, steel in millions of tons and the quantities 14, 16, 19, and 20 are marked.The y-axis is labelled, paper in millions of tons, and the quantities 4, 9, and 11 are marked.Points Y(14, 9), W(16, 9), (19, 4), and an unnamed point (14, 11)are plotted on the graph, and joined to the respective axes using dotted lines.A concave curve is drawn from the y-axis to the x-axis, passing through the unnamed point (14, 11), and points W(16, 9), and X(19, 4).Point Y is between the curve and the axes.
Refer to Figure 2.5. If this economy is currently producing at point X, what is the opportunity cost of moving to point W?
A)3 million tons of steel
B)5 tons of paper
C)7 tons of paper
D)19 tons of steel
Alt text for Figure 2.5: In figure 2.5, a graph compares paper and steel production.Long description for Figure 2.5: The x-axis is labelled, steel in millions of tons and the quantities 14, 16, 19, and 20 are marked.The y-axis is labelled, paper in millions of tons, and the quantities 4, 9, and 11 are marked.Points Y(14, 9), W(16, 9), (19, 4), and an unnamed point (14, 11)are plotted on the graph, and joined to the respective axes using dotted lines.A concave curve is drawn from the y-axis to the x-axis, passing through the unnamed point (14, 11), and points W(16, 9), and X(19, 4).Point Y is between the curve and the axes.
Refer to Figure 2.5. If this economy is currently producing at point X, what is the opportunity cost of moving to point W?
A)3 million tons of steel
B)5 tons of paper
C)7 tons of paper
D)19 tons of steel
Question
Figure 2.5 Alt text for Figure 2.5: In figure 2.5, a graph compares paper and steel production.
Long description for Figure 2.5: The x-axis is labelled, steel in millions of tons and the quantities 14, 16, 19, and 20 are marked.The y-axis is labelled, paper in millions of tons, and the quantities 4, 9, and 11 are marked.Points Y(14, 9), W(16, 9), (19, 4), and an unnamed point (14, 11)are plotted on the graph, and joined to the respective axes using dotted lines.A concave curve is drawn from the y-axis to the x-axis, passing through the unnamed point (14, 11), and points W(16, 9), and X(19, 4).Point Y is between the curve and the axes.
Refer to Figure 2.5.If the economy is currently producing at point W, what is the opportunity cost of moving to point X?
A)3 million tons of steel
B)19 million tons of steel
C)5 million tons of paper
D)9 million tons of paper
Alt text for Figure 2.5: In figure 2.5, a graph compares paper and steel production.Long description for Figure 2.5: The x-axis is labelled, steel in millions of tons and the quantities 14, 16, 19, and 20 are marked.The y-axis is labelled, paper in millions of tons, and the quantities 4, 9, and 11 are marked.Points Y(14, 9), W(16, 9), (19, 4), and an unnamed point (14, 11)are plotted on the graph, and joined to the respective axes using dotted lines.A concave curve is drawn from the y-axis to the x-axis, passing through the unnamed point (14, 11), and points W(16, 9), and X(19, 4).Point Y is between the curve and the axes.
Refer to Figure 2.5.If the economy is currently producing at point W, what is the opportunity cost of moving to point X?
A)3 million tons of steel
B)19 million tons of steel
C)5 million tons of paper
D)9 million tons of paper
Question
Question
Question
Question
Question
Question
Figure 2.7 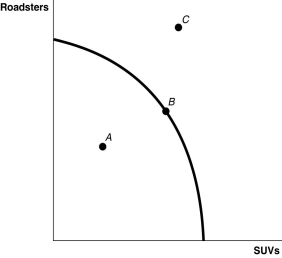 Alt text for Figure 2.7: In figure 2.7, a graph compares production possibility frontiers of S U Vs and Roadsters.
Long description for Figure 2.7: The x-axis is labelled, S U Vs, and the y-axis is labelled, Roadsters.A convex curve begins near the top of the y-axis and ends approximately 3 quarters of the way down the x-axis.The point B is plotted midway along the curve.Point A is plotted between the curve and the y-axis.Point C is plotted outside the curve, near the top of the y-axis and approximately midway along the x-axis.
Refer to Figure 2.7. ________ is (are)inefficient in that not all resources are being used.
A)Point A
B)Point B
C)Point C
D)Points A and C
Alt text for Figure 2.7: In figure 2.7, a graph compares production possibility frontiers of S U Vs and Roadsters.Long description for Figure 2.7: The x-axis is labelled, S U Vs, and the y-axis is labelled, Roadsters.A convex curve begins near the top of the y-axis and ends approximately 3 quarters of the way down the x-axis.The point B is plotted midway along the curve.Point A is plotted between the curve and the y-axis.Point C is plotted outside the curve, near the top of the y-axis and approximately midway along the x-axis.
Refer to Figure 2.7. ________ is (are)inefficient in that not all resources are being used.
A)Point A
B)Point B
C)Point C
D)Points A and C
Question
Question
Question
Question
Question
Question
Question
Question
Figure 2.7 Alt text for Figure 2.7: In figure 2.7, a graph compares production possibility frontiers of S U Vs and Roadsters.
Long description for Figure 2.7: The x-axis is labelled, S U Vs, and the y-axis is labelled, Roadsters.A convex curve begins near the top of the y-axis and ends approximately 3 quarters of the way down the x-axis.The point B is plotted midway along the curve.Point A is plotted between the curve and the y-axis.Point C is plotted outside the curve, near the top of the y-axis and approximately midway along the x-axis.
Refer to Figure 2.7. ________ is (are)unattainable with current resources.
A)Point A
B)Point B
C)Point C
D)Points A and C
Alt text for Figure 2.7: In figure 2.7, a graph compares production possibility frontiers of S U Vs and Roadsters.Long description for Figure 2.7: The x-axis is labelled, S U Vs, and the y-axis is labelled, Roadsters.A convex curve begins near the top of the y-axis and ends approximately 3 quarters of the way down the x-axis.The point B is plotted midway along the curve.Point A is plotted between the curve and the y-axis.Point C is plotted outside the curve, near the top of the y-axis and approximately midway along the x-axis.
Refer to Figure 2.7. ________ is (are)unattainable with current resources.
A)Point A
B)Point B
C)Point C
D)Points A and C
Question
Question
Table 2.2 
Refer to Table 2.2.The Fruit Farm produces only apples and pears.The table above shows the maximum possible output combinations of the two fruits using all resources and currently available technology.
a.Graph The Fruit Farm's production possibilities frontier.Put apples on the horizontal axis and pears on the vertical axis.Be sure to identify the output combination points on your diagram.
b.Suppose The Fruit Farm is currently producing at point D.What is the opportunity cost of producing an additional 8,000 pounds of pears?
c.Suppose The Fruit Farm is currently producing at point D.What happens to the opportunity cost of producing more and more pears? Does it increase, decrease or remain constant? Explain your answer.
d.Suppose The Fruit Farm is currently producing at point G.What happens to the opportunity cost of producing more and more apples? Does it increase, decrease or remain constant? Explain your answer.
e.Suppose The Fruit Farm is plagued by the apple maggot infestation which destroys apple trees but not pears.Show in a graph what happens to its PPF.
Question
Question
Question
Question
Question
Question
Question
Figure 2.7 Alt text for Figure 2.7: In figure 2.7, a graph compares production possibility frontiers of S U Vs and Roadsters.
Long description for Figure 2.7: The x-axis is labelled, S U Vs, and the y-axis is labelled, Roadsters.A convex curve begins near the top of the y-axis and ends approximately 3 quarters of the way down the x-axis.The point B is plotted midway along the curve.Point A is plotted between the curve and the y-axis.Point C is plotted outside the curve, near the top of the y-axis and approximately midway along the x-axis.
Refer to Figure 2.7. ________ is (are)technically efficient.
A)Point A
B)Point B
C)Point C
D)Points B and C
Alt text for Figure 2.7: In figure 2.7, a graph compares production possibility frontiers of S U Vs and Roadsters.Long description for Figure 2.7: The x-axis is labelled, S U Vs, and the y-axis is labelled, Roadsters.A convex curve begins near the top of the y-axis and ends approximately 3 quarters of the way down the x-axis.The point B is plotted midway along the curve.Point A is plotted between the curve and the y-axis.Point C is plotted outside the curve, near the top of the y-axis and approximately midway along the x-axis.
Refer to Figure 2.7. ________ is (are)technically efficient.
A)Point A
B)Point B
C)Point C
D)Points B and C
Question
Question

Unlock Deck
Sign up to unlock the cards in this deck!
Unlock Deck
Unlock Deck
1/314
Play
Full screen (f)
Deck 2: Trade-Offs, Comparative Advantage, and the Market System
1
The production possibilities frontier model assumes which of the following?
A)Labour, capital, land and natural resources are unlimited in quantity.
B)The economy produces only two products.
C)Any level of the two products that the economy produces is currently possible.
D)The level of technology is variable.
A)Labour, capital, land and natural resources are unlimited in quantity.
B)The economy produces only two products.
C)Any level of the two products that the economy produces is currently possible.
D)The level of technology is variable.
The economy produces only two products.
2
The principle of opportunity cost is that
A)in a market economy, taking advantage of profitable opportunities involves some money cost.
B)the economic cost of using a factor of production is the alternative use of that factor that is given up.
C)taking advantage of investment opportunities involves costs.
D)the cost of production varies depending on the opportunity for technological application.
the economic cost of using a factor of production is the alternative use of that factor that is given up.
3
Toyota built an assembly plant in Woodstock, Ontario.At this plant, Toyota is able to take advantage of paying lower transportation costs on cars to be sold in Canada than it would from its Japanese assembly plants, but it also sacrifices the ease of supervising its Japanese workers, who generally have high skills levels and few labour disputes.In deciding to open the Woodstock plant, Toyota
A)faced no trade-offs because employing lower-wage workers increased efficiency.
B)faced a trade-off between cost and convenience.
C)adopted a negative technological change because it replaced high-skilled workers with low-skilled workers.
D)eroded some of its competitiveness in the luxury car market because of its decreased cost of production.
faced a trade-off between cost and convenience.
4
In a production possibilities frontier model, a point ________ the frontier is productively inefficient.
A)along
B)inside
C)outside
D)at either intercept of
A)along
B)inside
C)outside
D)at either intercept of
Unlock Deck
Unlock for access to all 314 flashcards in this deck.
Unlock Deck
k this deck
5
Bella can produce either a combination of 60 silk roses and 80 silk leaves or a combination of 70 silk roses and 55 silk leaves.If she now produces 60 silk roses and 80 silk leaves, what is the opportunity cost of producing an additional 10 silk roses?
A)2)5 silk leaves
B)10 silk leaves
C)25 silk leaves
D)55 silk leaves
A)2)5 silk leaves
B)10 silk leaves
C)25 silk leaves
D)55 silk leaves
Unlock Deck
Unlock for access to all 314 flashcards in this deck.
Unlock Deck
k this deck
6
A production possibilities frontier with a bowed outward shape indicates
A)the possibility of inefficient production.
B)constant opportunity costs as more and more of one good is produced.
C)increasing opportunity costs as more and more of one good is produced.
D)decreasing opportunity costs as more and more of one good is produced.
A)the possibility of inefficient production.
B)constant opportunity costs as more and more of one good is produced.
C)increasing opportunity costs as more and more of one good is produced.
D)decreasing opportunity costs as more and more of one good is produced.
Unlock Deck
Unlock for access to all 314 flashcards in this deck.
Unlock Deck
k this deck
7
Figure 2.1 Alt text for Figure 2.1: In figure 2.1, a graph compares roadsters and S U Vs.
Long description for Figure 2.1: The x-axis is labelled, S U Vs, and the y-axis is labelled, roadsters.3 points A, B, and C are plotted on the graph.A concave curve is drawn between the y-axis and the x-axis, from near the top of the y-axis, to near the end of the y-axis.Near the mid-point of the curve, it passes through point B.Point A is between the curve and the origin, and point C is outside the curve, midway along the x-axis and near the top of the y-axis.
Refer to Figure 2.1.At point A the opportunity cost of producing more SUVs is
A)0 roadsters.
B)0 SUVs.
C)2)5 roadsters per SUV.
D)impossible to determine.
Alt text for Figure 2.1: In figure 2.1, a graph compares roadsters and S U Vs.Long description for Figure 2.1: The x-axis is labelled, S U Vs, and the y-axis is labelled, roadsters.3 points A, B, and C are plotted on the graph.A concave curve is drawn between the y-axis and the x-axis, from near the top of the y-axis, to near the end of the y-axis.Near the mid-point of the curve, it passes through point B.Point A is between the curve and the origin, and point C is outside the curve, midway along the x-axis and near the top of the y-axis.
Refer to Figure 2.1.At point A the opportunity cost of producing more SUVs is
A)0 roadsters.
B)0 SUVs.
C)2)5 roadsters per SUV.
D)impossible to determine.
Unlock Deck
Unlock for access to all 314 flashcards in this deck.
Unlock Deck
k this deck
8
Figure 2.1 Alt text for Figure 2.1: In figure 2.1, a graph compares roadsters and S U Vs.
Long description for Figure 2.1: The x-axis is labelled, S U Vs, and the y-axis is labelled, roadsters.3 points A, B, and C are plotted on the graph.A concave curve is drawn between the y-axis and the x-axis, from near the top of the y-axis, to near the end of the y-axis.Near the mid-point of the curve, it passes through point B.Point A is between the curve and the origin, and point C is outside the curve, midway along the x-axis and near the top of the y-axis.
Refer to Figure 2.1.Point C is
A)technically efficient.
B)unattainable with current resources.
C)inefficient in that not all resources are being used.
D)is the equilibrium output combination.
Alt text for Figure 2.1: In figure 2.1, a graph compares roadsters and S U Vs.Long description for Figure 2.1: The x-axis is labelled, S U Vs, and the y-axis is labelled, roadsters.3 points A, B, and C are plotted on the graph.A concave curve is drawn between the y-axis and the x-axis, from near the top of the y-axis, to near the end of the y-axis.Near the mid-point of the curve, it passes through point B.Point A is between the curve and the origin, and point C is outside the curve, midway along the x-axis and near the top of the y-axis.
Refer to Figure 2.1.Point C is
A)technically efficient.
B)unattainable with current resources.
C)inefficient in that not all resources are being used.
D)is the equilibrium output combination.
Unlock Deck
Unlock for access to all 314 flashcards in this deck.
Unlock Deck
k this deck
9
Figure 2.1 Alt text for Figure 2.1: In figure 2.1, a graph compares roadsters and S U Vs.
Long description for Figure 2.1: The x-axis is labelled, S U Vs, and the y-axis is labelled, roadsters.3 points A, B, and C are plotted on the graph.A concave curve is drawn between the y-axis and the x-axis, from near the top of the y-axis, to near the end of the y-axis.Near the mid-point of the curve, it passes through point B.Point A is between the curve and the origin, and point C is outside the curve, midway along the x-axis and near the top of the y-axis.
Refer to Figure 2.1.Point A is
A)technically efficient.
B)unattainable with current resources.
C)inefficient in that not all resources are being used.
D)the equilibrium output combination.
Alt text for Figure 2.1: In figure 2.1, a graph compares roadsters and S U Vs.Long description for Figure 2.1: The x-axis is labelled, S U Vs, and the y-axis is labelled, roadsters.3 points A, B, and C are plotted on the graph.A concave curve is drawn between the y-axis and the x-axis, from near the top of the y-axis, to near the end of the y-axis.Near the mid-point of the curve, it passes through point B.Point A is between the curve and the origin, and point C is outside the curve, midway along the x-axis and near the top of the y-axis.
Refer to Figure 2.1.Point A is
A)technically efficient.
B)unattainable with current resources.
C)inefficient in that not all resources are being used.
D)the equilibrium output combination.
Unlock Deck
Unlock for access to all 314 flashcards in this deck.
Unlock Deck
k this deck
10
Figure 2.2 Figure 2.2 above shows the production possibilities frontier for Atikamekw Cree (ca.1600)with a historical tradition of fishing and farming.Assume they produce two goods: fish and grains.
Alt text for Figure 2.2: In figure 2.2, a graph compares production of grains and fish.
Long description for Figure 2.2: The x-axis is labelled, grains in kilograms, and the y-axis is labelled, fish in kilograms.The x-axis is marked from 0 to 180, in increments of 20.The y-axis is marked from 0 to 140, in increments of 20.A line slopes down from the point 0, 120 to the point 160, 0.
Refer to Figure 2.2.What is the opportunity cost of one kilogram of Fish?
A) kilogram of grain
B) kilograms of grain
C)1)6 kilograms of grain
D)16 kilograms of grain
Figure 2.2 above shows the production possibilities frontier for Atikamekw Cree (ca.1600)with a historical tradition of fishing and farming.Assume they produce two goods: fish and grains.Alt text for Figure 2.2: In figure 2.2, a graph compares production of grains and fish.
Long description for Figure 2.2: The x-axis is labelled, grains in kilograms, and the y-axis is labelled, fish in kilograms.The x-axis is marked from 0 to 180, in increments of 20.The y-axis is marked from 0 to 140, in increments of 20.A line slopes down from the point 0, 120 to the point 160, 0.
Refer to Figure 2.2.What is the opportunity cost of one kilogram of Fish?
A)
kilogram of grainB)
kilograms of grainC)1)6 kilograms of grain
D)16 kilograms of grain
Unlock Deck
Unlock for access to all 314 flashcards in this deck.
Unlock Deck
k this deck
11
The points outside the production possibilities frontier are
A)efficient.
B)attainable.
C)inefficient.
D)unattainable.
A)efficient.
B)attainable.
C)inefficient.
D)unattainable.
Unlock Deck
Unlock for access to all 314 flashcards in this deck.
Unlock Deck
k this deck
12
The production possibilities frontier shows the ________ combinations of two products that may be produced in a particular time period with available resources.
A)minimum attainable
B)maximum attainable
C)only
D)equitable
A)minimum attainable
B)maximum attainable
C)only
D)equitable
Unlock Deck
Unlock for access to all 314 flashcards in this deck.
Unlock Deck
k this deck
13
Figure 2.2 Figure 2.2 above shows the production possibilities frontier for Atikamekw Cree (ca.1600)with a historical tradition of fishing and farming.Assume they produce two goods: fish and grains.
Alt text for Figure 2.2: In figure 2.2, a graph compares production of grains and fish.
Long description for Figure 2.2: The x-axis is labelled, grains in kilograms, and the y-axis is labelled, fish in kilograms.The x-axis is marked from 0 to 180, in increments of 20.The y-axis is marked from 0 to 140, in increments of 20.A line slopes down from the point 0, 120 to the point 160, 0.
Refer to Figure 2.2.What is the opportunity cost of one kilogram of grain?
A) kilograms of fish
B)1)2 kilograms of fish
C) kilograms of fish
D)12 kilograms of fish
Figure 2.2 above shows the production possibilities frontier for Atikamekw Cree (ca.1600)with a historical tradition of fishing and farming.Assume they produce two goods: fish and grains.Alt text for Figure 2.2: In figure 2.2, a graph compares production of grains and fish.
Long description for Figure 2.2: The x-axis is labelled, grains in kilograms, and the y-axis is labelled, fish in kilograms.The x-axis is marked from 0 to 180, in increments of 20.The y-axis is marked from 0 to 140, in increments of 20.A line slopes down from the point 0, 120 to the point 160, 0.
Refer to Figure 2.2.What is the opportunity cost of one kilogram of grain?
A)
kilograms of fishB)1)2 kilograms of fish
C)
kilograms of fishD)12 kilograms of fish
Unlock Deck
Unlock for access to all 314 flashcards in this deck.
Unlock Deck
k this deck
14
Figure 2.2 Figure 2.2 above shows the production possibilities frontier for Atikamekw Cree (ca.1600)with a historical tradition of fishing and farming.Assume they produce two goods: fish and grains.
Alt text for Figure 2.2: In figure 2.2, a graph compares production of grains and fish.
Long description for Figure 2.2: The x-axis is labelled, grains in kilograms, and the y-axis is labelled, fish in kilograms.The x-axis is marked from 0 to 180, in increments of 20.The y-axis is marked from 0 to 140, in increments of 20.A line slopes down from the point 0, 120 to the point 160, 0.
Refer to Figure 2.2.Suppose Atikamekw Cree are currently producing 60 kilograms of grain per period.How much fish is it also producing, assuming that resources are fully utilized?
A)45 kilograms of fish
B)75 kilograms of fish
C)80 kilograms of fish
D)100 kilograms of fish
Figure 2.2 above shows the production possibilities frontier for Atikamekw Cree (ca.1600)with a historical tradition of fishing and farming.Assume they produce two goods: fish and grains.Alt text for Figure 2.2: In figure 2.2, a graph compares production of grains and fish.
Long description for Figure 2.2: The x-axis is labelled, grains in kilograms, and the y-axis is labelled, fish in kilograms.The x-axis is marked from 0 to 180, in increments of 20.The y-axis is marked from 0 to 140, in increments of 20.A line slopes down from the point 0, 120 to the point 160, 0.
Refer to Figure 2.2.Suppose Atikamekw Cree are currently producing 60 kilograms of grain per period.How much fish is it also producing, assuming that resources are fully utilized?
A)45 kilograms of fish
B)75 kilograms of fish
C)80 kilograms of fish
D)100 kilograms of fish
Unlock Deck
Unlock for access to all 314 flashcards in this deck.
Unlock Deck
k this deck
15
Figure 2.2 Figure 2.2 above shows the production possibilities frontier for Atikamekw Cree (ca.1600)with a historical tradition of fishing and farming.Assume they produce two goods: fish and grains.
Alt text for Figure 2.2: In figure 2.2, a graph compares production of grains and fish.
Long description for Figure 2.2: The x-axis is labelled, grains in kilograms, and the y-axis is labelled, fish in kilograms.The x-axis is marked from 0 to 180, in increments of 20.The y-axis is marked from 0 to 140, in increments of 20.A line slopes down from the point 0, 120 to the point 160, 0.
Refer to Figure 2.2.The linear production possibilities frontier in the figure indicates that
A)Atikamekw Cree have a comparative advantage in the production of vegetables.
B)Atikamekw Cree have a comparative disadvantage in the production of meat.
C)the trade-off between producing fish and grain is constant.
D)it is progressively more expensive to produce fish.
Figure 2.2 above shows the production possibilities frontier for Atikamekw Cree (ca.1600)with a historical tradition of fishing and farming.Assume they produce two goods: fish and grains.Alt text for Figure 2.2: In figure 2.2, a graph compares production of grains and fish.
Long description for Figure 2.2: The x-axis is labelled, grains in kilograms, and the y-axis is labelled, fish in kilograms.The x-axis is marked from 0 to 180, in increments of 20.The y-axis is marked from 0 to 140, in increments of 20.A line slopes down from the point 0, 120 to the point 160, 0.
Refer to Figure 2.2.The linear production possibilities frontier in the figure indicates that
A)Atikamekw Cree have a comparative advantage in the production of vegetables.
B)Atikamekw Cree have a comparative disadvantage in the production of meat.
C)the trade-off between producing fish and grain is constant.
D)it is progressively more expensive to produce fish.
Unlock Deck
Unlock for access to all 314 flashcards in this deck.
Unlock Deck
k this deck
16
If the production possibilities frontier is ________, then opportunity costs are constant as more of one good is produced.
A)bowed out
B)bowed in
C)nonlinear
D)linear
A)bowed out
B)bowed in
C)nonlinear
D)linear
Unlock Deck
Unlock for access to all 314 flashcards in this deck.
Unlock Deck
k this deck
17
The attainable production points on a production possibility curve are
A)the horizontal and vertical intercepts.
B)the points along the production possibilities frontier.
C)the points outside the area enclosed by the production possibilities frontier.
D)the points along and inside the production possibility frontier.
A)the horizontal and vertical intercepts.
B)the points along the production possibilities frontier.
C)the points outside the area enclosed by the production possibilities frontier.
D)the points along and inside the production possibility frontier.
Unlock Deck
Unlock for access to all 314 flashcards in this deck.
Unlock Deck
k this deck
18
The production possibilities frontier model shows that
A)if consumers decide to buy more of a product its price will increase.
B)a market economy is more efficient in producing goods and services than is a centrally planned economy.
C)economic growth can only be achieved by free market economies.
D)if all resources are fully and efficiently utilized, more of one good can be produced only by producing less of another good.
Unlock Deck
Unlock for access to all 314 flashcards in this deck.
Unlock Deck
k this deck
19
Scarcity
A)stems from the incompatibility between limited resources and unlimited wants.
B)can be overcome by discovering new resources.
C)can be eliminated by rationing products.
D)is a bigger problem in market economies than in socialist economies.
A)stems from the incompatibility between limited resources and unlimited wants.
B)can be overcome by discovering new resources.
C)can be eliminated by rationing products.
D)is a bigger problem in market economies than in socialist economies.
Unlock Deck
Unlock for access to all 314 flashcards in this deck.
Unlock Deck
k this deck
20
Figure 2.1 Alt text for Figure 2.1: In figure 2.1, a graph compares roadsters and S U Vs.
Long description for Figure 2.1: The x-axis is labelled, S U Vs, and the y-axis is labelled, roadsters.3 points A, B, and C are plotted on the graph.A concave curve is drawn between the y-axis and the x-axis, from near the top of the y-axis, to near the end of the y-axis.Near the mid-point of the curve, it passes through point B.Point A is between the curve and the origin, and point C is outside the curve, midway along the x-axis and near the top of the y-axis.
Refer to Figure 2.1.Point B is
A)technically efficient.
B)unattainable with current resources.
C)inefficient in that not all resources are being used.
D)the equilibrium output combination.
Alt text for Figure 2.1: In figure 2.1, a graph compares roadsters and S U Vs.Long description for Figure 2.1: The x-axis is labelled, S U Vs, and the y-axis is labelled, roadsters.3 points A, B, and C are plotted on the graph.A concave curve is drawn between the y-axis and the x-axis, from near the top of the y-axis, to near the end of the y-axis.Near the mid-point of the curve, it passes through point B.Point A is between the curve and the origin, and point C is outside the curve, midway along the x-axis and near the top of the y-axis.
Refer to Figure 2.1.Point B is
A)technically efficient.
B)unattainable with current resources.
C)inefficient in that not all resources are being used.
D)the equilibrium output combination.
Unlock Deck
Unlock for access to all 314 flashcards in this deck.
Unlock Deck
k this deck
21
An outward shift of a nation's production possibilities frontier represents
A)economic growth.
B)rising prices of the two goods on the production possibilities frontier model.
C)an impossible situation.
D)a situation in which a country produces more of one good and less of another.
A)economic growth.
B)rising prices of the two goods on the production possibilities frontier model.
C)an impossible situation.
D)a situation in which a country produces more of one good and less of another.
Unlock Deck
Unlock for access to all 314 flashcards in this deck.
Unlock Deck
k this deck
22
Table 2.1
Production choices for Tomaso's Trattoria
Refer to Table 2.1.Assume Tomaso's Trattoria only produces pizzas and calzones.A combination of 24 pizzas and 15 calzones would appear
A)along Tomaso's production possibilities frontier.
B)inside Tomaso's production possibilities frontier.
C)outside Tomaso's production possibilities frontier.
D)at the horizontal intercept of Tomaso's production possibilities frontier.
Unlock Deck
Unlock for access to all 314 flashcards in this deck.
Unlock Deck
k this deck
23
Without an increase in the supplies of factors of production, how can a nation achieve economic growth?
A)by producing more high-value goods and less of low-value goods
B)through technological advancement which enables more output with the same quantity of resources
C)by lowering the prices of factors of production
D)by increasing the prices of factors of production
A)by producing more high-value goods and less of low-value goods
B)through technological advancement which enables more output with the same quantity of resources
C)by lowering the prices of factors of production
D)by increasing the prices of factors of production
Unlock Deck
Unlock for access to all 314 flashcards in this deck.
Unlock Deck
k this deck
24
The slope of a production possibilities frontier
A)has no economic relevance or meaning.
B)is always constant.
C)is always varying.
D)measures the opportunity cost of producing one more unit of a good.
A)has no economic relevance or meaning.
B)is always constant.
C)is always varying.
D)measures the opportunity cost of producing one more unit of a good.
Unlock Deck
Unlock for access to all 314 flashcards in this deck.
Unlock Deck
k this deck
25
Table 2.1
Production choices for Tomaso's Trattoria
Refer to Table 2.1.Assume Tomaso's Trattoria only produces pizzas and calzones.Tomaso faces ________ opportunity costs in the production of pizzas and calzones.
A)increasing
B)decreasing
C)constant
D)negative
Production choices for Tomaso's Trattoria
Refer to Table 2.1.Assume Tomaso's Trattoria only produces pizzas and calzones.Tomaso faces ________ opportunity costs in the production of pizzas and calzones.
A)increasing
B)decreasing
C)constant
D)negative
Unlock Deck
Unlock for access to all 314 flashcards in this deck.
Unlock Deck
k this deck
26
Figure 2.4 Figure 2.4 shows various points on three different production possibilities frontiers for a nation.
Alt text for Figure 2.4: In figure 2.4, a graph illustrates 3 different production possibilities.
Long description for Figure 2.4: The x-axis is labelled, plastic products, and the y-axis is labelled, food products.3 convex curves are shown, with points V, W, X, Y, and Z plotted.The first curve begins just past the half-way point on the y-axis, and ends just past the half-way point on the x-axis.Points W and X are plotted along the curve, with point W approximately 1 third of the way from the start of the curve, and point X more than 2 thirds of the way along the curve.The second curve begins almost 3 quarters of the way up the y-axis and ends just past the termination of the first curve on the x-axis.Point Y is plotted on the second curve, approximately 2 thirds of the way along the curve.The third curve begins at the same point as the second curve, and ends approximately 3 quarters of the way along the x-axis.Point Z is plotted on the third curve, a little less than half-way along the curve.Point V is plotted between the first curve and the origin.
Refer to Figure 2.4.Consider the following events: a.an increase in the unemployment rate
b.a decrease in a nation's money supply
c.a war that kills a significant portion of a nation's population
Which of the events listed above could cause a movement from Y to W ?
A)a, b and c
B)a and b only
C)a and c only
D)a only
E)c only
Figure 2.4 shows various points on three different production possibilities frontiers for a nation.Alt text for Figure 2.4: In figure 2.4, a graph illustrates 3 different production possibilities.
Long description for Figure 2.4: The x-axis is labelled, plastic products, and the y-axis is labelled, food products.3 convex curves are shown, with points V, W, X, Y, and Z plotted.The first curve begins just past the half-way point on the y-axis, and ends just past the half-way point on the x-axis.Points W and X are plotted along the curve, with point W approximately 1 third of the way from the start of the curve, and point X more than 2 thirds of the way along the curve.The second curve begins almost 3 quarters of the way up the y-axis and ends just past the termination of the first curve on the x-axis.Point Y is plotted on the second curve, approximately 2 thirds of the way along the curve.The third curve begins at the same point as the second curve, and ends approximately 3 quarters of the way along the x-axis.Point Z is plotted on the third curve, a little less than half-way along the curve.Point V is plotted between the first curve and the origin.
Refer to Figure 2.4.Consider the following events: a.an increase in the unemployment rate
b.a decrease in a nation's money supply
c.a war that kills a significant portion of a nation's population
Which of the events listed above could cause a movement from Y to W ?
A)a, b and c
B)a and b only
C)a and c only
D)a only
E)c only
Unlock Deck
Unlock for access to all 314 flashcards in this deck.
Unlock Deck
k this deck
27
Figure 2.3 Alt text for Figure 2.3: In figure 2.3, 3 graphs, A, B and C comparing production of cattle and llamas.
Long description for Figure 2.3: Graph A: the x-axis is labelled, llamas, and y-axis is labelled, cattle.A line slopes down from the top left corner of the quadrant, near the top of the y-axis to the bottom right corner, near the end of the x-axis.Graph B: the x-axis is labelled, llamas, and y-axis is labelled, cattle.A convex curve begins in the top left corner, near the top of the y-axis and ends in the bottom right corner, near the end of the x-axis.Graph C: the x-axis is labelled, llamas, and y-axis is labelled, cattle.A concave curve begins in the top left corner near the top of the y-axis, and ends in the bottom right corner, near the end of the x-axis.
Refer to Figure 2.3.Sergio Vignetto raises cattle and llamas on his land.Half the land is more suitable for raising cattle and half the land is better suited for raising llamas.Which of the graphs in Figure 2.3 represent his production possibilities frontier?
A)Graph A
B)Graph B
C)Graph C
D)either Graph A or Graph C
E)either Graph B or Graph C
Alt text for Figure 2.3: In figure 2.3, 3 graphs, A, B and C comparing production of cattle and llamas.Long description for Figure 2.3: Graph A: the x-axis is labelled, llamas, and y-axis is labelled, cattle.A line slopes down from the top left corner of the quadrant, near the top of the y-axis to the bottom right corner, near the end of the x-axis.Graph B: the x-axis is labelled, llamas, and y-axis is labelled, cattle.A convex curve begins in the top left corner, near the top of the y-axis and ends in the bottom right corner, near the end of the x-axis.Graph C: the x-axis is labelled, llamas, and y-axis is labelled, cattle.A concave curve begins in the top left corner near the top of the y-axis, and ends in the bottom right corner, near the end of the x-axis.
Refer to Figure 2.3.Sergio Vignetto raises cattle and llamas on his land.Half the land is more suitable for raising cattle and half the land is better suited for raising llamas.Which of the graphs in Figure 2.3 represent his production possibilities frontier?
A)Graph A
B)Graph B
C)Graph C
D)either Graph A or Graph C
E)either Graph B or Graph C
Unlock Deck
Unlock for access to all 314 flashcards in this deck.
Unlock Deck
k this deck
28
________ opportunity cost implies that as more resources are applied to producing one good, that production increases by smaller and smaller amounts.
A)Increasing
B)Decreasing
C)Constant
D)Negative
A)Increasing
B)Decreasing
C)Constant
D)Negative
Unlock Deck
Unlock for access to all 314 flashcards in this deck.
Unlock Deck
k this deck
29
Economic decline (negative growth)is represented on a production possibilities frontier model by the production possibility frontier
A)shifting outward.
B)shifting inward.
C)becoming steeper.
D)becoming flatter.
A)shifting outward.
B)shifting inward.
C)becoming steeper.
D)becoming flatter.
Unlock Deck
Unlock for access to all 314 flashcards in this deck.
Unlock Deck
k this deck
30
Figure 2.4 Figure 2.4 shows various points on three different production possibilities frontiers for a nation.
Alt text for Figure 2.4: In figure 2.4, a graph illustrates 3 different production possibilities.
Long description for Figure 2.4: The x-axis is labelled, plastic products, and the y-axis is labelled, food products.3 convex curves are shown, with points V, W, X, Y, and Z plotted.The first curve begins just past the half-way point on the y-axis, and ends just past the half-way point on the x-axis.Points W and X are plotted along the curve, with point W approximately 1 third of the way from the start of the curve, and point X more than 2 thirds of the way along the curve.The second curve begins almost 3 quarters of the way up the y-axis and ends just past the termination of the first curve on the x-axis.Point Y is plotted on the second curve, approximately 2 thirds of the way along the curve.The third curve begins at the same point as the second curve, and ends approximately 3 quarters of the way along the x-axis.Point Z is plotted on the third curve, a little less than half-way along the curve.Point V is plotted between the first curve and the origin.
Refer to Figure 2.4.A movement from Y to Z
A)represents an increase in the demand for plastic products.
B)could occur because of general technological advancements.
C)is the result of advancements in food production technology.
D)is the result of advancements in plastic production technology.
Figure 2.4 shows various points on three different production possibilities frontiers for a nation.Alt text for Figure 2.4: In figure 2.4, a graph illustrates 3 different production possibilities.
Long description for Figure 2.4: The x-axis is labelled, plastic products, and the y-axis is labelled, food products.3 convex curves are shown, with points V, W, X, Y, and Z plotted.The first curve begins just past the half-way point on the y-axis, and ends just past the half-way point on the x-axis.Points W and X are plotted along the curve, with point W approximately 1 third of the way from the start of the curve, and point X more than 2 thirds of the way along the curve.The second curve begins almost 3 quarters of the way up the y-axis and ends just past the termination of the first curve on the x-axis.Point Y is plotted on the second curve, approximately 2 thirds of the way along the curve.The third curve begins at the same point as the second curve, and ends approximately 3 quarters of the way along the x-axis.Point Z is plotted on the third curve, a little less than half-way along the curve.Point V is plotted between the first curve and the origin.
Refer to Figure 2.4.A movement from Y to Z
A)represents an increase in the demand for plastic products.
B)could occur because of general technological advancements.
C)is the result of advancements in food production technology.
D)is the result of advancements in plastic production technology.
Unlock Deck
Unlock for access to all 314 flashcards in this deck.
Unlock Deck
k this deck
31
Which of the following would shift a nation's production possibilities frontier outward?
A)developing solar power that is more efficient than all other methods of generating electricity.
B)an increase in demand for the nation's products
C)a decrease in the unemployment rate
D)a law requiring workers to retire at age 50
A)developing solar power that is more efficient than all other methods of generating electricity.
B)an increase in demand for the nation's products
C)a decrease in the unemployment rate
D)a law requiring workers to retire at age 50
Unlock Deck
Unlock for access to all 314 flashcards in this deck.
Unlock Deck
k this deck
32
Table 2.1
Production choices for Tomaso's Trattoria
Refer to Table 2.1.Assume Tomaso's Trattoria only produces pizzas and calzones.A combination of 36 pizzas and 30 calzones would appear
A)along Tomaso's production possibilities frontier.
B)inside Tomaso's production possibilities frontier.
C)outside Tomaso's production possibilities frontier.
D)at the horizontal intercept of Tomaso's production possibilities frontier.
Unlock Deck
Unlock for access to all 314 flashcards in this deck.
Unlock Deck
k this deck
33
Figure 2.4 Figure 2.4 shows various points on three different production possibilities frontiers for a nation.
Alt text for Figure 2.4: In figure 2.4, a graph illustrates 3 different production possibilities.
Long description for Figure 2.4: The x-axis is labelled, plastic products, and the y-axis is labelled, food products.3 convex curves are shown, with points V, W, X, Y, and Z plotted.The first curve begins just past the half-way point on the y-axis, and ends just past the half-way point on the x-axis.Points W and X are plotted along the curve, with point W approximately 1 third of the way from the start of the curve, and point X more than 2 thirds of the way along the curve.The second curve begins almost 3 quarters of the way up the y-axis and ends just past the termination of the first curve on the x-axis.Point Y is plotted on the second curve, approximately 2 thirds of the way along the curve.The third curve begins at the same point as the second curve, and ends approximately 3 quarters of the way along the x-axis.Point Z is plotted on the third curve, a little less than half-way along the curve.Point V is plotted between the first curve and the origin.
Refer to Figure 2.4.Consider the following events: a.a decrease in the unemployment rate
B.general technological advancement
C.an increase in consumer wealth
Which of the events listed above could cause a movement from V to W ?
A)a only
B)a and b only
C)b and c only
D)a, b, and c
Figure 2.4 shows various points on three different production possibilities frontiers for a nation.Alt text for Figure 2.4: In figure 2.4, a graph illustrates 3 different production possibilities.
Long description for Figure 2.4: The x-axis is labelled, plastic products, and the y-axis is labelled, food products.3 convex curves are shown, with points V, W, X, Y, and Z plotted.The first curve begins just past the half-way point on the y-axis, and ends just past the half-way point on the x-axis.Points W and X are plotted along the curve, with point W approximately 1 third of the way from the start of the curve, and point X more than 2 thirds of the way along the curve.The second curve begins almost 3 quarters of the way up the y-axis and ends just past the termination of the first curve on the x-axis.Point Y is plotted on the second curve, approximately 2 thirds of the way along the curve.The third curve begins at the same point as the second curve, and ends approximately 3 quarters of the way along the x-axis.Point Z is plotted on the third curve, a little less than half-way along the curve.Point V is plotted between the first curve and the origin.
Refer to Figure 2.4.Consider the following events: a.a decrease in the unemployment rate
B.general technological advancement
C.an increase in consumer wealth
Which of the events listed above could cause a movement from V to W ?
A)a only
B)a and b only
C)b and c only
D)a, b, and c
Unlock Deck
Unlock for access to all 314 flashcards in this deck.
Unlock Deck
k this deck
34
Figure 2.3 Alt text for Figure 2.3: In figure 2.3, 3 graphs, A, B and C comparing production of cattle and llamas.
Long description for Figure 2.3: Graph A: the x-axis is labelled, llamas, and y-axis is labelled, cattle.A line slopes down from the top left corner of the quadrant, near the top of the y-axis to the bottom right corner, near the end of the x-axis.Graph B: the x-axis is labelled, llamas, and y-axis is labelled, cattle.A convex curve begins in the top left corner, near the top of the y-axis and ends in the bottom right corner, near the end of the x-axis.Graph C: the x-axis is labelled, llamas, and y-axis is labelled, cattle.A concave curve begins in the top left corner near the top of the y-axis, and ends in the bottom right corner, near the end of the x-axis.
Refer to Figure 2.3.Sergio Vignetto raises cattle and llamas on his land.His land is equally suitable for raising either animal.Which of the graphs in Figure 2.3 represent his production possibilities frontier?
A)Graph A
B)Graph B
C)Graph C
D)either Graph A or Graph C
E)either Graph B or Graph C
Alt text for Figure 2.3: In figure 2.3, 3 graphs, A, B and C comparing production of cattle and llamas.Long description for Figure 2.3: Graph A: the x-axis is labelled, llamas, and y-axis is labelled, cattle.A line slopes down from the top left corner of the quadrant, near the top of the y-axis to the bottom right corner, near the end of the x-axis.Graph B: the x-axis is labelled, llamas, and y-axis is labelled, cattle.A convex curve begins in the top left corner, near the top of the y-axis and ends in the bottom right corner, near the end of the x-axis.Graph C: the x-axis is labelled, llamas, and y-axis is labelled, cattle.A concave curve begins in the top left corner near the top of the y-axis, and ends in the bottom right corner, near the end of the x-axis.
Refer to Figure 2.3.Sergio Vignetto raises cattle and llamas on his land.His land is equally suitable for raising either animal.Which of the graphs in Figure 2.3 represent his production possibilities frontier?
A)Graph A
B)Graph B
C)Graph C
D)either Graph A or Graph C
E)either Graph B or Graph C
Unlock Deck
Unlock for access to all 314 flashcards in this deck.
Unlock Deck
k this deck
35
Figure 2.4 Figure 2.4 shows various points on three different production possibilities frontiers for a nation.
Alt text for Figure 2.4: In figure 2.4, a graph illustrates 3 different production possibilities.
Long description for Figure 2.4: The x-axis is labelled, plastic products, and the y-axis is labelled, food products.3 convex curves are shown, with points V, W, X, Y, and Z plotted.The first curve begins just past the half-way point on the y-axis, and ends just past the half-way point on the x-axis.Points W and X are plotted along the curve, with point W approximately 1 third of the way from the start of the curve, and point X more than 2 thirds of the way along the curve.The second curve begins almost 3 quarters of the way up the y-axis and ends just past the termination of the first curve on the x-axis.Point Y is plotted on the second curve, approximately 2 thirds of the way along the curve.The third curve begins at the same point as the second curve, and ends approximately 3 quarters of the way along the x-axis.Point Z is plotted on the third curve, a little less than half-way along the curve.Point V is plotted between the first curve and the origin.
Refer to Figure 2.4.Consider the following movements:
a.from point V to point W
b.from point W to point Y
c.from point Y to point Z
Which of the movements listed above represents economic growth?
A)a, b, and c
B)b and c only
C)a only
D)b only
Figure 2.4 shows various points on three different production possibilities frontiers for a nation.Alt text for Figure 2.4: In figure 2.4, a graph illustrates 3 different production possibilities.
Long description for Figure 2.4: The x-axis is labelled, plastic products, and the y-axis is labelled, food products.3 convex curves are shown, with points V, W, X, Y, and Z plotted.The first curve begins just past the half-way point on the y-axis, and ends just past the half-way point on the x-axis.Points W and X are plotted along the curve, with point W approximately 1 third of the way from the start of the curve, and point X more than 2 thirds of the way along the curve.The second curve begins almost 3 quarters of the way up the y-axis and ends just past the termination of the first curve on the x-axis.Point Y is plotted on the second curve, approximately 2 thirds of the way along the curve.The third curve begins at the same point as the second curve, and ends approximately 3 quarters of the way along the x-axis.Point Z is plotted on the third curve, a little less than half-way along the curve.Point V is plotted between the first curve and the origin.
Refer to Figure 2.4.Consider the following movements:
a.from point V to point W
b.from point W to point Y
c.from point Y to point Z
Which of the movements listed above represents economic growth?
A)a, b, and c
B)b and c only
C)a only
D)b only
Unlock Deck
Unlock for access to all 314 flashcards in this deck.
Unlock Deck
k this deck
36
Table 2.1
Production choices for Tomaso's Trattoria
Refer to Table 2.1.Assume Tomaso's Trattoria only produces pizzas and calzones.A combination of 24 pizzas and 30 calzones would appear
A)along Tomaso's production possibilities frontier.
B)inside Tomaso's production possibilities frontier.
C)outside Tomaso's production possibilities frontier.
D)at the horizontal intercept of Tomaso's production possibilities frontier.
Unlock Deck
Unlock for access to all 314 flashcards in this deck.
Unlock Deck
k this deck
37
Increasing opportunity cost is represented by a ________ production possibilities frontier.
A)linear
B)convex
C)concave
D)vertical
A)linear
B)convex
C)concave
D)vertical
Unlock Deck
Unlock for access to all 314 flashcards in this deck.
Unlock Deck
k this deck
38
An inward shift of a nation's production possibilities frontier can occur due to
A)a reduction in unemployment.
B)a natural disaster like a hurricane or bad earthquake.
C)a change in the amounts of one good desired.
D)an increase in the labour force.
A)a reduction in unemployment.
B)a natural disaster like a hurricane or bad earthquake.
C)a change in the amounts of one good desired.
D)an increase in the labour force.
Unlock Deck
Unlock for access to all 314 flashcards in this deck.
Unlock Deck
k this deck
39
If opportunity costs are constant, the production possibilities frontier would be graphed as
A)a ray from the origin.
B)a positively sloped straight line.
C)a negatively sloped curve bowed in toward the origin.
D)a negatively sloped straight line.
A)a ray from the origin.
B)a positively sloped straight line.
C)a negatively sloped curve bowed in toward the origin.
D)a negatively sloped straight line.
Unlock Deck
Unlock for access to all 314 flashcards in this deck.
Unlock Deck
k this deck
40
Figure 2.4 Figure 2.4 shows various points on three different production possibilities frontiers for a nation.
Alt text for Figure 2.4: In figure 2.4, a graph illustrates 3 different production possibilities.
Long description for Figure 2.4: The x-axis is labelled, plastic products, and the y-axis is labelled, food products.3 convex curves are shown, with points V, W, X, Y, and Z plotted.The first curve begins just past the half-way point on the y-axis, and ends just past the half-way point on the x-axis.Points W and X are plotted along the curve, with point W approximately 1 third of the way from the start of the curve, and point X more than 2 thirds of the way along the curve.The second curve begins almost 3 quarters of the way up the y-axis and ends just past the termination of the first curve on the x-axis.Point Y is plotted on the second curve, approximately 2 thirds of the way along the curve.The third curve begins at the same point as the second curve, and ends approximately 3 quarters of the way along the x-axis.Point Z is plotted on the third curve, a little less than half-way along the curve.Point V is plotted between the first curve and the origin.
Refer to Figure 2.4.A movement from X to Y
A)could be due to a change in consumers' tastes and preferences.
B)could occur because of an influx of immigrant labour.
C)is the result of advancements in food production technology only, with no change in the technology for plastic production.
D)is the result of advancements in plastic production technology only, with no change in food production technology.
Figure 2.4 shows various points on three different production possibilities frontiers for a nation.Alt text for Figure 2.4: In figure 2.4, a graph illustrates 3 different production possibilities.
Long description for Figure 2.4: The x-axis is labelled, plastic products, and the y-axis is labelled, food products.3 convex curves are shown, with points V, W, X, Y, and Z plotted.The first curve begins just past the half-way point on the y-axis, and ends just past the half-way point on the x-axis.Points W and X are plotted along the curve, with point W approximately 1 third of the way from the start of the curve, and point X more than 2 thirds of the way along the curve.The second curve begins almost 3 quarters of the way up the y-axis and ends just past the termination of the first curve on the x-axis.Point Y is plotted on the second curve, approximately 2 thirds of the way along the curve.The third curve begins at the same point as the second curve, and ends approximately 3 quarters of the way along the x-axis.Point Z is plotted on the third curve, a little less than half-way along the curve.Point V is plotted between the first curve and the origin.
Refer to Figure 2.4.A movement from X to Y
A)could be due to a change in consumers' tastes and preferences.
B)could occur because of an influx of immigrant labour.
C)is the result of advancements in food production technology only, with no change in the technology for plastic production.
D)is the result of advancements in plastic production technology only, with no change in food production technology.
Unlock Deck
Unlock for access to all 314 flashcards in this deck.
Unlock Deck
k this deck
41
Figure 2.4 Figure 2.4 shows various points on three different production possibilities frontiers for a nation.
Alt text for Figure 2.4: In figure 2.4, a graph illustrates 3 different production possibilities.
Long description for Figure 2.4: The x-axis is labelled, plastic products, and the y-axis is labelled, food products.3 convex curves are shown, with points V, W, X, Y, and Z plotted.The first curve begins just past the half-way point on the y-axis, and ends just past the half-way point on the x-axis.Points W and X are plotted along the curve, with point W approximately 1 third of the way from the start of the curve, and point X more than 2 thirds of the way along the curve.The second curve begins almost 3 quarters of the way up the y-axis and ends just past the termination of the first curve on the x-axis.Point Y is plotted on the second curve, approximately 2 thirds of the way along the curve.The third curve begins at the same point as the second curve, and ends approximately 3 quarters of the way along the x-axis.Point Z is plotted on the third curve, a little less than half-way along the curve.Point V is plotted between the first curve and the origin.
Refer to Figure 2.4.Consider the following events: a. a reduction in the patent protection period to no more than 2 years
b. a war that destroys a substantial portion of a nation's capital stock
c. the lack of secure and enforceable property rights system
Which of the events listed above could cause a movement from W to V?
A)a only
B)a and b only
C)a and c only
D)b and c only
E)a, b, and c
Figure 2.4 shows various points on three different production possibilities frontiers for a nation.Alt text for Figure 2.4: In figure 2.4, a graph illustrates 3 different production possibilities.
Long description for Figure 2.4: The x-axis is labelled, plastic products, and the y-axis is labelled, food products.3 convex curves are shown, with points V, W, X, Y, and Z plotted.The first curve begins just past the half-way point on the y-axis, and ends just past the half-way point on the x-axis.Points W and X are plotted along the curve, with point W approximately 1 third of the way from the start of the curve, and point X more than 2 thirds of the way along the curve.The second curve begins almost 3 quarters of the way up the y-axis and ends just past the termination of the first curve on the x-axis.Point Y is plotted on the second curve, approximately 2 thirds of the way along the curve.The third curve begins at the same point as the second curve, and ends approximately 3 quarters of the way along the x-axis.Point Z is plotted on the third curve, a little less than half-way along the curve.Point V is plotted between the first curve and the origin.
Refer to Figure 2.4.Consider the following events: a. a reduction in the patent protection period to no more than 2 years
b. a war that destroys a substantial portion of a nation's capital stock
c. the lack of secure and enforceable property rights system
Which of the events listed above could cause a movement from W to V?
A)a only
B)a and b only
C)a and c only
D)b and c only
E)a, b, and c
Unlock Deck
Unlock for access to all 314 flashcards in this deck.
Unlock Deck
k this deck
42
Suppose there is no unemployment in the economy and society decides that it wants more of one good.Which of the following statements is true?
A)It can only achieve this with an advance in technology.
B)It can increase output without giving up another good.
C)It can only achieve this with an increase in resource supplies.
D)It will have to give up production and consumption of some other good.
A)It can only achieve this with an advance in technology.
B)It can increase output without giving up another good.
C)It can only achieve this with an increase in resource supplies.
D)It will have to give up production and consumption of some other good.
Unlock Deck
Unlock for access to all 314 flashcards in this deck.
Unlock Deck
k this deck
43
Figure 2.5 Alt text for Figure 2.5: In figure 2.5, a graph compares paper and steel production.
Long description for Figure 2.5: The x-axis is labelled, steel in millions of tons and the quantities 14, 16, 19, and 20 are marked.The y-axis is labelled, paper in millions of tons, and the quantities 4, 9, and 11 are marked.Points Y(14, 9), W(16, 9), (19, 4), and an unnamed point (14, 11)are plotted on the graph, and joined to the respective axes using dotted lines.A concave curve is drawn from the y-axis to the x-axis, passing through the unnamed point (14, 11), and points W(16, 9), and X(19, 4).Point Y is between the curve and the axes.
Refer to Figure 2.5. If this economy is currently considering switching from point X to point W, what is the opportunity cost of each newly produced ton of paper?
A)0)6 tons of steel
B)3 tons of steel
C)1)67 tons of paper
D)5 tons of paper.
Alt text for Figure 2.5: In figure 2.5, a graph compares paper and steel production.Long description for Figure 2.5: The x-axis is labelled, steel in millions of tons and the quantities 14, 16, 19, and 20 are marked.The y-axis is labelled, paper in millions of tons, and the quantities 4, 9, and 11 are marked.Points Y(14, 9), W(16, 9), (19, 4), and an unnamed point (14, 11)are plotted on the graph, and joined to the respective axes using dotted lines.A concave curve is drawn from the y-axis to the x-axis, passing through the unnamed point (14, 11), and points W(16, 9), and X(19, 4).Point Y is between the curve and the axes.
Refer to Figure 2.5. If this economy is currently considering switching from point X to point W, what is the opportunity cost of each newly produced ton of paper?
A)0)6 tons of steel
B)3 tons of steel
C)1)67 tons of paper
D)5 tons of paper.
Unlock Deck
Unlock for access to all 314 flashcards in this deck.
Unlock Deck
k this deck
44
The federal government supports health care spending through the Canada Health Transfer.As the population ages and the number of people who are over 65 continues to rise, government spending on health care will
A)cause the federal government to go bankrupt within the next 5 years.
B)destabilize the economy and ultimately lead to the creation of new taxes.
C)leave less funding for other government programs, such as education, housing, and infrastructure.
D)start to decrease, as more nurses will be hired instead of doctors which will reduce healthcare costs.
Unlock Deck
Unlock for access to all 314 flashcards in this deck.
Unlock Deck
k this deck
45
Any output combination outside a production possibility frontier is associated with unused or underutilized resources.
Unlock Deck
Unlock for access to all 314 flashcards in this deck.
Unlock Deck
k this deck
46
If a country is producing efficiently and is on the production possibilities frontier, the only way to produce more of one good is to produce less of the other.
Unlock Deck
Unlock for access to all 314 flashcards in this deck.
Unlock Deck
k this deck
47
As provincial governments across Canada face growing budget deficits some analysts caution that rising health care spending could lead to reduced funding for universities and colleges.This statement suggests that
A)Canadian governments never really supported post secondary education.
B)there is a trade-off between healthcare spending and education spending.
C)society should value education spending more highly than healthcare spending.
D)society should value healthcare spending more highly than health care because of the long term economic benefits generated by a healthier population.
Unlock Deck
Unlock for access to all 314 flashcards in this deck.
Unlock Deck
k this deck
48
Figure 2.6 Toyota found the emission standards too difficult to meet to bring its diesel-engine offerings to North America.They have instead focused their research on hybrid-engine technology.Assume Toyota chooses to produce both hybrid-engine vehicles and diesel-engine vehicles (for markets outside North America)for its Prius brand.Figure 2.6 shows changes to its production possibilities frontier in response to new developments and different strategic production decisions.
Alt text for Figure 2.6: In figure 2.6, 3 graphs, A, B and C show the changes to Toyota's production possibilities frontier.
Long description for Figure 2.6: Graph A: The x-axis is labelled, diesel-engine automobiles, and the y-axis is labelled, hybrid-engine automobiles.2 convex curves are shown.The first curve begins slightly above the half-way point of the y-axis and ends near the end of the x-axis.The curve passes through point E about 1 third of the way along the curve.The second curve begins slightly above the first, on the y-axis.It finishes at the exact same point on the x-axis.The second curve passes through point F about 1 third of the way along the curve.Graph B: The x-axis is labelled, diesel-engine automobiles, and the y-axis is labelled hybrid-engine automobiles.2 convex curves are shown.The first curve begins slightly above the half-way mark on the y-axis and finishes about 2 thirds of the way along the x-axis.The curve passes through the point G, about halfway along the curve.The second curve begins slightly above the first on the y-axis, and finishes just past the end of the first on the x-axis.The curve passes through point J about 1 third of the way along the curve, and point H about 3 fourths of the way along the curve.Graph C: The x-axis is labelled, diesel-engine automobiles, and the y-axis is labelled hybrid-engine automobiles.A convex curve begins near the top of the y-axis and finishes near the end of the x-axis.It passes through point K about half-way along the curve.Point L is plotted between the curve and the axes.
Refer to Figure 2.6.Assume that in 2019, after extensive research and development Toyota builds a new factory that can produce both types of vehicles that meet emission standards.This is best represented by the
A)movement from E to F in Graph A.
B)movement from H to J in Graph B.
C)movement from L to K in Graph C.
D)movement from J to G in Graph B.
Toyota found the emission standards too difficult to meet to bring its diesel-engine offerings to North America.They have instead focused their research on hybrid-engine technology.Assume Toyota chooses to produce both hybrid-engine vehicles and diesel-engine vehicles (for markets outside North America)for its Prius brand.Figure 2.6 shows changes to its production possibilities frontier in response to new developments and different strategic production decisions.Alt text for Figure 2.6: In figure 2.6, 3 graphs, A, B and C show the changes to Toyota's production possibilities frontier.
Long description for Figure 2.6: Graph A: The x-axis is labelled, diesel-engine automobiles, and the y-axis is labelled, hybrid-engine automobiles.2 convex curves are shown.The first curve begins slightly above the half-way point of the y-axis and ends near the end of the x-axis.The curve passes through point E about 1 third of the way along the curve.The second curve begins slightly above the first, on the y-axis.It finishes at the exact same point on the x-axis.The second curve passes through point F about 1 third of the way along the curve.Graph B: The x-axis is labelled, diesel-engine automobiles, and the y-axis is labelled hybrid-engine automobiles.2 convex curves are shown.The first curve begins slightly above the half-way mark on the y-axis and finishes about 2 thirds of the way along the x-axis.The curve passes through the point G, about halfway along the curve.The second curve begins slightly above the first on the y-axis, and finishes just past the end of the first on the x-axis.The curve passes through point J about 1 third of the way along the curve, and point H about 3 fourths of the way along the curve.Graph C: The x-axis is labelled, diesel-engine automobiles, and the y-axis is labelled hybrid-engine automobiles.A convex curve begins near the top of the y-axis and finishes near the end of the x-axis.It passes through point K about half-way along the curve.Point L is plotted between the curve and the axes.
Refer to Figure 2.6.Assume that in 2019, after extensive research and development Toyota builds a new factory that can produce both types of vehicles that meet emission standards.This is best represented by the
A)movement from E to F in Graph A.
B)movement from H to J in Graph B.
C)movement from L to K in Graph C.
D)movement from J to G in Graph B.
Unlock Deck
Unlock for access to all 314 flashcards in this deck.
Unlock Deck
k this deck
49
Figure 2.6 Toyota found the emission standards too difficult to meet to bring its diesel-engine offerings to North America.They have instead focused their research on hybrid-engine technology.Assume Toyota chooses to produce both hybrid-engine vehicles and diesel-engine vehicles (for markets outside North America)for its Prius brand.Figure 2.6 shows changes to its production possibilities frontier in response to new developments and different strategic production decisions.
Alt text for Figure 2.6: In figure 2.6, 3 graphs, A, B and C show the changes to Toyota's production possibilities frontier.
Long description for Figure 2.6: Graph A: The x-axis is labelled, diesel-engine automobiles, and the y-axis is labelled, hybrid-engine automobiles.2 convex curves are shown.The first curve begins slightly above the half-way point of the y-axis and ends near the end of the x-axis.The curve passes through point E about 1 third of the way along the curve.The second curve begins slightly above the first, on the y-axis.It finishes at the exact same point on the x-axis.The second curve passes through point F about 1 third of the way along the curve.Graph B: The x-axis is labelled, diesel-engine automobiles, and the y-axis is labelled hybrid-engine automobiles.2 convex curves are shown.The first curve begins slightly above the half-way mark on the y-axis and finishes about 2 thirds of the way along the x-axis.The curve passes through the point G, about halfway along the curve.The second curve begins slightly above the first on the y-axis, and finishes just past the end of the first on the x-axis.The curve passes through point J about 1 third of the way along the curve, and point H about 3 fourths of the way along the curve.Graph C: The x-axis is labelled, diesel-engine automobiles, and the y-axis is labelled hybrid-engine automobiles.A convex curve begins near the top of the y-axis and finishes near the end of the x-axis.It passes through point K about half-way along the curve.Point L is plotted between the curve and the axes.
Refer to Figure 2.6.Assume a technological advancement greatly reduces the cost to produce hybrid-engine vehicles.This is best represented by the
A)movement from E to F in Graph A.
B)movement from G to H in Graph B.
C)movement from K to L in Graph C.
D)movement from H to J in Graph B.
Toyota found the emission standards too difficult to meet to bring its diesel-engine offerings to North America.They have instead focused their research on hybrid-engine technology.Assume Toyota chooses to produce both hybrid-engine vehicles and diesel-engine vehicles (for markets outside North America)for its Prius brand.Figure 2.6 shows changes to its production possibilities frontier in response to new developments and different strategic production decisions.Alt text for Figure 2.6: In figure 2.6, 3 graphs, A, B and C show the changes to Toyota's production possibilities frontier.
Long description for Figure 2.6: Graph A: The x-axis is labelled, diesel-engine automobiles, and the y-axis is labelled, hybrid-engine automobiles.2 convex curves are shown.The first curve begins slightly above the half-way point of the y-axis and ends near the end of the x-axis.The curve passes through point E about 1 third of the way along the curve.The second curve begins slightly above the first, on the y-axis.It finishes at the exact same point on the x-axis.The second curve passes through point F about 1 third of the way along the curve.Graph B: The x-axis is labelled, diesel-engine automobiles, and the y-axis is labelled hybrid-engine automobiles.2 convex curves are shown.The first curve begins slightly above the half-way mark on the y-axis and finishes about 2 thirds of the way along the x-axis.The curve passes through the point G, about halfway along the curve.The second curve begins slightly above the first on the y-axis, and finishes just past the end of the first on the x-axis.The curve passes through point J about 1 third of the way along the curve, and point H about 3 fourths of the way along the curve.Graph C: The x-axis is labelled, diesel-engine automobiles, and the y-axis is labelled hybrid-engine automobiles.A convex curve begins near the top of the y-axis and finishes near the end of the x-axis.It passes through point K about half-way along the curve.Point L is plotted between the curve and the axes.
Refer to Figure 2.6.Assume a technological advancement greatly reduces the cost to produce hybrid-engine vehicles.This is best represented by the
A)movement from E to F in Graph A.
B)movement from G to H in Graph B.
C)movement from K to L in Graph C.
D)movement from H to J in Graph B.
Unlock Deck
Unlock for access to all 314 flashcards in this deck.
Unlock Deck
k this deck
50
A decrease in the unemployment rate may be represented as a movement from a point on the production possibilities frontier to a point outside the frontier.
Unlock Deck
Unlock for access to all 314 flashcards in this deck.
Unlock Deck
k this deck
51
Figure 2.5 Alt text for Figure 2.5: In figure 2.5, a graph compares paper and steel production.
Long description for Figure 2.5: The x-axis is labelled, steel in millions of tons and the quantities 14, 16, 19, and 20 are marked.The y-axis is labelled, paper in millions of tons, and the quantities 4, 9, and 11 are marked.Points Y(14, 9), W(16, 9), (19, 4), and an unnamed point (14, 11)are plotted on the graph, and joined to the respective axes using dotted lines.A concave curve is drawn from the y-axis to the x-axis, passing through the unnamed point (14, 11), and points W(16, 9), and X(19, 4).Point Y is between the curve and the axes.
Refer to Figure 2.5.If the economy is currently producing at point Y, what is the opportunity cost of moving to point W?
A)2 million tons of steel
B)zero
C)9 million tons of paper
D)16 million tons of paper
Alt text for Figure 2.5: In figure 2.5, a graph compares paper and steel production.Long description for Figure 2.5: The x-axis is labelled, steel in millions of tons and the quantities 14, 16, 19, and 20 are marked.The y-axis is labelled, paper in millions of tons, and the quantities 4, 9, and 11 are marked.Points Y(14, 9), W(16, 9), (19, 4), and an unnamed point (14, 11)are plotted on the graph, and joined to the respective axes using dotted lines.A concave curve is drawn from the y-axis to the x-axis, passing through the unnamed point (14, 11), and points W(16, 9), and X(19, 4).Point Y is between the curve and the axes.
Refer to Figure 2.5.If the economy is currently producing at point Y, what is the opportunity cost of moving to point W?
A)2 million tons of steel
B)zero
C)9 million tons of paper
D)16 million tons of paper
Unlock Deck
Unlock for access to all 314 flashcards in this deck.
Unlock Deck
k this deck
52
Figure 2.6 Toyota found the emission standards too difficult to meet to bring its diesel-engine offerings to North America.They have instead focused their research on hybrid-engine technology.Assume Toyota chooses to produce both hybrid-engine vehicles and diesel-engine vehicles (for markets outside North America)for its Prius brand.Figure 2.6 shows changes to its production possibilities frontier in response to new developments and different strategic production decisions.
Alt text for Figure 2.6: In figure 2.6, 3 graphs, A, B and C show the changes to Toyota's production possibilities frontier.
Long description for Figure 2.6: Graph A: The x-axis is labelled, diesel-engine automobiles, and the y-axis is labelled, hybrid-engine automobiles.2 convex curves are shown.The first curve begins slightly above the half-way point of the y-axis and ends near the end of the x-axis.The curve passes through point E about 1 third of the way along the curve.The second curve begins slightly above the first, on the y-axis.It finishes at the exact same point on the x-axis.The second curve passes through point F about 1 third of the way along the curve.Graph B: The x-axis is labelled, diesel-engine automobiles, and the y-axis is labelled hybrid-engine automobiles.2 convex curves are shown.The first curve begins slightly above the half-way mark on the y-axis and finishes about 2 thirds of the way along the x-axis.The curve passes through the point G, about halfway along the curve.The second curve begins slightly above the first on the y-axis, and finishes just past the end of the first on the x-axis.The curve passes through point J about 1 third of the way along the curve, and point H about 3 fourths of the way along the curve.Graph C: The x-axis is labelled, diesel-engine automobiles, and the y-axis is labelled hybrid-engine automobiles.A convex curve begins near the top of the y-axis and finishes near the end of the x-axis.It passes through point K about half-way along the curve.Point L is plotted between the curve and the axes.
Refer to Figure 2.6.In response to changing regulations and enforcement, Toyota has cut back on the production of diesel-powered vehicles and increased its hybrid production.This strategy is best represented by the
A)movement from F to E in Graph A.
B)movement from G to J in Graph B.
C)movement from L to K in Graph C.
D)movement from J to H in Graph B.
Toyota found the emission standards too difficult to meet to bring its diesel-engine offerings to North America.They have instead focused their research on hybrid-engine technology.Assume Toyota chooses to produce both hybrid-engine vehicles and diesel-engine vehicles (for markets outside North America)for its Prius brand.Figure 2.6 shows changes to its production possibilities frontier in response to new developments and different strategic production decisions.Alt text for Figure 2.6: In figure 2.6, 3 graphs, A, B and C show the changes to Toyota's production possibilities frontier.
Long description for Figure 2.6: Graph A: The x-axis is labelled, diesel-engine automobiles, and the y-axis is labelled, hybrid-engine automobiles.2 convex curves are shown.The first curve begins slightly above the half-way point of the y-axis and ends near the end of the x-axis.The curve passes through point E about 1 third of the way along the curve.The second curve begins slightly above the first, on the y-axis.It finishes at the exact same point on the x-axis.The second curve passes through point F about 1 third of the way along the curve.Graph B: The x-axis is labelled, diesel-engine automobiles, and the y-axis is labelled hybrid-engine automobiles.2 convex curves are shown.The first curve begins slightly above the half-way mark on the y-axis and finishes about 2 thirds of the way along the x-axis.The curve passes through the point G, about halfway along the curve.The second curve begins slightly above the first on the y-axis, and finishes just past the end of the first on the x-axis.The curve passes through point J about 1 third of the way along the curve, and point H about 3 fourths of the way along the curve.Graph C: The x-axis is labelled, diesel-engine automobiles, and the y-axis is labelled hybrid-engine automobiles.A convex curve begins near the top of the y-axis and finishes near the end of the x-axis.It passes through point K about half-way along the curve.Point L is plotted between the curve and the axes.
Refer to Figure 2.6.In response to changing regulations and enforcement, Toyota has cut back on the production of diesel-powered vehicles and increased its hybrid production.This strategy is best represented by the
A)movement from F to E in Graph A.
B)movement from G to J in Graph B.
C)movement from L to K in Graph C.
D)movement from J to H in Graph B.
Unlock Deck
Unlock for access to all 314 flashcards in this deck.
Unlock Deck
k this deck
53
If society decides it wants more of one good and all resources are fully utilized, then
A)it is unable to do this unless technology advances.
B)additional resource supplies will have to be found.
C)it has to give up some of another good and incur some opportunity costs.
D)more unemployment will occur.
A)it is unable to do this unless technology advances.
B)additional resource supplies will have to be found.
C)it has to give up some of another good and incur some opportunity costs.
D)more unemployment will occur.
Unlock Deck
Unlock for access to all 314 flashcards in this deck.
Unlock Deck
k this deck
54
Figure 2.5 Alt text for Figure 2.5: In figure 2.5, a graph compares paper and steel production.
Long description for Figure 2.5: The x-axis is labelled, steel in millions of tons and the quantities 14, 16, 19, and 20 are marked.The y-axis is labelled, paper in millions of tons, and the quantities 4, 9, and 11 are marked.Points Y(14, 9), W(16, 9), (19, 4), and an unnamed point (14, 11)are plotted on the graph, and joined to the respective axes using dotted lines.A concave curve is drawn from the y-axis to the x-axis, passing through the unnamed point (14, 11), and points W(16, 9), and X(19, 4).Point Y is between the curve and the axes.
Refer to Figure 2.5. If this economy is currently producing at point X, what is the opportunity cost of moving to point W?
A)3 million tons of steel
B)5 tons of paper
C)7 tons of paper
D)19 tons of steel
Alt text for Figure 2.5: In figure 2.5, a graph compares paper and steel production.Long description for Figure 2.5: The x-axis is labelled, steel in millions of tons and the quantities 14, 16, 19, and 20 are marked.The y-axis is labelled, paper in millions of tons, and the quantities 4, 9, and 11 are marked.Points Y(14, 9), W(16, 9), (19, 4), and an unnamed point (14, 11)are plotted on the graph, and joined to the respective axes using dotted lines.A concave curve is drawn from the y-axis to the x-axis, passing through the unnamed point (14, 11), and points W(16, 9), and X(19, 4).Point Y is between the curve and the axes.
Refer to Figure 2.5. If this economy is currently producing at point X, what is the opportunity cost of moving to point W?
A)3 million tons of steel
B)5 tons of paper
C)7 tons of paper
D)19 tons of steel
Unlock Deck
Unlock for access to all 314 flashcards in this deck.
Unlock Deck
k this deck
55
Figure 2.5 Alt text for Figure 2.5: In figure 2.5, a graph compares paper and steel production.
Long description for Figure 2.5: The x-axis is labelled, steel in millions of tons and the quantities 14, 16, 19, and 20 are marked.The y-axis is labelled, paper in millions of tons, and the quantities 4, 9, and 11 are marked.Points Y(14, 9), W(16, 9), (19, 4), and an unnamed point (14, 11)are plotted on the graph, and joined to the respective axes using dotted lines.A concave curve is drawn from the y-axis to the x-axis, passing through the unnamed point (14, 11), and points W(16, 9), and X(19, 4).Point Y is between the curve and the axes.
Refer to Figure 2.5.If the economy is currently producing at point W, what is the opportunity cost of moving to point X?
A)3 million tons of steel
B)19 million tons of steel
C)5 million tons of paper
D)9 million tons of paper
Alt text for Figure 2.5: In figure 2.5, a graph compares paper and steel production.Long description for Figure 2.5: The x-axis is labelled, steel in millions of tons and the quantities 14, 16, 19, and 20 are marked.The y-axis is labelled, paper in millions of tons, and the quantities 4, 9, and 11 are marked.Points Y(14, 9), W(16, 9), (19, 4), and an unnamed point (14, 11)are plotted on the graph, and joined to the respective axes using dotted lines.A concave curve is drawn from the y-axis to the x-axis, passing through the unnamed point (14, 11), and points W(16, 9), and X(19, 4).Point Y is between the curve and the axes.
Refer to Figure 2.5.If the economy is currently producing at point W, what is the opportunity cost of moving to point X?
A)3 million tons of steel
B)19 million tons of steel
C)5 million tons of paper
D)9 million tons of paper
Unlock Deck
Unlock for access to all 314 flashcards in this deck.
Unlock Deck
k this deck
56
The opportunity cost of taking a semester-long economics class is
A)the cost of tuition and fees only.
B)the value of the time spent in the classroom.
C)zero because there is no admission charged if you are enrolled in the course.
D)equal to the highest value of an alternative use of the time and money spent on the class.
E)the knowledge and enjoyment you receive from attending the class.
Unlock Deck
Unlock for access to all 314 flashcards in this deck.
Unlock Deck
k this deck
57
Consider a country that produces only two goods: kayaks and mittens.Suppose it is possible for this country to increase its production of kayaks without producing fewer mittens.In this case, its current output combination is efficient.
Unlock Deck
Unlock for access to all 314 flashcards in this deck.
Unlock Deck
k this deck
58
The Great Depression of the 1930s with a large number of workers and factories unemployed would be represented in a production possibilities frontier graph by
A)a point inside the frontier.
B)a point outside the frontier.
C)a point on the frontier.
D)an intercept on either the vertical or the horizontal axis.
A)a point inside the frontier.
B)a point outside the frontier.
C)a point on the frontier.
D)an intercept on either the vertical or the horizontal axis.
Unlock Deck
Unlock for access to all 314 flashcards in this deck.
Unlock Deck
k this deck
59
According to the production possibility model, if more resources are allocated to the production of physical and human capital, then which of the following is likely to happen?
A)Fewer goods will be produced for consumption today.
B)The production possibilities frontier will be shift inward in the future.
C)Future economic growth will decline.
D)The country's total production will fall.
A)Fewer goods will be produced for consumption today.
B)The production possibilities frontier will be shift inward in the future.
C)Future economic growth will decline.
D)The country's total production will fall.
Unlock Deck
Unlock for access to all 314 flashcards in this deck.
Unlock Deck
k this deck
60
Suppose your expenses for this term are as follows: tuition: $7,000, room and board: $8,500, books and other educational supplies: $2,500.Further, during the term, you can only work part-time and earn $5,500 instead of your full-time salary of $20,000.What is the opportunity cost of going to college this term, assuming that your room and board expenses would be the same even if you did not go to college?
A)$7,000
B)$9,500
C)$24,000
D)$38,000
A)$7,000
B)$9,500
C)$24,000
D)$38,000
Unlock Deck
Unlock for access to all 314 flashcards in this deck.
Unlock Deck
k this deck
61
Figure 2.7 Alt text for Figure 2.7: In figure 2.7, a graph compares production possibility frontiers of S U Vs and Roadsters.
Long description for Figure 2.7: The x-axis is labelled, S U Vs, and the y-axis is labelled, Roadsters.A convex curve begins near the top of the y-axis and ends approximately 3 quarters of the way down the x-axis.The point B is plotted midway along the curve.Point A is plotted between the curve and the y-axis.Point C is plotted outside the curve, near the top of the y-axis and approximately midway along the x-axis.
Refer to Figure 2.7. ________ is (are)inefficient in that not all resources are being used.
A)Point A
B)Point B
C)Point C
D)Points A and C
Alt text for Figure 2.7: In figure 2.7, a graph compares production possibility frontiers of S U Vs and Roadsters.Long description for Figure 2.7: The x-axis is labelled, S U Vs, and the y-axis is labelled, Roadsters.A convex curve begins near the top of the y-axis and ends approximately 3 quarters of the way down the x-axis.The point B is plotted midway along the curve.Point A is plotted between the curve and the y-axis.Point C is plotted outside the curve, near the top of the y-axis and approximately midway along the x-axis.
Refer to Figure 2.7. ________ is (are)inefficient in that not all resources are being used.
A)Point A
B)Point B
C)Point C
D)Points A and C
Unlock Deck
Unlock for access to all 314 flashcards in this deck.
Unlock Deck
k this deck
62
The production possibilities frontier model assumes all of the following, except
A)labour, capital, land, and natural resources are fixed in quantity.
B)the economy produces only two products.
C)any level of the two products that the economy produces is currently possible.
D)the level of technology is fixed and unchanging.
A)labour, capital, land, and natural resources are fixed in quantity.
B)the economy produces only two products.
C)any level of the two products that the economy produces is currently possible.
D)the level of technology is fixed and unchanging.
Unlock Deck
Unlock for access to all 314 flashcards in this deck.
Unlock Deck
k this deck
63
What is a production possibilities frontier? What do points along the frontier represent? What do points inside and outside the frontier represent?
Unlock Deck
Unlock for access to all 314 flashcards in this deck.
Unlock Deck
k this deck
64
The principle of ________ is that the economic cost of using a factor of production is the alternative use of that factor that is given up.
A)marginal cost
B)opportunity cost
C)normative economics
D)entrepreneurship
A)marginal cost
B)opportunity cost
C)normative economics
D)entrepreneurship
Unlock Deck
Unlock for access to all 314 flashcards in this deck.
Unlock Deck
k this deck
65
a.Draw a production possibilities frontier for a country that produces two goods, beer and pretzels.Assume that resources are equally suited to both tasks.
b.Define opportunity costs.
c.Use your production possibilities frontier graph to demonstrate the principle of opportunity costs.
b.Define opportunity costs.
c.Use your production possibilities frontier graph to demonstrate the principle of opportunity costs.
Unlock Deck
Unlock for access to all 314 flashcards in this deck.
Unlock Deck
k this deck
66
The production possibilities frontier shows
A)the various products that can be produced now and in the future.
B)the maximum attainable combinations of two products that may be produced in a particular time period with available resources.
C)what an equitable distribution of products among citizens would be.
D)what people want firms to produce in a particular time period.
Unlock Deck
Unlock for access to all 314 flashcards in this deck.
Unlock Deck
k this deck
67
What shape does a production possibilities frontier take if it displays increasing opportunity costs? What shape does a production possibilities frontier take if it displays constant opportunity costs? Which shape is most common in production situations? Why are both types presented in the text?
Unlock Deck
Unlock for access to all 314 flashcards in this deck.
Unlock Deck
k this deck
68
To compete in the automobile market, Toyota must make many strategic decisions, such as whether to introduce a new car model, whether to produce alternative-fuel vehicles, and where to advertise.At Toyota's Cambridge, Ontario plant, managers must decide on the monthly production quantities of their Corolla, Matrix, Rav4, and Lexus RX 450h models.In making these decisions, the managers
A)face no trade-offs because the Cambridge plant only produces these four models of the many Toyota models produced worldwide.
B)face trade-offs, because producing more of one model means producing less of the others.
C)will choose to only produce the quantity of Corolla, Matrix, Rav4, and RX 350 models where marginal cost equals zero.
D)will always decide on production quantities at which revenues are maximized.
Unlock Deck
Unlock for access to all 314 flashcards in this deck.
Unlock Deck
k this deck
69
Figure 2.7 Alt text for Figure 2.7: In figure 2.7, a graph compares production possibility frontiers of S U Vs and Roadsters.
Long description for Figure 2.7: The x-axis is labelled, S U Vs, and the y-axis is labelled, Roadsters.A convex curve begins near the top of the y-axis and ends approximately 3 quarters of the way down the x-axis.The point B is plotted midway along the curve.Point A is plotted between the curve and the y-axis.Point C is plotted outside the curve, near the top of the y-axis and approximately midway along the x-axis.
Refer to Figure 2.7. ________ is (are)unattainable with current resources.
A)Point A
B)Point B
C)Point C
D)Points A and C
Alt text for Figure 2.7: In figure 2.7, a graph compares production possibility frontiers of S U Vs and Roadsters.Long description for Figure 2.7: The x-axis is labelled, S U Vs, and the y-axis is labelled, Roadsters.A convex curve begins near the top of the y-axis and ends approximately 3 quarters of the way down the x-axis.The point B is plotted midway along the curve.Point A is plotted between the curve and the y-axis.Point C is plotted outside the curve, near the top of the y-axis and approximately midway along the x-axis.
Refer to Figure 2.7. ________ is (are)unattainable with current resources.
A)Point A
B)Point B
C)Point C
D)Points A and C
Unlock Deck
Unlock for access to all 314 flashcards in this deck.
Unlock Deck
k this deck
70
If additional units of a good could be produced at a constant opportunity cost, the production possibility frontier would be bowed outward (concave).
Unlock Deck
Unlock for access to all 314 flashcards in this deck.
Unlock Deck
k this deck
71
Table 2.2
Refer to Table 2.2.The Fruit Farm produces only apples and pears.The table above shows the maximum possible output combinations of the two fruits using all resources and currently available technology.
a.Graph The Fruit Farm's production possibilities frontier.Put apples on the horizontal axis and pears on the vertical axis.Be sure to identify the output combination points on your diagram.
b.Suppose The Fruit Farm is currently producing at point D.What is the opportunity cost of producing an additional 8,000 pounds of pears?
c.Suppose The Fruit Farm is currently producing at point D.What happens to the opportunity cost of producing more and more pears? Does it increase, decrease or remain constant? Explain your answer.
d.Suppose The Fruit Farm is currently producing at point G.What happens to the opportunity cost of producing more and more apples? Does it increase, decrease or remain constant? Explain your answer.
e.Suppose The Fruit Farm is plagued by the apple maggot infestation which destroys apple trees but not pears.Show in a graph what happens to its PPF.
Unlock Deck
Unlock for access to all 314 flashcards in this deck.
Unlock Deck
k this deck
72
________ exists because unlimited wants exceed the limited resources available to fulfill those wants.
A)Scarcity
B)Productive efficiency
C)The command economy
D)Economic growth
A)Scarcity
B)Productive efficiency
C)The command economy
D)Economic growth
Unlock Deck
Unlock for access to all 314 flashcards in this deck.
Unlock Deck
k this deck
73
An increase in the labour force shifts the production possibility frontier inwards over time.
Unlock Deck
Unlock for access to all 314 flashcards in this deck.
Unlock Deck
k this deck
74
The unattainable points in a production possibilities diagram are
A)the points within the production possibilities frontier.
B)the points along the production possibilities frontier.
C)the points of the horizontal and vertical intercepts.
D)the points outside the production possibilities frontier.
A)the points within the production possibilities frontier.
B)the points along the production possibilities frontier.
C)the points of the horizontal and vertical intercepts.
D)the points outside the production possibilities frontier.
Unlock Deck
Unlock for access to all 314 flashcards in this deck.
Unlock Deck
k this deck
75
To increase fuel efficiency, automobile manufacturers make cars small and light.Large cars absorb more of the impact of an accident than small cars but yield lower fuel efficiency.These facts suggest that a negative relationship exists between safety and fuel efficiency.
Unlock Deck
Unlock for access to all 314 flashcards in this deck.
Unlock Deck
k this deck
76
________ shows that if all resources are fully and efficiently utilized, more of one good can be produced only by producing less of another good.
A)Comparative advantage
B)Absolute advantage
C)The mixed market system
D)The production possibilities frontier model
A)Comparative advantage
B)Absolute advantage
C)The mixed market system
D)The production possibilities frontier model
Unlock Deck
Unlock for access to all 314 flashcards in this deck.
Unlock Deck
k this deck
77
Governments do not face trade-offs in providing programs, only individuals do.
Unlock Deck
Unlock for access to all 314 flashcards in this deck.
Unlock Deck
k this deck
78
Figure 2.7 Alt text for Figure 2.7: In figure 2.7, a graph compares production possibility frontiers of S U Vs and Roadsters.
Long description for Figure 2.7: The x-axis is labelled, S U Vs, and the y-axis is labelled, Roadsters.A convex curve begins near the top of the y-axis and ends approximately 3 quarters of the way down the x-axis.The point B is plotted midway along the curve.Point A is plotted between the curve and the y-axis.Point C is plotted outside the curve, near the top of the y-axis and approximately midway along the x-axis.
Refer to Figure 2.7. ________ is (are)technically efficient.
A)Point A
B)Point B
C)Point C
D)Points B and C
Alt text for Figure 2.7: In figure 2.7, a graph compares production possibility frontiers of S U Vs and Roadsters.Long description for Figure 2.7: The x-axis is labelled, S U Vs, and the y-axis is labelled, Roadsters.A convex curve begins near the top of the y-axis and ends approximately 3 quarters of the way down the x-axis.The point B is plotted midway along the curve.Point A is plotted between the curve and the y-axis.Point C is plotted outside the curve, near the top of the y-axis and approximately midway along the x-axis.
Refer to Figure 2.7. ________ is (are)technically efficient.
A)Point A
B)Point B
C)Point C
D)Points B and C
Unlock Deck
Unlock for access to all 314 flashcards in this deck.
Unlock Deck
k this deck
79
The ________ production points on a production possibility curve are the points along and inside the production possibility frontier.
A)attainable
B)unattainable
C)productively efficient
D)allocatively efficient
A)attainable
B)unattainable
C)productively efficient
D)allocatively efficient
Unlock Deck
Unlock for access to all 314 flashcards in this deck.
Unlock Deck
k this deck
80
On a diagram of a production possibility frontier, opportunity cost is represented by the production possibility frontier shifting outward.
Unlock Deck
Unlock for access to all 314 flashcards in this deck.
Unlock Deck
k this deck
Unlock Deck
Unlock for access to all 314 flashcards in this deck.


