Exam 2: Trade-Offs, Comparative Advantage, and the Market System
Exam 1: Economics: Foundations and Models148 Questions
Exam 2: Trade-Offs, Comparative Advantage, and the Market System314 Questions
Exam 3: Where Prices Come From: The Interaction of Supply and Demand314 Questions
Exam 4: GDP: Measuring Total Production and Income277 Questions
Exam 5: Unemployment and Inflation300 Questions
Exam 6: Economic Growth, The Financial System, and Business Cycles262 Questions
Exam 7: Long-Run Economic Growth: Sources and Policies280 Questions
Exam 8: Aggregate Expenditure and Output in the Short Run315 Questions
Exam 9: Aggregate Demand and Aggregate Supply Analysis246 Questions
Exam 10: Money, Banks, and the Bank of Canada285 Questions
Exam 11: Monetary Policy281 Questions
Exam 12: Fiscal Policy303 Questions
Exam 13: Inflation, Unemployment, and Bank of Canada Policy265 Questions
Exam 14: Macroeconomics in an Open Economy280 Questions
Exam 15: The International Financial System228 Questions
Select questions type
Bella can produce either a combination of 60 silk roses and 80 silk leaves or a combination of 70 silk roses and 55 silk leaves.If she now produces 60 silk roses and 80 silk leaves, what is the opportunity cost of producing an additional 10 silk roses?
Free
(Multiple Choice)
4.8/5  (31)
(31)
Correct Answer: Verified
C
When BlackBerry made its Leap smart phone, it relied on
Free
(Multiple Choice)
4.8/5 (38)
Correct Answer:Verified
A
Figure 2.4 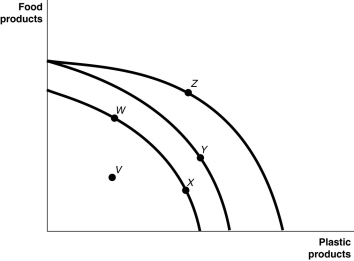 Figure 2.4 shows various points on three different production possibilities frontiers for a nation.
Alt text for Figure 2.4: In figure 2.4, a graph illustrates 3 different production possibilities.
Long description for Figure 2.4: The x-axis is labelled, plastic products, and the y-axis is labelled, food products.3 convex curves are shown, with points V, W, X, Y, and Z plotted.The first curve begins just past the half-way point on the y-axis, and ends just past the half-way point on the x-axis.Points W and X are plotted along the curve, with point W approximately 1 third of the way from the start of the curve, and point X more than 2 thirds of the way along the curve.The second curve begins almost 3 quarters of the way up the y-axis and ends just past the termination of the first curve on the x-axis.Point Y is plotted on the second curve, approximately 2 thirds of the way along the curve.The third curve begins at the same point as the second curve, and ends approximately 3 quarters of the way along the x-axis.Point Z is plotted on the third curve, a little less than half-way along the curve.Point V is plotted between the first curve and the origin.
-Refer to Figure 2.4.A movement from X to Y
Figure 2.4 shows various points on three different production possibilities frontiers for a nation.
Alt text for Figure 2.4: In figure 2.4, a graph illustrates 3 different production possibilities.
Long description for Figure 2.4: The x-axis is labelled, plastic products, and the y-axis is labelled, food products.3 convex curves are shown, with points V, W, X, Y, and Z plotted.The first curve begins just past the half-way point on the y-axis, and ends just past the half-way point on the x-axis.Points W and X are plotted along the curve, with point W approximately 1 third of the way from the start of the curve, and point X more than 2 thirds of the way along the curve.The second curve begins almost 3 quarters of the way up the y-axis and ends just past the termination of the first curve on the x-axis.Point Y is plotted on the second curve, approximately 2 thirds of the way along the curve.The third curve begins at the same point as the second curve, and ends approximately 3 quarters of the way along the x-axis.Point Z is plotted on the third curve, a little less than half-way along the curve.Point V is plotted between the first curve and the origin.
-Refer to Figure 2.4.A movement from X to Y
Free
(Multiple Choice)
4.8/5 (38)
Correct Answer:Verified
B
In a free market there are virtually no restrictions, or at best few restrictions, on how a good or service can be produced or sold.
(True/False)
4.9/5 (33)
An organization of producers that limits the amount of a good produced is known as a
(Multiple Choice)
4.9/5 (36)
In 18th century Europe, governments gave guilds legal authority to limit production of goods.Did this authority obstruct or improve the market mechanism and how?
(Multiple Choice)
4.8/5 (32)
A production possibilities frontier with a ________ shape indicates increasing opportunity costs as more and more of one good is produced.
(Multiple Choice)
4.8/5 (38)
Table 2.5
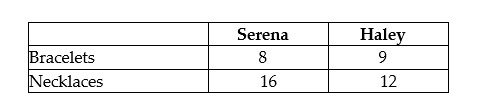 Table 2.5 shows the output per week of two jewelers, Serena and Haley.They can either devote their time to making bracelets or making necklaces.
-Refer to Table 2.5.Which of the following statements is true?
Table 2.5 shows the output per week of two jewelers, Serena and Haley.They can either devote their time to making bracelets or making necklaces.
-Refer to Table 2.5.Which of the following statements is true?
(Multiple Choice)
4.8/5 (31)
Japan currently has fewer women working (outside the home)than most other developed countries. If these women were to take on jobs, it would
(Multiple Choice)
4.7/5 (37)
All of the following are considered intellectual property except
(Multiple Choice)
4.9/5 (32)
Figure 2.3 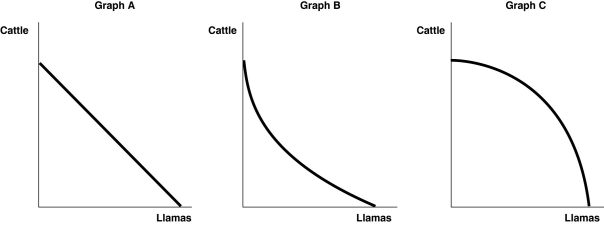 Alt text for Figure 2.3: In figure 2.3, 3 graphs, A, B and C comparing production of cattle and llamas.
Long description for Figure 2.3: Graph A: the x-axis is labelled, llamas, and y-axis is labelled, cattle.A line slopes down from the top left corner of the quadrant, near the top of the y-axis to the bottom right corner, near the end of the x-axis.Graph B: the x-axis is labelled, llamas, and y-axis is labelled, cattle.A convex curve begins in the top left corner, near the top of the y-axis and ends in the bottom right corner, near the end of the x-axis.Graph C: the x-axis is labelled, llamas, and y-axis is labelled, cattle.A concave curve begins in the top left corner near the top of the y-axis, and ends in the bottom right corner, near the end of the x-axis.
-Refer to Figure 2.3.Sergio Vignetto raises cattle and llamas on his land.His land is equally suitable for raising either animal.Which of the graphs in Figure 2.3 represent his production possibilities frontier?
Alt text for Figure 2.3: In figure 2.3, 3 graphs, A, B and C comparing production of cattle and llamas.
Long description for Figure 2.3: Graph A: the x-axis is labelled, llamas, and y-axis is labelled, cattle.A line slopes down from the top left corner of the quadrant, near the top of the y-axis to the bottom right corner, near the end of the x-axis.Graph B: the x-axis is labelled, llamas, and y-axis is labelled, cattle.A convex curve begins in the top left corner, near the top of the y-axis and ends in the bottom right corner, near the end of the x-axis.Graph C: the x-axis is labelled, llamas, and y-axis is labelled, cattle.A concave curve begins in the top left corner near the top of the y-axis, and ends in the bottom right corner, near the end of the x-axis.
-Refer to Figure 2.3.Sergio Vignetto raises cattle and llamas on his land.His land is equally suitable for raising either animal.Which of the graphs in Figure 2.3 represent his production possibilities frontier?
(Multiple Choice)
4.9/5 (42)
Is it possible for a firm to have an absolute advantage in producing something without having a comparative advantage? Why or why not?
(Essay)
4.8/5 (34)
If the production possibilities frontier is ________, then opportunity costs are constant as more of one good is produced.
(Multiple Choice)
4.9/5 (34)
Figure 2.1 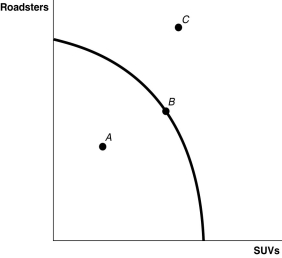 Alt text for Figure 2.1: In figure 2.1, a graph compares roadsters and S U Vs.
Long description for Figure 2.1: The x-axis is labelled, S U Vs, and the y-axis is labelled, roadsters.3 points A, B, and C are plotted on the graph.A concave curve is drawn between the y-axis and the x-axis, from near the top of the y-axis, to near the end of the y-axis.Near the mid-point of the curve, it passes through point B.Point A is between the curve and the origin, and point C is outside the curve, midway along the x-axis and near the top of the y-axis.
-Refer to Figure 2.1.Point C is
Alt text for Figure 2.1: In figure 2.1, a graph compares roadsters and S U Vs.
Long description for Figure 2.1: The x-axis is labelled, S U Vs, and the y-axis is labelled, roadsters.3 points A, B, and C are plotted on the graph.A concave curve is drawn between the y-axis and the x-axis, from near the top of the y-axis, to near the end of the y-axis.Near the mid-point of the curve, it passes through point B.Point A is between the curve and the origin, and point C is outside the curve, midway along the x-axis and near the top of the y-axis.
-Refer to Figure 2.1.Point C is
(Multiple Choice)
4.7/5 (25)
Table 2.3
Production Choices for Dina's Diner  -Refer to Table 2.3.Assume Dina's Diner only produces sliders and hot wings.A combination of 40 sliders and 25 hot wings would appear
(Multiple Choice)
4.8/5 (41)
If society decides it wants more of one good and ________, then it has to give up some of another good and incur some opportunity costs.
(Multiple Choice)
4.8/5 (35)
All of the following countries come close to the free market benchmark except
(Multiple Choice)
4.8/5 (43)
Filters
- Essay(0)
- Multiple Choice(0)
- Short Answer(0)
- True False(0)
- Matching(0)