Deck 3: Where Prices Come From: The Interaction of Supply and Demand
Full screen (f)
Question
Question
Question
Question
Question
Question
Question
Question
Question
Table 3.1 
Refer to Table 3.1.The table above shows the demand schedules for loose-leaf tea of two individuals (Sunil and Mia )and the rest of the market.At a price of $5, the quantity demanded in the market would be
A)51 kgs.
B)63 kgs.
C)76 kgs
D)146 kgs.
Refer to Table 3.1.The table above shows the demand schedules for loose-leaf tea of two individuals (Sunil and Mia )and the rest of the market.At a price of $5, the quantity demanded in the market would be
A)51 kgs.
B)63 kgs.
C)76 kgs
D)146 kgs.
Question
Question
Question
Question
Question
Question
Question
Question
Question
Question
Table 3.1
Refer to Table 3.1.The table above shows the demand schedules for loose-leaf tea of two individuals (Sunil and Mia )and the rest of the market.If the price of loose-leaf tea rises from $3 to $4, the market quantity demanded would
A)decrease by 32 kgs.
B)increase by 64 kgs.
C)increase by 32 kgs.
D)decrease by 64 kgs.
Question
Question
Question
Question
Figure 3.1  Alt text for Figure 3.1: In figure 3.1, graph of the effect of an increase in population on the demand curve.
Long description for Figure 3.1: The x-axis is labelled, Quantity, and y-axis is labelled, Price.Curve Demand, D1, is a straight line which slopes down from the top left corner to the bottom right corner.Curve D2 follows the same slope as curve D1, but is plotted to the right.2 points, A and B, are plotted in the middle of curve D1.A right pointing arrow indicates the change from curve D1 to curve D2.
Refer to Figure 3.1.A case in which consumers no longer cared for a product would be represented by a movement from
A)A to B.
B)B to A.
C)D1 to D2.
D)D2 to D1.
Alt text for Figure 3.1: In figure 3.1, graph of the effect of an increase in population on the demand curve.Long description for Figure 3.1: The x-axis is labelled, Quantity, and y-axis is labelled, Price.Curve Demand, D1, is a straight line which slopes down from the top left corner to the bottom right corner.Curve D2 follows the same slope as curve D1, but is plotted to the right.2 points, A and B, are plotted in the middle of curve D1.A right pointing arrow indicates the change from curve D1 to curve D2.
Refer to Figure 3.1.A case in which consumers no longer cared for a product would be represented by a movement from
A)A to B.
B)B to A.
C)D1 to D2.
D)D2 to D1.
Question
Question
Question
Question
Question
Question
Question
Figure 3.1 Alt text for Figure 3.1: In figure 3.1, graph of the effect of an increase in population on the demand curve.
Long description for Figure 3.1: The x-axis is labelled, Quantity, and y-axis is labelled, Price.Curve Demand, D1, is a straight line which slopes down from the top left corner to the bottom right corner.Curve D2 follows the same slope as curve D1, but is plotted to the right.2 points, A and B, are plotted in the middle of curve D1.A right pointing arrow indicates the change from curve D1 to curve D2.
Refer to Figure 3.1.If the product represented is an inferior good, an increase in income would be represented by a movement from
A)A to B.
B)B to A.
C)D1 to D2.
D)D2 to D1.
Alt text for Figure 3.1: In figure 3.1, graph of the effect of an increase in population on the demand curve.Long description for Figure 3.1: The x-axis is labelled, Quantity, and y-axis is labelled, Price.Curve Demand, D1, is a straight line which slopes down from the top left corner to the bottom right corner.Curve D2 follows the same slope as curve D1, but is plotted to the right.2 points, A and B, are plotted in the middle of curve D1.A right pointing arrow indicates the change from curve D1 to curve D2.
Refer to Figure 3.1.If the product represented is an inferior good, an increase in income would be represented by a movement from
A)A to B.
B)B to A.
C)D1 to D2.
D)D2 to D1.
Question
Question
Question
Figure 3.1 Alt text for Figure 3.1: In figure 3.1, graph of the effect of an increase in population on the demand curve.
Long description for Figure 3.1: The x-axis is labelled, Quantity, and y-axis is labelled, Price.Curve Demand, D1, is a straight line which slopes down from the top left corner to the bottom right corner.Curve D2 follows the same slope as curve D1, but is plotted to the right.2 points, A and B, are plotted in the middle of curve D1.A right pointing arrow indicates the change from curve D1 to curve D2.
Refer to Figure 3.1.A decrease in the price of the product would be represented by a movement from
A)A to B.
B)B to A.
C)D1 to D2.
D)D2 to D1.
Alt text for Figure 3.1: In figure 3.1, graph of the effect of an increase in population on the demand curve.Long description for Figure 3.1: The x-axis is labelled, Quantity, and y-axis is labelled, Price.Curve Demand, D1, is a straight line which slopes down from the top left corner to the bottom right corner.Curve D2 follows the same slope as curve D1, but is plotted to the right.2 points, A and B, are plotted in the middle of curve D1.A right pointing arrow indicates the change from curve D1 to curve D2.
Refer to Figure 3.1.A decrease in the price of the product would be represented by a movement from
A)A to B.
B)B to A.
C)D1 to D2.
D)D2 to D1.
Question
Question
Question
Question
Question
Question
Question
Figure 3.1 Alt text for Figure 3.1: In figure 3.1, graph of the effect of an increase in population on the demand curve.
Long description for Figure 3.1: The x-axis is labelled, Quantity, and y-axis is labelled, Price.Curve Demand, D1, is a straight line which slopes down from the top left corner to the bottom right corner.Curve D2 follows the same slope as curve D1, but is plotted to the right.2 points, A and B, are plotted in the middle of curve D1.A right pointing arrow indicates the change from curve D1 to curve D2.
Refer to Figure 3.1. An increase in population would be represented by a movement from
A) A to B.
B) B to A
C) D1 to D2.
D) D2 to D1.
Alt text for Figure 3.1: In figure 3.1, graph of the effect of an increase in population on the demand curve.Long description for Figure 3.1: The x-axis is labelled, Quantity, and y-axis is labelled, Price.Curve Demand, D1, is a straight line which slopes down from the top left corner to the bottom right corner.Curve D2 follows the same slope as curve D1, but is plotted to the right.2 points, A and B, are plotted in the middle of curve D1.A right pointing arrow indicates the change from curve D1 to curve D2.
Refer to Figure 3.1. An increase in population would be represented by a movement from
A) A to B.
B) B to A
C) D1 to D2.
D) D2 to D1.
Question
Question
Question
Question
Question
Question
Question
Question
Question
Question
Question
Question
Question
Question
Question
Question
Question
Question
Question
Question
Question
Table 3.2 
Refer to Table 3.2.The table above shows the demand schedules for Kona coffee of two individuals (Luke and Ravi)and the rest of the market.If the price of Kona coffee rises from $4 to $5, the market quantity demanded would
A)decrease by 35 kg.
B)increase by 115 kg.
C)increase by 35 kg.
D)decrease by 115 kg.
Question
Question
Question
Question
Question
Question
Question
Figure 3.2 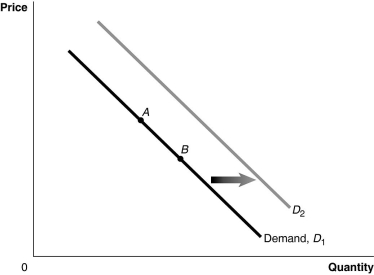 Alt text for Figure 3.2: In figure 3.2, a graph of the effect of an increase in the price of a complement on demand curve.
Long description for Figure 3.2: The x-axis is labelled, Quantity, and y-axis is labelled, Price.Curve Demand, D1, is a straight line which slopes down from the top left corner to the bottom right corner.Curve D2 follows the same slope as curve D1, but is plotted to the right.2 points, A and B, are plotted in the middle of curve D1.A right pointing arrow indicates the change from curve D1 to curve D2.
Refer to Figure 3.2.An increase in the price of the product would be represented by a movement from
A)A to B.
B)B to A.
C)D1 to D2.
D)D2 to D1.
Alt text for Figure 3.2: In figure 3.2, a graph of the effect of an increase in the price of a complement on demand curve.Long description for Figure 3.2: The x-axis is labelled, Quantity, and y-axis is labelled, Price.Curve Demand, D1, is a straight line which slopes down from the top left corner to the bottom right corner.Curve D2 follows the same slope as curve D1, but is plotted to the right.2 points, A and B, are plotted in the middle of curve D1.A right pointing arrow indicates the change from curve D1 to curve D2.
Refer to Figure 3.2.An increase in the price of the product would be represented by a movement from
A)A to B.
B)B to A.
C)D1 to D2.
D)D2 to D1.
Question
Question
Question
Question
Question
Question
Table 3.2
Refer to Table 3.2.The table above shows the demand schedules for Kona coffee of two individuals (Luke and Ravi)and the rest of the market.At a price of $6, the quantity demanded in the market would be
A)36 kg.
B)68 kg.
C)89 kg.
D)123 kg.
Refer to Table 3.2.The table above shows the demand schedules for Kona coffee of two individuals (Luke and Ravi)and the rest of the market.At a price of $6, the quantity demanded in the market would be
A)36 kg.
B)68 kg.
C)89 kg.
D)123 kg.
Question
Figure 3.2 Alt text for Figure 3.2: In figure 3.2, a graph of the effect of an increase in the price of a complement on demand curve.
Long description for Figure 3.2: The x-axis is labelled, Quantity, and y-axis is labelled, Price.Curve Demand, D1, is a straight line which slopes down from the top left corner to the bottom right corner.Curve D2 follows the same slope as curve D1, but is plotted to the right.2 points, A and B, are plotted in the middle of curve D1.A right pointing arrow indicates the change from curve D1 to curve D2.
Refer to Figure 3.2.An increase in the price of a complement would be represented by a movement from
A)A to B.
B)B to A.
C)D1 to D2.
D)D2 to D1.
Alt text for Figure 3.2: In figure 3.2, a graph of the effect of an increase in the price of a complement on demand curve.Long description for Figure 3.2: The x-axis is labelled, Quantity, and y-axis is labelled, Price.Curve Demand, D1, is a straight line which slopes down from the top left corner to the bottom right corner.Curve D2 follows the same slope as curve D1, but is plotted to the right.2 points, A and B, are plotted in the middle of curve D1.A right pointing arrow indicates the change from curve D1 to curve D2.
Refer to Figure 3.2.An increase in the price of a complement would be represented by a movement from
A)A to B.
B)B to A.
C)D1 to D2.
D)D2 to D1.
Question
Figure 3.2 Alt text for Figure 3.2: In figure 3.2, a graph of the effect of an increase in the price of a complement on demand curve.
Long description for Figure 3.2: The x-axis is labelled, Quantity, and y-axis is labelled, Price.Curve Demand, D1, is a straight line which slopes down from the top left corner to the bottom right corner.Curve D2 follows the same slope as curve D1, but is plotted to the right.2 points, A and B, are plotted in the middle of curve D1.A right pointing arrow indicates the change from curve D1 to curve D2.
Refer to Figure 3.2.If the product represented is a normal good, an increase in income would be represented by a movement from
A)A to B.
B)B to A.
C)D1 to D2.
D)D2 to D1.
Alt text for Figure 3.2: In figure 3.2, a graph of the effect of an increase in the price of a complement on demand curve.Long description for Figure 3.2: The x-axis is labelled, Quantity, and y-axis is labelled, Price.Curve Demand, D1, is a straight line which slopes down from the top left corner to the bottom right corner.Curve D2 follows the same slope as curve D1, but is plotted to the right.2 points, A and B, are plotted in the middle of curve D1.A right pointing arrow indicates the change from curve D1 to curve D2.
Refer to Figure 3.2.If the product represented is a normal good, an increase in income would be represented by a movement from
A)A to B.
B)B to A.
C)D1 to D2.
D)D2 to D1.
Question
Figure 3.2 Alt text for Figure 3.2: In figure 3.2, a graph of the effect of an increase in the price of a complement on demand curve.
Long description for Figure 3.2: The x-axis is labelled, Quantity, and y-axis is labelled, Price.Curve Demand, D1, is a straight line which slopes down from the top left corner to the bottom right corner.Curve D2 follows the same slope as curve D1, but is plotted to the right.2 points, A and B, are plotted in the middle of curve D1.A right pointing arrow indicates the change from curve D1 to curve D2.
Refer to Figure 3.2.A decrease in the expected future price of the product would be represented by a movement from
A)A to B.
B)B to A.
C)D1 to D2.
D)D2 to D1.
Alt text for Figure 3.2: In figure 3.2, a graph of the effect of an increase in the price of a complement on demand curve.Long description for Figure 3.2: The x-axis is labelled, Quantity, and y-axis is labelled, Price.Curve Demand, D1, is a straight line which slopes down from the top left corner to the bottom right corner.Curve D2 follows the same slope as curve D1, but is plotted to the right.2 points, A and B, are plotted in the middle of curve D1.A right pointing arrow indicates the change from curve D1 to curve D2.
Refer to Figure 3.2.A decrease in the expected future price of the product would be represented by a movement from
A)A to B.
B)B to A.
C)D1 to D2.
D)D2 to D1.
Question
Question
Question

Unlock Deck
Sign up to unlock the cards in this deck!
Unlock Deck
Unlock Deck
1/314
Play
Full screen (f)
Deck 3: Where Prices Come From: The Interaction of Supply and Demand
1
A movement along the demand curve for toothpaste would be caused by
A)a change in the price of toothbrushes.
B)a change in consumer income.
C)a change in the price of toothpaste.
D)a change in population.
A)a change in the price of toothbrushes.
B)a change in consumer income.
C)a change in the price of toothpaste.
D)a change in population.
a change in the price of toothpaste.
2
The demand by all the consumers of a given good or service is the ________ for the good or service.
A)market demand
B)quantity demanded
C)law of demand
D)scheduled demand
A)market demand
B)quantity demanded
C)law of demand
D)scheduled demand
market demand
3
The income effect of a price change refers to the impact of a change in
A)income on the price of a good.
B)demand when income changes.
C)the quantity demanded when income changes.
D)the price of a good on a consumer's purchasing power.
A)income on the price of a good.
B)demand when income changes.
C)the quantity demanded when income changes.
D)the price of a good on a consumer's purchasing power.
the price of a good on a consumer's purchasing power.
4
What is the difference between an "increase in demand" and an "increase in quantity demanded"?
A)There is no difference between the two terms; they both refer to a shift of the demand curve.
B)An "increase in demand" is represented by a rightward shift of the demand curve while an "increase in quantity demanded" is represented by a movement along a given demand curve.
C)There is no difference between the two terms; they both refer to a movement downward along a given demand curve.
D)An "increase in demand" is represented by a movement along a given demand curve, while an "increase in quantity demanded" is represented by a rightward shift of the demand curve.
Unlock Deck
Unlock for access to all 314 flashcards in this deck.
Unlock Deck
k this deck
5
Following the successful launch of Red Bull in the Canadian market in 2004, companies such as Coca Cola, Pepsi, and many others have introduced products to compete with Red Bull.The energy drinks introduced to compete with Red Bull would be considered
A)complements to Red Bull.
B)substitutes for Red Bull.
C)inferior goods compared to Red Bull.
D)normal goods compared to Red Bull.
A)complements to Red Bull.
B)substitutes for Red Bull.
C)inferior goods compared to Red Bull.
D)normal goods compared to Red Bull.
Unlock Deck
Unlock for access to all 314 flashcards in this deck.
Unlock Deck
k this deck
6
By drawing a demand curve with ________ on the vertical axis and ________ on the horizontal axis, economists assume that the most important determinant of the demand for a good is the ________ of the good.
A)quantity; price; quantity
B)price; quantity; quantity
C)price; quantity; price
D)quantity; price; price
A)quantity; price; quantity
B)price; quantity; quantity
C)price; quantity; price
D)quantity; price; price
Unlock Deck
Unlock for access to all 314 flashcards in this deck.
Unlock Deck
k this deck
7
If, in response to an increase in the price of chocolate, the quantity demanded of chocolate decreases economists would describe this as
A)a decrease in demand.
B)a decrease in quantity demanded.
C)a change in consumer income.
D)a decrease in consumers' taste for chocolate.
A)a decrease in demand.
B)a decrease in quantity demanded.
C)a change in consumer income.
D)a decrease in consumers' taste for chocolate.
Unlock Deck
Unlock for access to all 314 flashcards in this deck.
Unlock Deck
k this deck
8
If an increase in income leads to a decrease in the demand for popcorn, then popcorn is
A)an inferior good.
B)a neutral good.
C)a necessity.
D)a normal good.
A)an inferior good.
B)a neutral good.
C)a necessity.
D)a normal good.
Unlock Deck
Unlock for access to all 314 flashcards in this deck.
Unlock Deck
k this deck
9
Table 3.1
Refer to Table 3.1.The table above shows the demand schedules for loose-leaf tea of two individuals (Sunil and Mia )and the rest of the market.At a price of $5, the quantity demanded in the market would be
A)51 kgs.
B)63 kgs.
C)76 kgs
D)146 kgs.
Refer to Table 3.1.The table above shows the demand schedules for loose-leaf tea of two individuals (Sunil and Mia )and the rest of the market.At a price of $5, the quantity demanded in the market would be
A)51 kgs.
B)63 kgs.
C)76 kgs
D)146 kgs.
Unlock Deck
Unlock for access to all 314 flashcards in this deck.
Unlock Deck
k this deck
10
If the price of grapefruit rises, the substitution effect due to the price change will cause
A)a decrease in the demand for grapefruit.
B)a decrease in the demand for oranges, a substitute for grapefruit.
C)a decrease in the quantity demanded of grapefruit.
D)a decrease in the quantity supplied of grapefruit.
A)a decrease in the demand for grapefruit.
B)a decrease in the demand for oranges, a substitute for grapefruit.
C)a decrease in the quantity demanded of grapefruit.
D)a decrease in the quantity supplied of grapefruit.
Unlock Deck
Unlock for access to all 314 flashcards in this deck.
Unlock Deck
k this deck
11
A change in all of the following variables will change the market demand for a product except
A)the price of the product.
B)population and demographics.
C)income.
D)tastes.
A)the price of the product.
B)population and demographics.
C)income.
D)tastes.
Unlock Deck
Unlock for access to all 314 flashcards in this deck.
Unlock Deck
k this deck
12
Which of the following will shift the demand curve for a good?
A)a change in the technology used to produce the good
B)an increase in the price of the good
C)a decrease in the price of a complementary good
D)a decrease in the price of the good
A)a change in the technology used to produce the good
B)an increase in the price of the good
C)a decrease in the price of a complementary good
D)a decrease in the price of the good
Unlock Deck
Unlock for access to all 314 flashcards in this deck.
Unlock Deck
k this deck
13
If an increase in income leads to in an increase in the demand for peanut butter, then peanut butter is
A)a neutral good.
B)a normal good.
C)a necessity.
D)a complement.
A)a neutral good.
B)a normal good.
C)a necessity.
D)a complement.
Unlock Deck
Unlock for access to all 314 flashcards in this deck.
Unlock Deck
k this deck
14
Holding everything else constant, an increase in the price of MP3 players will result in
A)a decrease in the quantity of MP3 players supplied.
B)a decrease in the demand for MP3 players.
C)an increase in the supply of MP3 players.
D)a decrease in the quantity of MP3 players demanded.
A)a decrease in the quantity of MP3 players supplied.
B)a decrease in the demand for MP3 players.
C)an increase in the supply of MP3 players.
D)a decrease in the quantity of MP3 players demanded.
Unlock Deck
Unlock for access to all 314 flashcards in this deck.
Unlock Deck
k this deck
15
When the price of a normal good falls, consumers buy a larger quantity because of the ________ effect and the ________ effect.
A)substitution; income
B)normal; inferior
C)substitute; complement
D)supply; demand
A)substitution; income
B)normal; inferior
C)substitute; complement
D)supply; demand
Unlock Deck
Unlock for access to all 314 flashcards in this deck.
Unlock Deck
k this deck
16
If a demand curve shifts to the right, then
A)demand has increased.
B)quantity demanded has increased.
C)demand has decreased.
D)quantity demanded has decreased.
A)demand has increased.
B)quantity demanded has increased.
C)demand has decreased.
D)quantity demanded has decreased.
Unlock Deck
Unlock for access to all 314 flashcards in this deck.
Unlock Deck
k this deck
17
The law of demand implies, holding everything else constant, that
A)as the price of bagels increases, the quantity of bagels demanded will decrease.
B)as the price of bagels increases, the demand for bagels will decrease.
C)as the price of bagels increases, the quantity of bagels demanded will increase.
D)as the price of bagels increases, the demand for bagels will increase.
Unlock Deck
Unlock for access to all 314 flashcards in this deck.
Unlock Deck
k this deck
18
The ________ effect refers to the change in quantity demanded for a good that results from the effect of a change in the good's price on consumer's purchasing power.
A)ceteris paribus
B)population
C)substitution
D)income
A)ceteris paribus
B)population
C)substitution
D)income
Unlock Deck
Unlock for access to all 314 flashcards in this deck.
Unlock Deck
k this deck
19
Table 3.1
Refer to Table 3.1.The table above shows the demand schedules for loose-leaf tea of two individuals (Sunil and Mia )and the rest of the market.If the price of loose-leaf tea rises from $3 to $4, the market quantity demanded would
A)decrease by 32 kgs.
B)increase by 64 kgs.
C)increase by 32 kgs.
D)decrease by 64 kgs.
Unlock Deck
Unlock for access to all 314 flashcards in this deck.
Unlock Deck
k this deck
20
If Red Bull and Beaver Buzz Energy are considered substitutes, then, other things equal, an increase in the price of the Red Bull will
A)decrease the demand for the Red Bull.
B)increase the demand for the Beaver Buzz Energy.
C)increase the quantity demanded for Beaver Buzz Energy.
D)increase the quantity demanded for the Red Bull.
A)decrease the demand for the Red Bull.
B)increase the demand for the Beaver Buzz Energy.
C)increase the quantity demanded for Beaver Buzz Energy.
D)increase the quantity demanded for the Red Bull.
Unlock Deck
Unlock for access to all 314 flashcards in this deck.
Unlock Deck
k this deck
21
Elvira decreased her consumption of bananas when the price of peanut butter increased.For Elvira, peanut butter and bananas are
A)substitutes in consumption.
B)both inferior goods.
C)complements in consumption.
D)both luxury goods.
A)substitutes in consumption.
B)both inferior goods.
C)complements in consumption.
D)both luxury goods.
Unlock Deck
Unlock for access to all 314 flashcards in this deck.
Unlock Deck
k this deck
22
Which of the following products would be most likely to see a rise in demand due a drop in incomes?
A)instant ramen noodles
B)lobster dinners
C)new cars
D)hotel rooms
A)instant ramen noodles
B)lobster dinners
C)new cars
D)hotel rooms
Unlock Deck
Unlock for access to all 314 flashcards in this deck.
Unlock Deck
k this deck
23
Figure 3.1 Alt text for Figure 3.1: In figure 3.1, graph of the effect of an increase in population on the demand curve.
Long description for Figure 3.1: The x-axis is labelled, Quantity, and y-axis is labelled, Price.Curve Demand, D1, is a straight line which slopes down from the top left corner to the bottom right corner.Curve D2 follows the same slope as curve D1, but is plotted to the right.2 points, A and B, are plotted in the middle of curve D1.A right pointing arrow indicates the change from curve D1 to curve D2.
Refer to Figure 3.1.A case in which consumers no longer cared for a product would be represented by a movement from
A)A to B.
B)B to A.
C)D1 to D2.
D)D2 to D1.
Alt text for Figure 3.1: In figure 3.1, graph of the effect of an increase in population on the demand curve.Long description for Figure 3.1: The x-axis is labelled, Quantity, and y-axis is labelled, Price.Curve Demand, D1, is a straight line which slopes down from the top left corner to the bottom right corner.Curve D2 follows the same slope as curve D1, but is plotted to the right.2 points, A and B, are plotted in the middle of curve D1.A right pointing arrow indicates the change from curve D1 to curve D2.
Refer to Figure 3.1.A case in which consumers no longer cared for a product would be represented by a movement from
A)A to B.
B)B to A.
C)D1 to D2.
D)D2 to D1.
Unlock Deck
Unlock for access to all 314 flashcards in this deck.
Unlock Deck
k this deck
24
Technological advances have resulted in lower prices for digital cameras.What is the impact of this on the market for traditional (non-digital)cameras?
A)The demand curve for traditional cameras shifts to the right.
B)The supply curve for traditional cameras shifts to the right.
C)The demand curve for traditional cameras shifts to the left.
D)The supply curve for traditional cameras shifts to the left.
A)The demand curve for traditional cameras shifts to the right.
B)The supply curve for traditional cameras shifts to the right.
C)The demand curve for traditional cameras shifts to the left.
D)The supply curve for traditional cameras shifts to the left.
Unlock Deck
Unlock for access to all 314 flashcards in this deck.
Unlock Deck
k this deck
25
Technological advancements have led to lower prices and an increase in the sale of digital cameras.How does this affect the digital photo printing paper market?
A)The demand curve for digital photo printing paper shifts to the right.
B)The demand curve for digital photo printing paper shifts to the left.
C)The supply curve for digital photo printing paper shifts to the right.
D)The supply curve for digital photo printing paper shifts to the left.
A)The demand curve for digital photo printing paper shifts to the right.
B)The demand curve for digital photo printing paper shifts to the left.
C)The supply curve for digital photo printing paper shifts to the right.
D)The supply curve for digital photo printing paper shifts to the left.
Unlock Deck
Unlock for access to all 314 flashcards in this deck.
Unlock Deck
k this deck
26
Suppose that when the price of hamburgers decreases, the Li family increases their purchases of ketchup.To the Li family
A)hamburgers and ketchup are complements.
B)hamburgers and ketchup and substitutes.
C)hamburgers and ketchup are normal goods.
D)hamburgers are normal goods and hot dogs are inferior goods.
A)hamburgers and ketchup are complements.
B)hamburgers and ketchup and substitutes.
C)hamburgers and ketchup are normal goods.
D)hamburgers are normal goods and hot dogs are inferior goods.
Unlock Deck
Unlock for access to all 314 flashcards in this deck.
Unlock Deck
k this deck
27
As incomes in Alberta fall people are drinking less craft beer and more beer produced by international brewers. Thus, an economist would consider beer produced by international brewers to be a(n)
A)normal good.
B)inferior good.
C)complementary good.
D)substitute good.
A)normal good.
B)inferior good.
C)complementary good.
D)substitute good.
Unlock Deck
Unlock for access to all 314 flashcards in this deck.
Unlock Deck
k this deck
28
Buyers rush to purchase stocks in Ontario vineyards following a forecast of a 30 percent decline in this year's grape harvest.What happens in the Ontario wine market as a result of this announcement?
A)The demand curve for Ontario wine shifts to the left in anticipation of higher prices in the future.
B)The demand curve for Ontario wine shifts to the right in anticipation of higher prices in the future.
C)The supply curve for Ontario wine shifts to the right in anticipation of higher prices in the future.
D)The supply curve for Ontario wine shifts to the left in anticipation of lower quantities in the future.
Unlock Deck
Unlock for access to all 314 flashcards in this deck.
Unlock Deck
k this deck
29
Whether a good is normal or inferior depends on
A)people's attitudes.
B)the price of the product.
C)the taxes people pay when purchasing it.
D)whether the product is high quality.
A)people's attitudes.
B)the price of the product.
C)the taxes people pay when purchasing it.
D)whether the product is high quality.
Unlock Deck
Unlock for access to all 314 flashcards in this deck.
Unlock Deck
k this deck
30
Figure 3.1 Alt text for Figure 3.1: In figure 3.1, graph of the effect of an increase in population on the demand curve.
Long description for Figure 3.1: The x-axis is labelled, Quantity, and y-axis is labelled, Price.Curve Demand, D1, is a straight line which slopes down from the top left corner to the bottom right corner.Curve D2 follows the same slope as curve D1, but is plotted to the right.2 points, A and B, are plotted in the middle of curve D1.A right pointing arrow indicates the change from curve D1 to curve D2.
Refer to Figure 3.1.If the product represented is an inferior good, an increase in income would be represented by a movement from
A)A to B.
B)B to A.
C)D1 to D2.
D)D2 to D1.
Alt text for Figure 3.1: In figure 3.1, graph of the effect of an increase in population on the demand curve.Long description for Figure 3.1: The x-axis is labelled, Quantity, and y-axis is labelled, Price.Curve Demand, D1, is a straight line which slopes down from the top left corner to the bottom right corner.Curve D2 follows the same slope as curve D1, but is plotted to the right.2 points, A and B, are plotted in the middle of curve D1.A right pointing arrow indicates the change from curve D1 to curve D2.
Refer to Figure 3.1.If the product represented is an inferior good, an increase in income would be represented by a movement from
A)A to B.
B)B to A.
C)D1 to D2.
D)D2 to D1.
Unlock Deck
Unlock for access to all 314 flashcards in this deck.
Unlock Deck
k this deck
31
If the price of automobiles was to increase, then
A)the demand for gasoline would decrease.
B)the demand for gasoline would increase.
C)the supply of gasoline would increase.
D)the quantity demanded of gasoline would decrease.
A)the demand for gasoline would decrease.
B)the demand for gasoline would increase.
C)the supply of gasoline would increase.
D)the quantity demanded of gasoline would decrease.
Unlock Deck
Unlock for access to all 314 flashcards in this deck.
Unlock Deck
k this deck
32
The Internet has created a new category in the book selling market, namely, the "barely used" book.How does the availability of barely used books affect the market for new books?
A)The demand curve for new books shifts to the right.
B)The demand curve for new books shifts to the left.
C)The supply curve for new books shifts to the right.
D)The supply curve for new books shifts to the left.
A)The demand curve for new books shifts to the right.
B)The demand curve for new books shifts to the left.
C)The supply curve for new books shifts to the right.
D)The supply curve for new books shifts to the left.
Unlock Deck
Unlock for access to all 314 flashcards in this deck.
Unlock Deck
k this deck
33
Figure 3.1 Alt text for Figure 3.1: In figure 3.1, graph of the effect of an increase in population on the demand curve.
Long description for Figure 3.1: The x-axis is labelled, Quantity, and y-axis is labelled, Price.Curve Demand, D1, is a straight line which slopes down from the top left corner to the bottom right corner.Curve D2 follows the same slope as curve D1, but is plotted to the right.2 points, A and B, are plotted in the middle of curve D1.A right pointing arrow indicates the change from curve D1 to curve D2.
Refer to Figure 3.1.A decrease in the price of the product would be represented by a movement from
A)A to B.
B)B to A.
C)D1 to D2.
D)D2 to D1.
Alt text for Figure 3.1: In figure 3.1, graph of the effect of an increase in population on the demand curve.Long description for Figure 3.1: The x-axis is labelled, Quantity, and y-axis is labelled, Price.Curve Demand, D1, is a straight line which slopes down from the top left corner to the bottom right corner.Curve D2 follows the same slope as curve D1, but is plotted to the right.2 points, A and B, are plotted in the middle of curve D1.A right pointing arrow indicates the change from curve D1 to curve D2.
Refer to Figure 3.1.A decrease in the price of the product would be represented by a movement from
A)A to B.
B)B to A.
C)D1 to D2.
D)D2 to D1.
Unlock Deck
Unlock for access to all 314 flashcards in this deck.
Unlock Deck
k this deck
34
Studies have shown links between calcium consumption and a reduction in osteoporosis.How does this affect the market for calcium?
A)The calcium supply curve shifts to the right because of a change in tastes in favour of calcium.
B)The calcium demand curve shifts to the right because of a change in tastes in favour of calcium.
C)The calcium demand curve shifts to the left because this new information will increase the price of calcium.
D)The calcium supply curve shifts to the left because this new information will increase the price of calcium.
Unlock Deck
Unlock for access to all 314 flashcards in this deck.
Unlock Deck
k this deck
35
In January, buyers of gold expect that the price of gold will rise in February.What happens in the gold market in January, holding all else constant?
A)The supply curve shifts to the right.
B)The demand curve shifts to the left.
C)The demand curve shifts to the right.
D)The quantity demanded increases.
A)The supply curve shifts to the right.
B)The demand curve shifts to the left.
C)The demand curve shifts to the right.
D)The quantity demanded increases.
Unlock Deck
Unlock for access to all 314 flashcards in this deck.
Unlock Deck
k this deck
36
How does the increasing use of MP3 players affect the market for compact discs?
A)The demand curve for compact discs shifts to the right.
B)The supply curve for compact discs shifts to the left.
C)The supply curve for compact discs shifts to the right.
D)The demand curve for compact discs shifts to the left.
A)The demand curve for compact discs shifts to the right.
B)The supply curve for compact discs shifts to the left.
C)The supply curve for compact discs shifts to the right.
D)The demand curve for compact discs shifts to the left.
Unlock Deck
Unlock for access to all 314 flashcards in this deck.
Unlock Deck
k this deck
37
In June, buyers of titanium expect that the price of titanium will fall in July.What happens in the titanium market in June, holding everything else constant?
A)The demand curve shifts to the right.
B)The quantity demanded increases.
C)The quantity demanded decreases.
D)The demand curve shifts to the left.
A)The demand curve shifts to the right.
B)The quantity demanded increases.
C)The quantity demanded decreases.
D)The demand curve shifts to the left.
Unlock Deck
Unlock for access to all 314 flashcards in this deck.
Unlock Deck
k this deck
38
Suppose that when the price of raspberries increases, Lonnie increases his purchases of papayas.To Lonnie,
A)raspberries and papayas are complements.
B)raspberries and papayas are inferior goods.
C)raspberries and papayas are normal goods.
D)raspberries and papayas are substitutes.
A)raspberries and papayas are complements.
B)raspberries and papayas are inferior goods.
C)raspberries and papayas are normal goods.
D)raspberries and papayas are substitutes.
Unlock Deck
Unlock for access to all 314 flashcards in this deck.
Unlock Deck
k this deck
39
Tom Searchinger, a senior attorney at the Environmental Defense Fund, observed that generous U.S.farm subsidies have encouraged farmers to produce more corn and more wheat.How does this affect the market for fertilizer?
A)The supply of fertilizer increases.
B)The supply of fertilizer decreases.
C)The demand for fertilizer increases.
D)The demand for fertilizer decreases.
A)The supply of fertilizer increases.
B)The supply of fertilizer decreases.
C)The demand for fertilizer increases.
D)The demand for fertilizer decreases.
Unlock Deck
Unlock for access to all 314 flashcards in this deck.
Unlock Deck
k this deck
40
Figure 3.1 Alt text for Figure 3.1: In figure 3.1, graph of the effect of an increase in population on the demand curve.
Long description for Figure 3.1: The x-axis is labelled, Quantity, and y-axis is labelled, Price.Curve Demand, D1, is a straight line which slopes down from the top left corner to the bottom right corner.Curve D2 follows the same slope as curve D1, but is plotted to the right.2 points, A and B, are plotted in the middle of curve D1.A right pointing arrow indicates the change from curve D1 to curve D2.
Refer to Figure 3.1. An increase in population would be represented by a movement from
A) A to B.
B) B to A
C) D1 to D2.
D) D2 to D1.
Alt text for Figure 3.1: In figure 3.1, graph of the effect of an increase in population on the demand curve.Long description for Figure 3.1: The x-axis is labelled, Quantity, and y-axis is labelled, Price.Curve Demand, D1, is a straight line which slopes down from the top left corner to the bottom right corner.Curve D2 follows the same slope as curve D1, but is plotted to the right.2 points, A and B, are plotted in the middle of curve D1.A right pointing arrow indicates the change from curve D1 to curve D2.
Refer to Figure 3.1. An increase in population would be represented by a movement from
A) A to B.
B) B to A
C) D1 to D2.
D) D2 to D1.
Unlock Deck
Unlock for access to all 314 flashcards in this deck.
Unlock Deck
k this deck
41
The market for energy drinks has become very competitive.The increase in competition in this market is an example of how the market responds to
A)decreases in the price of coffee (a substitute for the product).
B)increases in income.
C)changes in population.
D)changes in consumer tastes.
A)decreases in the price of coffee (a substitute for the product).
B)increases in income.
C)changes in population.
D)changes in consumer tastes.
Unlock Deck
Unlock for access to all 314 flashcards in this deck.
Unlock Deck
k this deck
42
If you are considering buying an energy drink, and you choose Beaver Buzz Energy only because the price is lower, then you consider
A)Red Bull and Beaver Buzz to be complements.
B)Red Bull and Beaver Buzz to be substitutes.
C)Red Bull to be a normal good and Beaver Buzz to be an inferior good.
D)Red Bull to be an inferior good and Beaver Buzz to be a normal good.
A)Red Bull and Beaver Buzz to be complements.
B)Red Bull and Beaver Buzz to be substitutes.
C)Red Bull to be a normal good and Beaver Buzz to be an inferior good.
D)Red Bull to be an inferior good and Beaver Buzz to be a normal good.
Unlock Deck
Unlock for access to all 314 flashcards in this deck.
Unlock Deck
k this deck
43
The income effect of a price change refers to the change in the quantity demanded of a good that results from a change in purchasing power as a result of the price change.
Unlock Deck
Unlock for access to all 314 flashcards in this deck.
Unlock Deck
k this deck
44
Which of the following is expected to occur as the baby-boom generation ages?
A)The demand for baby clothes should increase.
B)The demand for prescription drugs should decrease.
C)The demand for medical services should increase.
D)The demand for larger houses should increase.
A)The demand for baby clothes should increase.
B)The demand for prescription drugs should decrease.
C)The demand for medical services should increase.
D)The demand for larger houses should increase.
Unlock Deck
Unlock for access to all 314 flashcards in this deck.
Unlock Deck
k this deck
45
The law of demand implies, holding everything else constant, that as the price of yogurt
A)increases, the demand for yogurt will increase.
B)increases, the quantity of yogurt demanded will decrease.
C)decreases, the quantity of yogurt demanded will decrease.
D)decreases, the demand for yogurt will increase.
A)increases, the demand for yogurt will increase.
B)increases, the quantity of yogurt demanded will decrease.
C)decreases, the quantity of yogurt demanded will decrease.
D)decreases, the demand for yogurt will increase.
Unlock Deck
Unlock for access to all 314 flashcards in this deck.
Unlock Deck
k this deck
46
By drawing a demand curve with price on the vertical axis and quantity on the horizontal axis, economists assume that the most important determinant of the demand for a good is
A)consumer income.
B)consumer tastes and preferences.
C)the price of the good.
D)the quality of the good.
A)consumer income.
B)consumer tastes and preferences.
C)the price of the good.
D)the quality of the good.
Unlock Deck
Unlock for access to all 314 flashcards in this deck.
Unlock Deck
k this deck
47
What is the ceteris paribus condition?
Unlock Deck
Unlock for access to all 314 flashcards in this deck.
Unlock Deck
k this deck
48
For each of the following pairs of products, state which are complements, which are substitutes, and which are unrelated.
a.digital camera and memory stick
b.7Up and Mountain Dew
c.swimsuits and flip-flops
d.Tylenol and cat food
e.photocopier and paper
a.digital camera and memory stick
b.7Up and Mountain Dew
c.swimsuits and flip-flops
d.Tylenol and cat food
e.photocopier and paper
Unlock Deck
Unlock for access to all 314 flashcards in this deck.
Unlock Deck
k this deck
49
When deciding on which new products to develop, a firm must devote people, time, and money to designing a new product.Because any firm has only limited resources, it
A)should wait until its competitors develop a similar product before deciding on devoting resources to its own product development.
B)is not able to develop more than one new product at a time.
C)must be certain that the product it chooses to develop will be successful or it will not be able to stay in business.
D)faces a trade-off, because resources used to develop one product will not be available to develop another product.
Unlock Deck
Unlock for access to all 314 flashcards in this deck.
Unlock Deck
k this deck
50
Chips and salsa are complements.If the price of salsa decreases, the demand for chips will increase.
Unlock Deck
Unlock for access to all 314 flashcards in this deck.
Unlock Deck
k this deck
51
Explain the difference between a normal good and an inferior good.
Unlock Deck
Unlock for access to all 314 flashcards in this deck.
Unlock Deck
k this deck
52
The income effect explains why there is an inverse relationship between the price of a product and the quantity of the product demanded.
Unlock Deck
Unlock for access to all 314 flashcards in this deck.
Unlock Deck
k this deck
53
A normal good is a good for which the demanded increases as income decreases, holding everything else constant.
Unlock Deck
Unlock for access to all 314 flashcards in this deck.
Unlock Deck
k this deck
54
If consumers believe the price of iPads will decrease in the future, this will cause the demand for iPads to decrease now.
Unlock Deck
Unlock for access to all 314 flashcards in this deck.
Unlock Deck
k this deck
55
The portion of the population over age 64 has risen from 8% in 1971 to 16% in 2015. Which of the goods is most likely to see an increase in demand as a result?
A)health care
B)university education
C)energy drinks
D)cars
A)health care
B)university education
C)energy drinks
D)cars
Unlock Deck
Unlock for access to all 314 flashcards in this deck.
Unlock Deck
k this deck
56
What are the two effects that explain the Law of Demand? Briefly explain each effect.
Unlock Deck
Unlock for access to all 314 flashcards in this deck.
Unlock Deck
k this deck
57
A demand curve shows the relationship between
A)the price of a product and the quantity of the product demanded.
B)the amount of a product sellers are willing to sell at a particular price and the amount consumers are willing to buy at that price.
C)the quantity that consumers are willing and able to buy and the quantity that sellers are willing and able to offer.
D)the price of a produce and the demand for the product.
Unlock Deck
Unlock for access to all 314 flashcards in this deck.
Unlock Deck
k this deck
58
A(n)________ is represented by a rightward shift of the demand curve while a(n)________ is represented by a movement along a given demand curve.
A)increase in demand; decrease in demand
B)increase in demand; increase in quantity demanded
C)decrease in demand; decrease in quantity demanded
D)increase in quantity demanded; increase in demand
A)increase in demand; decrease in demand
B)increase in demand; increase in quantity demanded
C)decrease in demand; decrease in quantity demanded
D)increase in quantity demanded; increase in demand
Unlock Deck
Unlock for access to all 314 flashcards in this deck.
Unlock Deck
k this deck
59
As baby boomers age, we would expect
A)jobs in health care to increase.
B)jobs in health care to decline at a faster rate than overall jobs in the economy.
C)demand for medical services to decline, which would result in a decline in available jobs in the medical field.
D)demand for large houses to increase.
A)jobs in health care to increase.
B)jobs in health care to decline at a faster rate than overall jobs in the economy.
C)demand for medical services to decline, which would result in a decline in available jobs in the medical field.
D)demand for large houses to increase.
Unlock Deck
Unlock for access to all 314 flashcards in this deck.
Unlock Deck
k this deck
60
If, in response to a decrease in the price of coffee, the quantity demanded of coffee increases, economists would describe this as
A)an increase in demand.
B)an increase in quantity demanded.
C)a change in consumer income.
D)an increase in consumers' taste for coffee.
A)an increase in demand.
B)an increase in quantity demanded.
C)a change in consumer income.
D)an increase in consumers' taste for coffee.
Unlock Deck
Unlock for access to all 314 flashcards in this deck.
Unlock Deck
k this deck
61
Table 3.2
Refer to Table 3.2.The table above shows the demand schedules for Kona coffee of two individuals (Luke and Ravi)and the rest of the market.If the price of Kona coffee rises from $4 to $5, the market quantity demanded would
A)decrease by 35 kg.
B)increase by 115 kg.
C)increase by 35 kg.
D)decrease by 115 kg.
Unlock Deck
Unlock for access to all 314 flashcards in this deck.
Unlock Deck
k this deck
62
If the price of potato chips falls, the substitution effect due to the price change will cause
A)an increase in the demand for potato chips.
B)an increase in the demand for corn chips, a substitute for potato chips.
C)an increase in the quantity of potato chips demanded.
D)a decrease in the quantity of potato chips demanded.
A)an increase in the demand for potato chips.
B)an increase in the demand for corn chips, a substitute for potato chips.
C)an increase in the quantity of potato chips demanded.
D)a decrease in the quantity of potato chips demanded.
Unlock Deck
Unlock for access to all 314 flashcards in this deck.
Unlock Deck
k this deck
63
The substitution effect of a price change refers to
A)the change in quantity demanded that results from a change in price making a good more or less expensive relative to other goods that are substitutes.
B)the shift of a demand curve when the price of a substitute good changes.
C)the movement along the demand curve due to a change in purchasing power brought about by the price change.
D)the shift in the demand curve due to a change in purchasing power brought about by the price change.
Unlock Deck
Unlock for access to all 314 flashcards in this deck.
Unlock Deck
k this deck
64
Which of the following will not shift the demand curve for a good?
A)an increase in population
B)an increase in the price of the good
C)a decrease in the price of a substitute good
D)an increase in consumer incomes
A)an increase in population
B)an increase in the price of the good
C)a decrease in the price of a substitute good
D)an increase in consumer incomes
Unlock Deck
Unlock for access to all 314 flashcards in this deck.
Unlock Deck
k this deck
65
If a decrease in income leads to in a decrease in the demand for ice cream, then ice cream is
A)a normal good.
B)a neutral good.
C)a complement.
D)a necessity.
A)a normal good.
B)a neutral good.
C)a complement.
D)a necessity.
Unlock Deck
Unlock for access to all 314 flashcards in this deck.
Unlock Deck
k this deck
66
The ________ effect of a price change refers to the impact a change in the price of a good has on a consumer's purchasing power.
A)income
B)substitution
C)demographics
D)ceteris paribus
A)income
B)substitution
C)demographics
D)ceteris paribus
Unlock Deck
Unlock for access to all 314 flashcards in this deck.
Unlock Deck
k this deck
67
A ________ demand curve for shampoo would be caused by a change in the price of shampoo.
A)rightward shift of the
B)leftward shift of the
C)movement along the
D)positively sloped
A)rightward shift of the
B)leftward shift of the
C)movement along the
D)positively sloped
Unlock Deck
Unlock for access to all 314 flashcards in this deck.
Unlock Deck
k this deck
68
Figure 3.2 Alt text for Figure 3.2: In figure 3.2, a graph of the effect of an increase in the price of a complement on demand curve.
Long description for Figure 3.2: The x-axis is labelled, Quantity, and y-axis is labelled, Price.Curve Demand, D1, is a straight line which slopes down from the top left corner to the bottom right corner.Curve D2 follows the same slope as curve D1, but is plotted to the right.2 points, A and B, are plotted in the middle of curve D1.A right pointing arrow indicates the change from curve D1 to curve D2.
Refer to Figure 3.2.An increase in the price of the product would be represented by a movement from
A)A to B.
B)B to A.
C)D1 to D2.
D)D2 to D1.
Alt text for Figure 3.2: In figure 3.2, a graph of the effect of an increase in the price of a complement on demand curve.Long description for Figure 3.2: The x-axis is labelled, Quantity, and y-axis is labelled, Price.Curve Demand, D1, is a straight line which slopes down from the top left corner to the bottom right corner.Curve D2 follows the same slope as curve D1, but is plotted to the right.2 points, A and B, are plotted in the middle of curve D1.A right pointing arrow indicates the change from curve D1 to curve D2.
Refer to Figure 3.2.An increase in the price of the product would be represented by a movement from
A)A to B.
B)B to A.
C)D1 to D2.
D)D2 to D1.
Unlock Deck
Unlock for access to all 314 flashcards in this deck.
Unlock Deck
k this deck
69
The phrase "demand has increased" means that
A)a demand curve has shifted to the left.
B)there has been an upward movement along a demand curve.
C)there has been a downward movement along a demand curve.
D)a demand curve has shifted to the right.
A)a demand curve has shifted to the left.
B)there has been an upward movement along a demand curve.
C)there has been a downward movement along a demand curve.
D)a demand curve has shifted to the right.
Unlock Deck
Unlock for access to all 314 flashcards in this deck.
Unlock Deck
k this deck
70
Suppose that a recent study finds that stricter alcohol policies, such as raising the price of alcohol or banning the sale of alcohol close to university campuses, decrease the number of students who use marijuana.On the basis of this information, how would you describe alcohol and marijuana?
A)The two goods are substitutes in consumption.
B)There is no relationship between the two goods.
C)The two goods are complements in consumption.
D)They are both luxury goods.
A)The two goods are substitutes in consumption.
B)There is no relationship between the two goods.
C)The two goods are complements in consumption.
D)They are both luxury goods.
Unlock Deck
Unlock for access to all 314 flashcards in this deck.
Unlock Deck
k this deck
71
The more substitutes there are for a good
A)the flatter the demand curve will be.
B)the steeper the demand curve will be.
C)the larger the income effect.
D)the less important the price of the good will be determining demand.
A)the flatter the demand curve will be.
B)the steeper the demand curve will be.
C)the larger the income effect.
D)the less important the price of the good will be determining demand.
Unlock Deck
Unlock for access to all 314 flashcards in this deck.
Unlock Deck
k this deck
72
If a decrease in income leads to an increase in the demand for macaroni, then macaroni is
A)an inferior good.
B)a neutral good.
C)a necessity.
D)a normal good.
A)an inferior good.
B)a neutral good.
C)a necessity.
D)a normal good.
Unlock Deck
Unlock for access to all 314 flashcards in this deck.
Unlock Deck
k this deck
73
How has the growing popularity of on-line shopping affected the market for clothing at retail department stores?
A)The demand curve for clothing at retail department stores has shifted to the right.
B)The demand curve for clothing at retail department stores has shifted to the left.
C)The supply curve for clothing at retail department stores has shifted to the right.
D)The supply curve for clothing at retail department stores has shifted to the left.
Unlock Deck
Unlock for access to all 314 flashcards in this deck.
Unlock Deck
k this deck
74
Table 3.2
Refer to Table 3.2.The table above shows the demand schedules for Kona coffee of two individuals (Luke and Ravi)and the rest of the market.At a price of $6, the quantity demanded in the market would be
A)36 kg.
B)68 kg.
C)89 kg.
D)123 kg.
Refer to Table 3.2.The table above shows the demand schedules for Kona coffee of two individuals (Luke and Ravi)and the rest of the market.At a price of $6, the quantity demanded in the market would be
A)36 kg.
B)68 kg.
C)89 kg.
D)123 kg.
Unlock Deck
Unlock for access to all 314 flashcards in this deck.
Unlock Deck
k this deck
75
Figure 3.2 Alt text for Figure 3.2: In figure 3.2, a graph of the effect of an increase in the price of a complement on demand curve.
Long description for Figure 3.2: The x-axis is labelled, Quantity, and y-axis is labelled, Price.Curve Demand, D1, is a straight line which slopes down from the top left corner to the bottom right corner.Curve D2 follows the same slope as curve D1, but is plotted to the right.2 points, A and B, are plotted in the middle of curve D1.A right pointing arrow indicates the change from curve D1 to curve D2.
Refer to Figure 3.2.An increase in the price of a complement would be represented by a movement from
A)A to B.
B)B to A.
C)D1 to D2.
D)D2 to D1.
Alt text for Figure 3.2: In figure 3.2, a graph of the effect of an increase in the price of a complement on demand curve.Long description for Figure 3.2: The x-axis is labelled, Quantity, and y-axis is labelled, Price.Curve Demand, D1, is a straight line which slopes down from the top left corner to the bottom right corner.Curve D2 follows the same slope as curve D1, but is plotted to the right.2 points, A and B, are plotted in the middle of curve D1.A right pointing arrow indicates the change from curve D1 to curve D2.
Refer to Figure 3.2.An increase in the price of a complement would be represented by a movement from
A)A to B.
B)B to A.
C)D1 to D2.
D)D2 to D1.
Unlock Deck
Unlock for access to all 314 flashcards in this deck.
Unlock Deck
k this deck
76
Figure 3.2 Alt text for Figure 3.2: In figure 3.2, a graph of the effect of an increase in the price of a complement on demand curve.
Long description for Figure 3.2: The x-axis is labelled, Quantity, and y-axis is labelled, Price.Curve Demand, D1, is a straight line which slopes down from the top left corner to the bottom right corner.Curve D2 follows the same slope as curve D1, but is plotted to the right.2 points, A and B, are plotted in the middle of curve D1.A right pointing arrow indicates the change from curve D1 to curve D2.
Refer to Figure 3.2.If the product represented is a normal good, an increase in income would be represented by a movement from
A)A to B.
B)B to A.
C)D1 to D2.
D)D2 to D1.
Alt text for Figure 3.2: In figure 3.2, a graph of the effect of an increase in the price of a complement on demand curve.Long description for Figure 3.2: The x-axis is labelled, Quantity, and y-axis is labelled, Price.Curve Demand, D1, is a straight line which slopes down from the top left corner to the bottom right corner.Curve D2 follows the same slope as curve D1, but is plotted to the right.2 points, A and B, are plotted in the middle of curve D1.A right pointing arrow indicates the change from curve D1 to curve D2.
Refer to Figure 3.2.If the product represented is a normal good, an increase in income would be represented by a movement from
A)A to B.
B)B to A.
C)D1 to D2.
D)D2 to D1.
Unlock Deck
Unlock for access to all 314 flashcards in this deck.
Unlock Deck
k this deck
77
Figure 3.2 Alt text for Figure 3.2: In figure 3.2, a graph of the effect of an increase in the price of a complement on demand curve.
Long description for Figure 3.2: The x-axis is labelled, Quantity, and y-axis is labelled, Price.Curve Demand, D1, is a straight line which slopes down from the top left corner to the bottom right corner.Curve D2 follows the same slope as curve D1, but is plotted to the right.2 points, A and B, are plotted in the middle of curve D1.A right pointing arrow indicates the change from curve D1 to curve D2.
Refer to Figure 3.2.A decrease in the expected future price of the product would be represented by a movement from
A)A to B.
B)B to A.
C)D1 to D2.
D)D2 to D1.
Alt text for Figure 3.2: In figure 3.2, a graph of the effect of an increase in the price of a complement on demand curve.Long description for Figure 3.2: The x-axis is labelled, Quantity, and y-axis is labelled, Price.Curve Demand, D1, is a straight line which slopes down from the top left corner to the bottom right corner.Curve D2 follows the same slope as curve D1, but is plotted to the right.2 points, A and B, are plotted in the middle of curve D1.A right pointing arrow indicates the change from curve D1 to curve D2.
Refer to Figure 3.2.A decrease in the expected future price of the product would be represented by a movement from
A)A to B.
B)B to A.
C)D1 to D2.
D)D2 to D1.
Unlock Deck
Unlock for access to all 314 flashcards in this deck.
Unlock Deck
k this deck
78
A change in which variable will change the market demand for a product?
A)the price of the product
B)expected future prices
C)the number of firms in the market
D)the quantity of the product supplied
A)the price of the product
B)expected future prices
C)the number of firms in the market
D)the quantity of the product supplied
Unlock Deck
Unlock for access to all 314 flashcards in this deck.
Unlock Deck
k this deck
79
The income effect of a price change results in a
A)shift of the demand curve when income changes.
B)movement along the demand curve due to a change in relative prices.
C)shift of the demand curve due to a change in purchasing power brought about by the price change.
D)movement along the demand curve due to a change in purchasing power brought about by the price change.
Unlock Deck
Unlock for access to all 314 flashcards in this deck.
Unlock Deck
k this deck
80
Holding everything else constant, a decrease in the price of GPS systems will result in
A)a decrease in the quantity of GPS systems demanded.
B)an increase in the demand for GPS systems.
C)a decrease in the supply of GPS systems.
D)an increase in the quantity of GPS systems demanded.
A)a decrease in the quantity of GPS systems demanded.
B)an increase in the demand for GPS systems.
C)a decrease in the supply of GPS systems.
D)an increase in the quantity of GPS systems demanded.
Unlock Deck
Unlock for access to all 314 flashcards in this deck.
Unlock Deck
k this deck
Unlock Deck
Unlock for access to all 314 flashcards in this deck.


