Deck 7: Long-Run Economic Growth: Sources and Policies
Full screen (f)
Question
Question
Question
Question
Question
Question
Question
Question
Question
Question
Question
Question
Question
Question
Question
Question
Question
Question
Question
Question
Question
Question
Question
Question
Which of the following accurately describes economic growth and standards of living between  and 1300 CE?
A)Standards of living in 1300 CE were substantially better than what they were in 1,000,000 BCE.
B)Standards of living substantially declined from 1,000,000 BCE to 1300 CE.
C)Significant economic growth took place between 1,000,000 BCE and 1300 CE.
D)No sustained economic growth occurred between 1,000,000 BCE and 1300 CE.
E)Standards of living grew slowly, but steadily between 1,000,000 BCE and 1300 CE.
and 1300 CE?A)Standards of living in 1300 CE were substantially better than what they were in 1,000,000 BCE.
B)Standards of living substantially declined from 1,000,000 BCE to 1300 CE.
C)Significant economic growth took place between 1,000,000 BCE and 1300 CE.
D)No sustained economic growth occurred between 1,000,000 BCE and 1300 CE.
E)Standards of living grew slowly, but steadily between 1,000,000 BCE and 1300 CE.
Question
Question
Question
Question
Question
Question
Question
Question
Question
Question
Question
Question
Question
Question
Question
Table 7.1 
Refer to Table 7.1.Based on the table above, which country has a higher standard of living and why?
A)Sweden has a higher standard of living because its GDP is higher.
B)Ireland has a higher standard of living because its GDP per capita is higher.
C)Sweden has a higher standard of living because its GDP per capita is higher.
D)Ireland has a higher standard of living because growth in GDP is greater in Ireland than in Sweden.
E)Ireland and Sweden have almost identical standards of living.
Question
Question
Question
Question
Figure 7.1 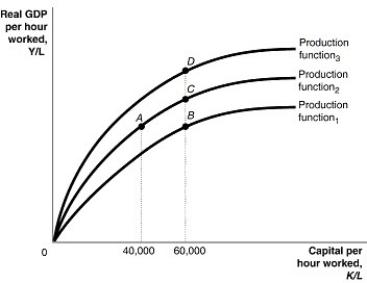 Alt text for Figure 7.1: In figure 7.1, a graph comparing capital per hour worked and real GDP per hour worked.
Long description for Figure 7.1: The x-axis is labelled, capital per hour worked, K/L, with values 40,000 and 60,000 marked.The y-axis is labelled, real GDP per hour worked, Y/L, with 0 at the vertex.3 concave curves, each originating from the vertex are shown.4 points A, B, C, and D are plotted such that point A has 40,000 as the x coordinate, and points B, C, and D have 60,000 as the x coordinate.The 3 curves pass through these points.The curve labelled, Production function 1, passes through point B.The curve labelled, Production function 2, passes through points A and C.The curve labelled, Production function 3, passes through point D.
Refer to Figure 7.1.Using the per-worker production function in the figure above, the largest changes in an economy's standard of living would be achieved by a movement from
A)A to B to C.
B)B to C to D.
C)C to B to A.
D)D to C to B.
E)C to D to A.
Alt text for Figure 7.1: In figure 7.1, a graph comparing capital per hour worked and real GDP per hour worked.Long description for Figure 7.1: The x-axis is labelled, capital per hour worked, K/L, with values 40,000 and 60,000 marked.The y-axis is labelled, real GDP per hour worked, Y/L, with 0 at the vertex.3 concave curves, each originating from the vertex are shown.4 points A, B, C, and D are plotted such that point A has 40,000 as the x coordinate, and points B, C, and D have 60,000 as the x coordinate.The 3 curves pass through these points.The curve labelled, Production function 1, passes through point B.The curve labelled, Production function 2, passes through points A and C.The curve labelled, Production function 3, passes through point D.
Refer to Figure 7.1.Using the per-worker production function in the figure above, the largest changes in an economy's standard of living would be achieved by a movement from
A)A to B to C.
B)B to C to D.
C)C to B to A.
D)D to C to B.
E)C to D to A.
Question
Question
Figure 7.1 Alt text for Figure 7.1: In figure 7.1, a graph comparing capital per hour worked and real GDP per hour worked.
Long description for Figure 7.1: The x-axis is labelled, capital per hour worked, K/L, with values 40,000 and 60,000 marked.The y-axis is labelled, real GDP per hour worked, Y/L, with 0 at the vertex.3 concave curves, each originating from the vertex are shown.4 points A, B, C, and D are plotted such that point A has 40,000 as the x coordinate, and points B, C, and D have 60,000 as the x coordinate.The 3 curves pass through these points.The curve labelled, Production function 1, passes through point B.The curve labelled, Production function 2, passes through points A and C.The curve labelled, Production function 3, passes through point D.
Refer to Figure 7.1.Within a country, the impact of wars and revolutions and their subsequent destruction of capital is reflected in the per-worker production function in the figure above by a movement from
A)A to B.
B)B to C.
C)B to A.
D)C to A.
E)B to D.
Alt text for Figure 7.1: In figure 7.1, a graph comparing capital per hour worked and real GDP per hour worked.Long description for Figure 7.1: The x-axis is labelled, capital per hour worked, K/L, with values 40,000 and 60,000 marked.The y-axis is labelled, real GDP per hour worked, Y/L, with 0 at the vertex.3 concave curves, each originating from the vertex are shown.4 points A, B, C, and D are plotted such that point A has 40,000 as the x coordinate, and points B, C, and D have 60,000 as the x coordinate.The 3 curves pass through these points.The curve labelled, Production function 1, passes through point B.The curve labelled, Production function 2, passes through points A and C.The curve labelled, Production function 3, passes through point D.
Refer to Figure 7.1.Within a country, the impact of wars and revolutions and their subsequent destruction of capital is reflected in the per-worker production function in the figure above by a movement from
A)A to B.
B)B to C.
C)B to A.
D)C to A.
E)B to D.
Question
Question
Question
Question
Figure 7.1 Alt text for Figure 7.1: In figure 7.1, a graph comparing capital per hour worked and real GDP per hour worked.
Long description for Figure 7.1: The x-axis is labelled, capital per hour worked, K/L, with values 40,000 and 60,000 marked.The y-axis is labelled, real GDP per hour worked, Y/L, with 0 at the vertex.3 concave curves, each originating from the vertex are shown.4 points A, B, C, and D are plotted such that point A has 40,000 as the x coordinate, and points B, C, and D have 60,000 as the x coordinate.The 3 curves pass through these points.The curve labelled, Production function 1, passes through point B.The curve labelled, Production function 2, passes through points A and C.The curve labelled, Production function 3, passes through point D.
Refer to Figure 7.1.Technological change is illustrated in the per-worker production function in the figure above by a movement from
A)A to B.
B)B to C.
C)B to A.
D)D to C.
E)D to A.
Alt text for Figure 7.1: In figure 7.1, a graph comparing capital per hour worked and real GDP per hour worked.Long description for Figure 7.1: The x-axis is labelled, capital per hour worked, K/L, with values 40,000 and 60,000 marked.The y-axis is labelled, real GDP per hour worked, Y/L, with 0 at the vertex.3 concave curves, each originating from the vertex are shown.4 points A, B, C, and D are plotted such that point A has 40,000 as the x coordinate, and points B, C, and D have 60,000 as the x coordinate.The 3 curves pass through these points.The curve labelled, Production function 1, passes through point B.The curve labelled, Production function 2, passes through points A and C.The curve labelled, Production function 3, passes through point D.
Refer to Figure 7.1.Technological change is illustrated in the per-worker production function in the figure above by a movement from
A)A to B.
B)B to C.
C)B to A.
D)D to C.
E)D to A.
Question
Question
Table 7.2 
Refer to Table 7.2.Calculate the GDP per capita for each country in the table.Which country has the highest standard of living? Why?
Refer to Table 7.2.Calculate the GDP per capita for each country in the table.Which country has the highest standard of living? Why?
Question
Question
Question
Question
Figure 7.1 Alt text for Figure 7.1: In figure 7.1, a graph comparing capital per hour worked and real GDP per hour worked.
Long description for Figure 7.1: The x-axis is labelled, capital per hour worked, K/L, with values 40,000 and 60,000 marked.The y-axis is labelled, real GDP per hour worked, Y/L, with 0 at the vertex.3 concave curves, each originating from the vertex are shown.4 points A, B, C, and D are plotted such that point A has 40,000 as the x coordinate, and points B, C, and D have 60,000 as the x coordinate.The 3 curves pass through these points.The curve labelled, Production function 1, passes through point B.The curve labelled, Production function 2, passes through points A and C.The curve labelled, Production function 3, passes through point D.
Refer to Figure 7.1.Diminishing marginal returns is illustrated in the per-worker production function in the figure above by a movement from
A)A to C.
B)B to C.
C)C to D.
D)D to C.
E)A to D.
Alt text for Figure 7.1: In figure 7.1, a graph comparing capital per hour worked and real GDP per hour worked.Long description for Figure 7.1: The x-axis is labelled, capital per hour worked, K/L, with values 40,000 and 60,000 marked.The y-axis is labelled, real GDP per hour worked, Y/L, with 0 at the vertex.3 concave curves, each originating from the vertex are shown.4 points A, B, C, and D are plotted such that point A has 40,000 as the x coordinate, and points B, C, and D have 60,000 as the x coordinate.The 3 curves pass through these points.The curve labelled, Production function 1, passes through point B.The curve labelled, Production function 2, passes through points A and C.The curve labelled, Production function 3, passes through point D.
Refer to Figure 7.1.Diminishing marginal returns is illustrated in the per-worker production function in the figure above by a movement from
A)A to C.
B)B to C.
C)C to D.
D)D to C.
E)A to D.
Question
Figure 7.1 Alt text for Figure 7.1: In figure 7.1, a graph comparing capital per hour worked and real GDP per hour worked.
Long description for Figure 7.1: The x-axis is labelled, capital per hour worked, K/L, with values 40,000 and 60,000 marked.The y-axis is labelled, real GDP per hour worked, Y/L, with 0 at the vertex.3 concave curves, each originating from the vertex are shown.4 points A, B, C, and D are plotted such that point A has 40,000 as the x coordinate, and points B, C, and D have 60,000 as the x coordinate.The 3 curves pass through these points.The curve labelled, Production function 1, passes through point B.The curve labelled, Production function 2, passes through points A and C.The curve labelled, Production function 3, passes through point D.
Refer to Figure 7.1.Suppose the per-worker production function in the figure above represents the production function for the Canadian economy.If Canada decided to double its support of university research, this would cause a movement from
A)A to B.
B)B to C.
C)B to A.
D)D to C.
E)C to A.
Alt text for Figure 7.1: In figure 7.1, a graph comparing capital per hour worked and real GDP per hour worked.Long description for Figure 7.1: The x-axis is labelled, capital per hour worked, K/L, with values 40,000 and 60,000 marked.The y-axis is labelled, real GDP per hour worked, Y/L, with 0 at the vertex.3 concave curves, each originating from the vertex are shown.4 points A, B, C, and D are plotted such that point A has 40,000 as the x coordinate, and points B, C, and D have 60,000 as the x coordinate.The 3 curves pass through these points.The curve labelled, Production function 1, passes through point B.The curve labelled, Production function 2, passes through points A and C.The curve labelled, Production function 3, passes through point D.
Refer to Figure 7.1.Suppose the per-worker production function in the figure above represents the production function for the Canadian economy.If Canada decided to double its support of university research, this would cause a movement from
A)A to B.
B)B to C.
C)B to A.
D)D to C.
E)C to A.
Question
Question
Question
Question
Question
Question
Figure 7.1 Alt text for Figure 7.1: In figure 7.1, a graph comparing capital per hour worked and real GDP per hour worked.
Long description for Figure 7.1: The x-axis is labelled, capital per hour worked, K/L, with values 40,000 and 60,000 marked.The y-axis is labelled, real GDP per hour worked, Y/L, with 0 at the vertex.3 concave curves, each originating from the vertex are shown.4 points A, B, C, and D are plotted such that point A has 40,000 as the x coordinate, and points B, C, and D have 60,000 as the x coordinate.The 3 curves pass through these points.The curve labelled, Production function 1, passes through point B.The curve labelled, Production function 2, passes through points A and C.The curve labelled, Production function 3, passes through point D.
Refer to Figure 7.1.Many countries in Africa strongly discouraged and prohibited foreign direct investment in the 1950s and 1960s.By doing so, these countries were essentially preventing a moment from
A)A to B.
B)B to C.
C)B to A.
D)D to C.
E)D to A.
Alt text for Figure 7.1: In figure 7.1, a graph comparing capital per hour worked and real GDP per hour worked.Long description for Figure 7.1: The x-axis is labelled, capital per hour worked, K/L, with values 40,000 and 60,000 marked.The y-axis is labelled, real GDP per hour worked, Y/L, with 0 at the vertex.3 concave curves, each originating from the vertex are shown.4 points A, B, C, and D are plotted such that point A has 40,000 as the x coordinate, and points B, C, and D have 60,000 as the x coordinate.The 3 curves pass through these points.The curve labelled, Production function 1, passes through point B.The curve labelled, Production function 2, passes through points A and C.The curve labelled, Production function 3, passes through point D.
Refer to Figure 7.1.Many countries in Africa strongly discouraged and prohibited foreign direct investment in the 1950s and 1960s.By doing so, these countries were essentially preventing a moment from
A)A to B.
B)B to C.
C)B to A.
D)D to C.
E)D to A.
Question
Question
Figure 7.2 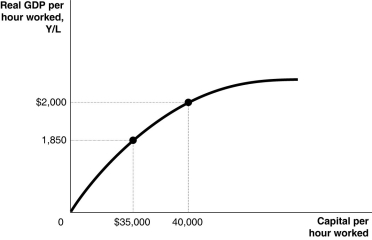 Alt text for Figure 7.2: In figure 7.2, a graph comparing capital per hour worked and real GDP per hour worked.
Long description for Figure 7.2: The x-axis is labelled, capital per hour worked.The y-axis is labelled, real GDP per hour worked, Y/L.A concave curve originates from 0 at the vertex and passes through 2 points ($35,000, 1,850)and (40,000, $2000), toward the end of the x-axis.These 2 points are connected to their respective coordinates on the x-axis and y-axis with dotted lines.
Refer to Figure 7.2.Assuming no technological change, if Canada increases capital per hour worked by $40,000 every year between 2015 and 2020, we would expect to see
A)real GDP per hour worked will increase by the same increment each year between 2015 and 2020.
B)real GDP per hour worked will be lower in 2020 than it was in 2015.
C)the per-worker production function will get flatter over time.
D)the per-worker production function will shift up every year there is increase in capital per hour worked.
E)the per worker production function will become steeper every year.
Alt text for Figure 7.2: In figure 7.2, a graph comparing capital per hour worked and real GDP per hour worked.Long description for Figure 7.2: The x-axis is labelled, capital per hour worked.The y-axis is labelled, real GDP per hour worked, Y/L.A concave curve originates from 0 at the vertex and passes through 2 points ($35,000, 1,850)and (40,000, $2000), toward the end of the x-axis.These 2 points are connected to their respective coordinates on the x-axis and y-axis with dotted lines.
Refer to Figure 7.2.Assuming no technological change, if Canada increases capital per hour worked by $40,000 every year between 2015 and 2020, we would expect to see
A)real GDP per hour worked will increase by the same increment each year between 2015 and 2020.
B)real GDP per hour worked will be lower in 2020 than it was in 2015.
C)the per-worker production function will get flatter over time.
D)the per-worker production function will shift up every year there is increase in capital per hour worked.
E)the per worker production function will become steeper every year.
Question
Question
Question
Question
Figure 7.2 Alt text for Figure 7.2: In figure 7.2, a graph comparing capital per hour worked and real GDP per hour worked.
Long description for Figure 7.2: The x-axis is labelled, capital per hour worked.The y-axis is labelled, real GDP per hour worked, Y/L.A concave curve originates from 0 at the vertex and passes through 2 points ($35,000, 1,850)and (40,000, $2000), toward the end of the x-axis.These 2 points are connected to their respective coordinates on the x-axis and y-axis with dotted lines.
Refer to Figure 7.2.Based on the per-worker production function above, if the Canadian economy raises capital per hour worked from $35,000 to $40,000, by how much will real GDP per hour worked increase?
A)$150
B)$1,850
C)$2,000
D)$5,000
E)$35,000
Alt text for Figure 7.2: In figure 7.2, a graph comparing capital per hour worked and real GDP per hour worked.Long description for Figure 7.2: The x-axis is labelled, capital per hour worked.The y-axis is labelled, real GDP per hour worked, Y/L.A concave curve originates from 0 at the vertex and passes through 2 points ($35,000, 1,850)and (40,000, $2000), toward the end of the x-axis.These 2 points are connected to their respective coordinates on the x-axis and y-axis with dotted lines.
Refer to Figure 7.2.Based on the per-worker production function above, if the Canadian economy raises capital per hour worked from $35,000 to $40,000, by how much will real GDP per hour worked increase?
A)$150
B)$1,850
C)$2,000
D)$5,000
E)$35,000
Question
Question
Figure 7.1 Alt text for Figure 7.1: In figure 7.1, a graph comparing capital per hour worked and real GDP per hour worked.
Long description for Figure 7.1: The x-axis is labelled, capital per hour worked, K/L, with values 40,000 and 60,000 marked.The y-axis is labelled, real GDP per hour worked, Y/L, with 0 at the vertex.3 concave curves, each originating from the vertex are shown.4 points A, B, C, and D are plotted such that point A has 40,000 as the x coordinate, and points B, C, and D have 60,000 as the x coordinate.The 3 curves pass through these points.The curve labelled, Production function 1, passes through point B.The curve labelled, Production function 2, passes through points A and C.The curve labelled, Production function 3, passes through point D.
Refer to Figure 7.1. Which of the following could cause an economy to move from point C to B?
A)Restrictions on foreign direct investment and international migration.
B)Government funding of universities.
C)Policies that encourage firms to adopt new production technology.
D)The introduction of computer coding classes in primary education.
E)An economy gaining more capital.
Alt text for Figure 7.1: In figure 7.1, a graph comparing capital per hour worked and real GDP per hour worked.Long description for Figure 7.1: The x-axis is labelled, capital per hour worked, K/L, with values 40,000 and 60,000 marked.The y-axis is labelled, real GDP per hour worked, Y/L, with 0 at the vertex.3 concave curves, each originating from the vertex are shown.4 points A, B, C, and D are plotted such that point A has 40,000 as the x coordinate, and points B, C, and D have 60,000 as the x coordinate.The 3 curves pass through these points.The curve labelled, Production function 1, passes through point B.The curve labelled, Production function 2, passes through points A and C.The curve labelled, Production function 3, passes through point D.
Refer to Figure 7.1. Which of the following could cause an economy to move from point C to B?
A)Restrictions on foreign direct investment and international migration.
B)Government funding of universities.
C)Policies that encourage firms to adopt new production technology.
D)The introduction of computer coding classes in primary education.
E)An economy gaining more capital.
Question
Question
Question
Question
Question
Question
Question
Question
Question
Question

Unlock Deck
Sign up to unlock the cards in this deck!
Unlock Deck
Unlock Deck
1/280
Play
Full screen (f)
Deck 7: Long-Run Economic Growth: Sources and Policies
1
Between 1960 and now, deaths rates among children have
A)declined in most high-income countries and have risen in most low-income countries.
B)declined in nearly all countries, including most low-income countries.
C)remained relatively unchanged in most high-income countries and have declined in most low-income countries.
D)declined in most high-income countries and have remained relatively unchanged in most low-income countries.
E)risen in virtually all countries.
declined in nearly all countries, including most low-income countries.
2
If real GDP per capita in Canada is $8,000 in 2018, and if real GDP per capita is $12,000 in 2028, what is the average annual growth rate of GDP per capita between 2018 and 2028?
A)3)33%
B)8)45%
C)15%
D)33%
E)50%
A)3)33%
B)8)45%
C)15%
D)33%
E)50%
8)45%
3
Suppose that in 2011 real GDP grew in Estonia by 3% and that the population increased by 5%.Therefore in 2011, Estonia experienced
A)economic growth, but not an increase in living standards.
B)economic growth and an increase in living standards.
C)no economic growth, but an increase in living standards.
D)no economic growth and no increase in living standards.
E)economic collapse and an increase in living standards.
A)economic growth, but not an increase in living standards.
B)economic growth and an increase in living standards.
C)no economic growth, but an increase in living standards.
D)no economic growth and no increase in living standards.
E)economic collapse and an increase in living standards.
economic growth, but not an increase in living standards.
4
Which of the following is not a reason Palliser Furniture Upholstery Ltd.decided to build a factory in Mexico instead of in China?
A)It would be easier for managers to oversee production.
B)Investing in Mexico carries virtually no risk.
C)Mexico is closer to Palliser's North American markets.
D)Producing in Mexico is cheaper than producing in Canada.
A)It would be easier for managers to oversee production.
B)Investing in Mexico carries virtually no risk.
C)Mexico is closer to Palliser's North American markets.
D)Producing in Mexico is cheaper than producing in Canada.
Unlock Deck
Unlock for access to all 280 flashcards in this deck.
Unlock Deck
k this deck
5
Between 1970 and now, the percentage of people able to read and write in sub-Saharan Africa has
A)more than doubled.
B)increased by a factor of four.
C)declined by 50 percent.
D)increased only 10 percent.
E)fallen by 25 percent.
A)more than doubled.
B)increased by a factor of four.
C)declined by 50 percent.
D)increased only 10 percent.
E)fallen by 25 percent.
Unlock Deck
Unlock for access to all 280 flashcards in this deck.
Unlock Deck
k this deck
6
The Industrial Revolution began in
A)England around 1750.
B)the United States around 1820.
C)Canada around 1867.
D)Germany around 1780.
E)France around 1777.
A)England around 1750.
B)the United States around 1820.
C)Canada around 1867.
D)Germany around 1780.
E)France around 1777.
Unlock Deck
Unlock for access to all 280 flashcards in this deck.
Unlock Deck
k this deck
7
If Canada and Bolivia have annual per capita growth rates of 3.2% and 1.35%, respectively, and if Canada's per capita GDP is higher, then in the long run
A)real GDP per capita in Canada will always be 1.9% higher than real GDP per capital in Bolivia.
B)the difference between the level of real GDP per capita in Canada and real GDP per capita in Bolivia will shrink over time.
C)the difference between the level of real GDP per capita in Canada and real GDP per capita in Bolivia will increase over time.
D)the difference between the level of real GDP per capita in Canada and real GDP per capita in Bolivia will always be $1.9 trillion.
Unlock Deck
Unlock for access to all 280 flashcards in this deck.
Unlock Deck
k this deck
8
Growth in real GDP per capita for the world economy was greatest during
A)the fifteenth century.
B)the seventeenth century.
C)the eighteenth century.
D)the nineteenth century.
E)the twentieth century.
A)the fifteenth century.
B)the seventeenth century.
C)the eighteenth century.
D)the nineteenth century.
E)the twentieth century.
Unlock Deck
Unlock for access to all 280 flashcards in this deck.
Unlock Deck
k this deck
9
The period of time from 1 000 000 BCE to 1300 CE was a period of
A)no sustained economic growth.
B)slow and steady economic growth.
C)moderate economic growth.
D)rapid and sustained economic growth.
E)rapidly accelerating economic growth.
A)no sustained economic growth.
B)slow and steady economic growth.
C)moderate economic growth.
D)rapid and sustained economic growth.
E)rapidly accelerating economic growth.
Unlock Deck
Unlock for access to all 280 flashcards in this deck.
Unlock Deck
k this deck
10
If real GDP per capita in Canada is $8,000, what will real GDP per capita in Canada be after 5 years if real GDP per capita grows at an annual rate of 3.2%?
A)$8,520
B)$9,280
C)$9,365
D)$10,560
E)$12,350
A)$8,520
B)$9,280
C)$9,365
D)$10,560
E)$12,350
Unlock Deck
Unlock for access to all 280 flashcards in this deck.
Unlock Deck
k this deck
11
Small differences in economic growth rates result in small differences in living standards.
Unlock Deck
Unlock for access to all 280 flashcards in this deck.
Unlock Deck
k this deck
12
If real GDP per capita in Canada is $8,000 in 2018, and if real GDP per capita is $12,000 in 2028, what is the total percent change in the growth rate of GDP per capita between 2018 and 2028?
A)3)33%
B)5%
C)15%
D)33%
E)50%
A)3)33%
B)5%
C)15%
D)33%
E)50%
Unlock Deck
Unlock for access to all 280 flashcards in this deck.
Unlock Deck
k this deck
13
Significant economic growth did not begin in the world until
A)1000 CE.
B)1750 CE.
C)1820 CE.
D)the 20th century CE.
E)1500 CE.
A)1000 CE.
B)1750 CE.
C)1820 CE.
D)the 20th century CE.
E)1500 CE.
Unlock Deck
Unlock for access to all 280 flashcards in this deck.
Unlock Deck
k this deck
14
Some factors currently exist that inhibit the growth rate of the Mexican economy.The main reason given is
A)the introduction of free-market reforms.
B)the lack of natural resources in Mexico.
C)the lack of the rule of law that predictably enforce property rights.
D)the total lack of governmental intervention in the market place.
E)the lack of highly educated workers.
A)the introduction of free-market reforms.
B)the lack of natural resources in Mexico.
C)the lack of the rule of law that predictably enforce property rights.
D)the total lack of governmental intervention in the market place.
E)the lack of highly educated workers.
Unlock Deck
Unlock for access to all 280 flashcards in this deck.
Unlock Deck
k this deck
15
If real GDP per capita in Ireland is estimated to be $7,400 in 2012, what will real GDP per capita be in 2017 if real GDP per capita grows at an annual rate of 2.8%?
A)$7,607
B)$8,496
C)$9,472
D)$20,720
E)$21,375
A)$7,607
B)$8,496
C)$9,472
D)$20,720
E)$21,375
Unlock Deck
Unlock for access to all 280 flashcards in this deck.
Unlock Deck
k this deck
16
Which of the following is a reason why the Industrial Revolution began in England, and not in China, India, Africa, or Japan?
A)The British system ensured the property rights of entrepreneurs.
B)English inventors were more productive than those in other countries.
C)British government was less stable than those in other countries.
D)The British people had a longer history of embracing technological change.
E)The British Navy prevented China from growing.
Unlock Deck
Unlock for access to all 280 flashcards in this deck.
Unlock Deck
k this deck
17
Increasing the growth rate of GDP per capita and sustaining this growth rate in an economy can
A)increase infant mortality.
B)increase standards of living.
C)increase the level of poverty.
D)lower life expectancy.
E)eliminate poverty.
A)increase infant mortality.
B)increase standards of living.
C)increase the level of poverty.
D)lower life expectancy.
E)eliminate poverty.
Unlock Deck
Unlock for access to all 280 flashcards in this deck.
Unlock Deck
k this deck
18
The rapid growth of the Chinese economy should
A)benefit Canadian consumers, as they have access to less expensive consumer goods.
B)make it more difficult for citizens of Canada to find a job.
C)make the cost of living for Canadians rise.
D)not affect the mix of jobs available to citizens of Canada.
E)A and B
A)benefit Canadian consumers, as they have access to less expensive consumer goods.
B)make it more difficult for citizens of Canada to find a job.
C)make the cost of living for Canadians rise.
D)not affect the mix of jobs available to citizens of Canada.
E)A and B
Unlock Deck
Unlock for access to all 280 flashcards in this deck.
Unlock Deck
k this deck
19
An economy that grows too slowly fails to raise living standards.
Unlock Deck
Unlock for access to all 280 flashcards in this deck.
Unlock Deck
k this deck
20
According to Douglass North, the Industrial Revolution occurred in England because
A)the British Parliament took control of the government and could credibly commit to upholding property rights.
B)the British monarchy took control of the government and pledged not to raise taxes arbitrarily.
C)the British courts became tied to the king and began to refuse to enforce property rights.
D)the British Parliament instituted a command economy structure and implemented a planned economy.
E)the British navy was the most powerful in the world.
Unlock Deck
Unlock for access to all 280 flashcards in this deck.
Unlock Deck
k this deck
21
Entrepreneurship in Mexico is
A)still risky due to government corruption and organized crime.
B)the sole responsibility of the Mexican government.
C)a relatively new phenomenon.
D)the main reason Mexico does not enjoy the same standard of living as the United States and Canada.
E)much safer than in Canada.
A)still risky due to government corruption and organized crime.
B)the sole responsibility of the Mexican government.
C)a relatively new phenomenon.
D)the main reason Mexico does not enjoy the same standard of living as the United States and Canada.
E)much safer than in Canada.
Unlock Deck
Unlock for access to all 280 flashcards in this deck.
Unlock Deck
k this deck
22
________ is considered a high-income country, ________ a developing country, and ________ a newly industrializing country.
A)Japan; Hong Kong; South Korea
B)The United States; Somalia; Taiwan
C)Canada; France; Singapore
D)Honduras; New Zealand; South Korea
E)India; Russia; Canada
A)Japan; Hong Kong; South Korea
B)The United States; Somalia; Taiwan
C)Canada; France; Singapore
D)Honduras; New Zealand; South Korea
E)India; Russia; Canada
Unlock Deck
Unlock for access to all 280 flashcards in this deck.
Unlock Deck
k this deck
23
GDP in a country grew from $10 billion to $14 billion over the span of 5 years.The average annual growth rate of GDP was
A)2%.
B)4%.
C)7%.
D)10%.
E)40%.
A)2%.
B)4%.
C)7%.
D)10%.
E)40%.
Unlock Deck
Unlock for access to all 280 flashcards in this deck.
Unlock Deck
k this deck
24
Which of the following accurately describes economic growth and standards of living between and 1300 CE?
A)Standards of living in 1300 CE were substantially better than what they were in 1,000,000 BCE.
B)Standards of living substantially declined from 1,000,000 BCE to 1300 CE.
C)Significant economic growth took place between 1,000,000 BCE and 1300 CE.
D)No sustained economic growth occurred between 1,000,000 BCE and 1300 CE.
E)Standards of living grew slowly, but steadily between 1,000,000 BCE and 1300 CE.
and 1300 CE?A)Standards of living in 1300 CE were substantially better than what they were in 1,000,000 BCE.
B)Standards of living substantially declined from 1,000,000 BCE to 1300 CE.
C)Significant economic growth took place between 1,000,000 BCE and 1300 CE.
D)No sustained economic growth occurred between 1,000,000 BCE and 1300 CE.
E)Standards of living grew slowly, but steadily between 1,000,000 BCE and 1300 CE.
Unlock Deck
Unlock for access to all 280 flashcards in this deck.
Unlock Deck
k this deck
25
The Industrial Revolution
A)marked the beginning of significant economic growth in the world.
B)started in France around the year 1750.
C)produced goods exclusively using human or animal power.
D)had no impact on standards of living in the world.
E)marked the beginning of poverty around the world.
A)marked the beginning of significant economic growth in the world.
B)started in France around the year 1750.
C)produced goods exclusively using human or animal power.
D)had no impact on standards of living in the world.
E)marked the beginning of poverty around the world.
Unlock Deck
Unlock for access to all 280 flashcards in this deck.
Unlock Deck
k this deck
26
During which of the following periods was growth in GDP per capita the fastest?
A)prior to 500 CE.
B)500 CE to 1500 CE.
C)1500 CE to 1800 CE.
D)1800-1900 CE.
E)1900-2000 CE.
A)prior to 500 CE.
B)500 CE to 1500 CE.
C)1500 CE to 1800 CE.
D)1800-1900 CE.
E)1900-2000 CE.
Unlock Deck
Unlock for access to all 280 flashcards in this deck.
Unlock Deck
k this deck
27
The key factors in raising standards of living in low-income countries have been increases in
A)capital accumulation and the money supply.
B)technology and knowledge.
C)foreign aid and population.
D)income and government ownership of resources.
E)trade restrictions.
A)capital accumulation and the money supply.
B)technology and knowledge.
C)foreign aid and population.
D)income and government ownership of resources.
E)trade restrictions.
Unlock Deck
Unlock for access to all 280 flashcards in this deck.
Unlock Deck
k this deck
28
Which of the following is not a reason why the Industrial Revolution occurred when and where it did?
A)The British government was committed to upholding private property rights.
B)The British government was able to eliminate arbitrary increases in taxes.
C)The British government was able to more easily seize wealth.
D)Institutional changes by the British government helped protect wealth.
E)The British courts were effective at enforcing contracts.
Unlock Deck
Unlock for access to all 280 flashcards in this deck.
Unlock Deck
k this deck
29
The best measure of a country's standard of living is
A)GDP per labour hour.
B)GDP per unit of capital.
C)GDP per capita.
D)total nominal GDP.
E)the employment population ratio.
A)GDP per labour hour.
B)GDP per unit of capital.
C)GDP per capita.
D)total nominal GDP.
E)the employment population ratio.
Unlock Deck
Unlock for access to all 280 flashcards in this deck.
Unlock Deck
k this deck
30
GDP in a country grew from $10 billion to $14 billion over the span of 5 years.The total percentage change in GDP was
A)4%.
B)7%.
C)10%.
D)40%.
E) 2%.
A)4%.
B)7%.
C)10%.
D)40%.
E) 2%.
Unlock Deck
Unlock for access to all 280 flashcards in this deck.
Unlock Deck
k this deck
31
What features made England in the eighteenth century the place where the Industrial Revolution occurred?
Unlock Deck
Unlock for access to all 280 flashcards in this deck.
Unlock Deck
k this deck
32
What are some of the reasons used to explain improvements in health, education, democracy, and political stability in many low-income countries?
Unlock Deck
Unlock for access to all 280 flashcards in this deck.
Unlock Deck
k this deck
33
If GDP per capita rises by 2% between 2015 and 2016, which of the following is necessarily true?
A)Real GDP has risen by more than 2%.
B)Real GDP has risen by 2%.
C)The population has decreased.
D)The population has increased, but by less than 2%.
E)None of the above is necessarily true.
A)Real GDP has risen by more than 2%.
B)Real GDP has risen by 2%.
C)The population has decreased.
D)The population has increased, but by less than 2%.
E)None of the above is necessarily true.
Unlock Deck
Unlock for access to all 280 flashcards in this deck.
Unlock Deck
k this deck
34
Which of the following countries had the lowest GDP per capita in 2014?
A)France
B)Mexico
C)Central African Republic
D)Argentina
E)Singapore
A)France
B)Mexico
C)Central African Republic
D)Argentina
E)Singapore
Unlock Deck
Unlock for access to all 280 flashcards in this deck.
Unlock Deck
k this deck
35
Which of the following countries had the highest GDP per capita in 2014?
A)Qatar
B)Canada
C)Japan
D)Norway
E)China
A)Qatar
B)Canada
C)Japan
D)Norway
E)China
Unlock Deck
Unlock for access to all 280 flashcards in this deck.
Unlock Deck
k this deck
36
Most of the countries of Africa are considered newly industrializing countries.
Unlock Deck
Unlock for access to all 280 flashcards in this deck.
Unlock Deck
k this deck
37
According to the World Bank, in 2013 China's GDP was approximately $9.24 trillion (in U.S.dollars). That same year, India's GDP was approximately $3.88 trillion (also in U.S.dollars).With which of the following populations would China's standard of living have been considered higher than India's that year?
A)China's population = 1.4 billion; India's population = 1.3 billion
B)China's population = 5.3 billion; India's population = 1.4 billion
C)China's population = 500 million; India's population = 125 million
D)China's population = 2.0 billion; India's population = 0.7 billion
E)China's population = 1.2 billion; India's population = 1.4 billion
Unlock Deck
Unlock for access to all 280 flashcards in this deck.
Unlock Deck
k this deck
38
If a country's real GDP is rising by 3% per year while its population is rising at 5% per year, which of the following is true?
A)The country's standard of living is falling.
B)The country's standard of living is rising.
C)Growth in nominal GDP outweighs growth in the population.
D)Growth in nominal GDP is less than the growth in the population.
E)Nominal GDP per capita must be constant.
A)The country's standard of living is falling.
B)The country's standard of living is rising.
C)Growth in nominal GDP outweighs growth in the population.
D)Growth in nominal GDP is less than the growth in the population.
E)Nominal GDP per capita must be constant.
Unlock Deck
Unlock for access to all 280 flashcards in this deck.
Unlock Deck
k this deck
39
Table 7.1
Refer to Table 7.1.Based on the table above, which country has a higher standard of living and why?
A)Sweden has a higher standard of living because its GDP is higher.
B)Ireland has a higher standard of living because its GDP per capita is higher.
C)Sweden has a higher standard of living because its GDP per capita is higher.
D)Ireland has a higher standard of living because growth in GDP is greater in Ireland than in Sweden.
E)Ireland and Sweden have almost identical standards of living.
Unlock Deck
Unlock for access to all 280 flashcards in this deck.
Unlock Deck
k this deck
40
In the long run, ________ differences in economic growth rates result in ________ differences in GDP per capita.
A)large; small
B)large; no
C)small; large
D)small; no
A)large; small
B)large; no
C)small; large
D)small; no
Unlock Deck
Unlock for access to all 280 flashcards in this deck.
Unlock Deck
k this deck
41
An economy can improve its standard of living by
A)organizing production so that the quantity of goods produced per hour will decrease.
B)reducing the amount of human capital workers have.
C)increasing the amount of capital available per hour worked.
D)increasing the minimum wage.
E)all of the above
A)organizing production so that the quantity of goods produced per hour will decrease.
B)reducing the amount of human capital workers have.
C)increasing the amount of capital available per hour worked.
D)increasing the minimum wage.
E)all of the above
Unlock Deck
Unlock for access to all 280 flashcards in this deck.
Unlock Deck
k this deck
42
When additions of input to a fixed quantity of another input lead to progressively smaller increases in output, we say we are facing
A)diminishing returns.
B)negative returns.
C)accelerating returns.
D)decreasing production.
E)diseconomies of scale.
A)diminishing returns.
B)negative returns.
C)accelerating returns.
D)decreasing production.
E)diseconomies of scale.
Unlock Deck
Unlock for access to all 280 flashcards in this deck.
Unlock Deck
k this deck
43
Figure 7.1 Alt text for Figure 7.1: In figure 7.1, a graph comparing capital per hour worked and real GDP per hour worked.
Long description for Figure 7.1: The x-axis is labelled, capital per hour worked, K/L, with values 40,000 and 60,000 marked.The y-axis is labelled, real GDP per hour worked, Y/L, with 0 at the vertex.3 concave curves, each originating from the vertex are shown.4 points A, B, C, and D are plotted such that point A has 40,000 as the x coordinate, and points B, C, and D have 60,000 as the x coordinate.The 3 curves pass through these points.The curve labelled, Production function 1, passes through point B.The curve labelled, Production function 2, passes through points A and C.The curve labelled, Production function 3, passes through point D.
Refer to Figure 7.1.Using the per-worker production function in the figure above, the largest changes in an economy's standard of living would be achieved by a movement from
A)A to B to C.
B)B to C to D.
C)C to B to A.
D)D to C to B.
E)C to D to A.
Alt text for Figure 7.1: In figure 7.1, a graph comparing capital per hour worked and real GDP per hour worked.Long description for Figure 7.1: The x-axis is labelled, capital per hour worked, K/L, with values 40,000 and 60,000 marked.The y-axis is labelled, real GDP per hour worked, Y/L, with 0 at the vertex.3 concave curves, each originating from the vertex are shown.4 points A, B, C, and D are plotted such that point A has 40,000 as the x coordinate, and points B, C, and D have 60,000 as the x coordinate.The 3 curves pass through these points.The curve labelled, Production function 1, passes through point B.The curve labelled, Production function 2, passes through points A and C.The curve labelled, Production function 3, passes through point D.
Refer to Figure 7.1.Using the per-worker production function in the figure above, the largest changes in an economy's standard of living would be achieved by a movement from
A)A to B to C.
B)B to C to D.
C)C to B to A.
D)D to C to B.
E)C to D to A.
Unlock Deck
Unlock for access to all 280 flashcards in this deck.
Unlock Deck
k this deck
44
Most economic growth in the world occurred between 1,000,000 BCE and 1300 CE.
Unlock Deck
Unlock for access to all 280 flashcards in this deck.
Unlock Deck
k this deck
45
Figure 7.1 Alt text for Figure 7.1: In figure 7.1, a graph comparing capital per hour worked and real GDP per hour worked.
Long description for Figure 7.1: The x-axis is labelled, capital per hour worked, K/L, with values 40,000 and 60,000 marked.The y-axis is labelled, real GDP per hour worked, Y/L, with 0 at the vertex.3 concave curves, each originating from the vertex are shown.4 points A, B, C, and D are plotted such that point A has 40,000 as the x coordinate, and points B, C, and D have 60,000 as the x coordinate.The 3 curves pass through these points.The curve labelled, Production function 1, passes through point B.The curve labelled, Production function 2, passes through points A and C.The curve labelled, Production function 3, passes through point D.
Refer to Figure 7.1.Within a country, the impact of wars and revolutions and their subsequent destruction of capital is reflected in the per-worker production function in the figure above by a movement from
A)A to B.
B)B to C.
C)B to A.
D)C to A.
E)B to D.
Alt text for Figure 7.1: In figure 7.1, a graph comparing capital per hour worked and real GDP per hour worked.Long description for Figure 7.1: The x-axis is labelled, capital per hour worked, K/L, with values 40,000 and 60,000 marked.The y-axis is labelled, real GDP per hour worked, Y/L, with 0 at the vertex.3 concave curves, each originating from the vertex are shown.4 points A, B, C, and D are plotted such that point A has 40,000 as the x coordinate, and points B, C, and D have 60,000 as the x coordinate.The 3 curves pass through these points.The curve labelled, Production function 1, passes through point B.The curve labelled, Production function 2, passes through points A and C.The curve labelled, Production function 3, passes through point D.
Refer to Figure 7.1.Within a country, the impact of wars and revolutions and their subsequent destruction of capital is reflected in the per-worker production function in the figure above by a movement from
A)A to B.
B)B to C.
C)B to A.
D)C to A.
E)B to D.
Unlock Deck
Unlock for access to all 280 flashcards in this deck.
Unlock Deck
k this deck
46
In 2014, South America had a lower average GDP per capita than any other continent.
Unlock Deck
Unlock for access to all 280 flashcards in this deck.
Unlock Deck
k this deck
47
An economic growth model explains
A)changes in real GDP per capita in the long run.
B)how changes in the money supply affect real interest rates.
C)changes in government tax policies over time.
D)the growth rate of the price level over time.
E)changes in a country's population over time.
A)changes in real GDP per capita in the long run.
B)how changes in the money supply affect real interest rates.
C)changes in government tax policies over time.
D)the growth rate of the price level over time.
E)changes in a country's population over time.
Unlock Deck
Unlock for access to all 280 flashcards in this deck.
Unlock Deck
k this deck
48
Which of the following is not one of the three sources of technological change?
A)additional amounts of existing capital
B)better machinery and equipment
C)increases in human capital
D)better means of organizing and managing production
A)additional amounts of existing capital
B)better machinery and equipment
C)increases in human capital
D)better means of organizing and managing production
Unlock Deck
Unlock for access to all 280 flashcards in this deck.
Unlock Deck
k this deck
49
Figure 7.1 Alt text for Figure 7.1: In figure 7.1, a graph comparing capital per hour worked and real GDP per hour worked.
Long description for Figure 7.1: The x-axis is labelled, capital per hour worked, K/L, with values 40,000 and 60,000 marked.The y-axis is labelled, real GDP per hour worked, Y/L, with 0 at the vertex.3 concave curves, each originating from the vertex are shown.4 points A, B, C, and D are plotted such that point A has 40,000 as the x coordinate, and points B, C, and D have 60,000 as the x coordinate.The 3 curves pass through these points.The curve labelled, Production function 1, passes through point B.The curve labelled, Production function 2, passes through points A and C.The curve labelled, Production function 3, passes through point D.
Refer to Figure 7.1.Technological change is illustrated in the per-worker production function in the figure above by a movement from
A)A to B.
B)B to C.
C)B to A.
D)D to C.
E)D to A.
Alt text for Figure 7.1: In figure 7.1, a graph comparing capital per hour worked and real GDP per hour worked.Long description for Figure 7.1: The x-axis is labelled, capital per hour worked, K/L, with values 40,000 and 60,000 marked.The y-axis is labelled, real GDP per hour worked, Y/L, with 0 at the vertex.3 concave curves, each originating from the vertex are shown.4 points A, B, C, and D are plotted such that point A has 40,000 as the x coordinate, and points B, C, and D have 60,000 as the x coordinate.The 3 curves pass through these points.The curve labelled, Production function 1, passes through point B.The curve labelled, Production function 2, passes through points A and C.The curve labelled, Production function 3, passes through point D.
Refer to Figure 7.1.Technological change is illustrated in the per-worker production function in the figure above by a movement from
A)A to B.
B)B to C.
C)B to A.
D)D to C.
E)D to A.
Unlock Deck
Unlock for access to all 280 flashcards in this deck.
Unlock Deck
k this deck
50
Which of the following would you expect to result in faster economic growth?
A)the invention of new computers that increase labour productivity
B)a decrease in the average level of education in the economy
C)a decrease in the stock of capital per worker
D)a decrease in research and development spending
E)an increase in the rate of population growth
A)the invention of new computers that increase labour productivity
B)a decrease in the average level of education in the economy
C)a decrease in the stock of capital per worker
D)a decrease in research and development spending
E)an increase in the rate of population growth
Unlock Deck
Unlock for access to all 280 flashcards in this deck.
Unlock Deck
k this deck
51
Table 7.2
Refer to Table 7.2.Calculate the GDP per capita for each country in the table.Which country has the highest standard of living? Why?
Refer to Table 7.2.Calculate the GDP per capita for each country in the table.Which country has the highest standard of living? Why?
Unlock Deck
Unlock for access to all 280 flashcards in this deck.
Unlock Deck
k this deck
52
Only income can produce increases in standard of living.
Unlock Deck
Unlock for access to all 280 flashcards in this deck.
Unlock Deck
k this deck
53
According to Nobel Laureate Douglass North, one reason why the Industrial Revolution occurred in England before many other countries was because the King of England consistently maintained control over the court system and the government.
Unlock Deck
Unlock for access to all 280 flashcards in this deck.
Unlock Deck
k this deck
54
When an economy faces diminishing returns,
A)the slope of the per-worker production function becomes steeper as capital per hour worked increases.
B)the slope of the per-worker production function becomes flatter as capital per hour worked increases.
C)the per-worker production function shifts to the left.
D)the per-worker production function shifts to the right.
E)the per-worker production function does not pass through the origin.
Unlock Deck
Unlock for access to all 280 flashcards in this deck.
Unlock Deck
k this deck
55
Figure 7.1 Alt text for Figure 7.1: In figure 7.1, a graph comparing capital per hour worked and real GDP per hour worked.
Long description for Figure 7.1: The x-axis is labelled, capital per hour worked, K/L, with values 40,000 and 60,000 marked.The y-axis is labelled, real GDP per hour worked, Y/L, with 0 at the vertex.3 concave curves, each originating from the vertex are shown.4 points A, B, C, and D are plotted such that point A has 40,000 as the x coordinate, and points B, C, and D have 60,000 as the x coordinate.The 3 curves pass through these points.The curve labelled, Production function 1, passes through point B.The curve labelled, Production function 2, passes through points A and C.The curve labelled, Production function 3, passes through point D.
Refer to Figure 7.1.Diminishing marginal returns is illustrated in the per-worker production function in the figure above by a movement from
A)A to C.
B)B to C.
C)C to D.
D)D to C.
E)A to D.
Alt text for Figure 7.1: In figure 7.1, a graph comparing capital per hour worked and real GDP per hour worked.Long description for Figure 7.1: The x-axis is labelled, capital per hour worked, K/L, with values 40,000 and 60,000 marked.The y-axis is labelled, real GDP per hour worked, Y/L, with 0 at the vertex.3 concave curves, each originating from the vertex are shown.4 points A, B, C, and D are plotted such that point A has 40,000 as the x coordinate, and points B, C, and D have 60,000 as the x coordinate.The 3 curves pass through these points.The curve labelled, Production function 1, passes through point B.The curve labelled, Production function 2, passes through points A and C.The curve labelled, Production function 3, passes through point D.
Refer to Figure 7.1.Diminishing marginal returns is illustrated in the per-worker production function in the figure above by a movement from
A)A to C.
B)B to C.
C)C to D.
D)D to C.
E)A to D.
Unlock Deck
Unlock for access to all 280 flashcards in this deck.
Unlock Deck
k this deck
56
Figure 7.1 Alt text for Figure 7.1: In figure 7.1, a graph comparing capital per hour worked and real GDP per hour worked.
Long description for Figure 7.1: The x-axis is labelled, capital per hour worked, K/L, with values 40,000 and 60,000 marked.The y-axis is labelled, real GDP per hour worked, Y/L, with 0 at the vertex.3 concave curves, each originating from the vertex are shown.4 points A, B, C, and D are plotted such that point A has 40,000 as the x coordinate, and points B, C, and D have 60,000 as the x coordinate.The 3 curves pass through these points.The curve labelled, Production function 1, passes through point B.The curve labelled, Production function 2, passes through points A and C.The curve labelled, Production function 3, passes through point D.
Refer to Figure 7.1.Suppose the per-worker production function in the figure above represents the production function for the Canadian economy.If Canada decided to double its support of university research, this would cause a movement from
A)A to B.
B)B to C.
C)B to A.
D)D to C.
E)C to A.
Alt text for Figure 7.1: In figure 7.1, a graph comparing capital per hour worked and real GDP per hour worked.Long description for Figure 7.1: The x-axis is labelled, capital per hour worked, K/L, with values 40,000 and 60,000 marked.The y-axis is labelled, real GDP per hour worked, Y/L, with 0 at the vertex.3 concave curves, each originating from the vertex are shown.4 points A, B, C, and D are plotted such that point A has 40,000 as the x coordinate, and points B, C, and D have 60,000 as the x coordinate.The 3 curves pass through these points.The curve labelled, Production function 1, passes through point B.The curve labelled, Production function 2, passes through points A and C.The curve labelled, Production function 3, passes through point D.
Refer to Figure 7.1.Suppose the per-worker production function in the figure above represents the production function for the Canadian economy.If Canada decided to double its support of university research, this would cause a movement from
A)A to B.
B)B to C.
C)B to A.
D)D to C.
E)C to A.
Unlock Deck
Unlock for access to all 280 flashcards in this deck.
Unlock Deck
k this deck
57
How do economic growth rates affect a nation's standard of living?
Unlock Deck
Unlock for access to all 280 flashcards in this deck.
Unlock Deck
k this deck
58
High-income countries are also referred to as
A)developing countries.
B)industrialized countries.
C)growing countries.
D)agrarian countries.
E)newly developed countries.
A)developing countries.
B)industrialized countries.
C)growing countries.
D)agrarian countries.
E)newly developed countries.
Unlock Deck
Unlock for access to all 280 flashcards in this deck.
Unlock Deck
k this deck
59
Suppose that an increase in capital per hour worked from $15,000 to $20,000 increases real GDP per hour worked by $500.If capital per hour worked increases further to $25,000, by how much would you expect real GDP per hour worked to increase if there are diminishing returns?
A)by less than $500
B)by exactly $500
C)by more than $500 but less than $5,000
D)by more than $5,000 but less than $20,000
E)by more than $20,000
A)by less than $500
B)by exactly $500
C)by more than $500 but less than $5,000
D)by more than $5,000 but less than $20,000
E)by more than $20,000
Unlock Deck
Unlock for access to all 280 flashcards in this deck.
Unlock Deck
k this deck
60
The small group of East Asian countries that experienced high rates of growth in the 1980s and 1990s are referred to as
A)newly industrializing countries.
B)countries with low standards of living.
C)education-deprived countries.
D)industrial countries.
E)newly decolonized countries.
A)newly industrializing countries.
B)countries with low standards of living.
C)education-deprived countries.
D)industrial countries.
E)newly decolonized countries.
Unlock Deck
Unlock for access to all 280 flashcards in this deck.
Unlock Deck
k this deck
61
In the eighteenth century, Honoré Blanc, a French gunsmith, revolutionized the arms manufacturing industry by focusing on interchangeable parts and standardization and the integration of the assembly line.What impact did his methods for producing muskets have on the per-worker production function?
A)It became flatter.
B)It shifted up.
C)It shifted down.
D)It became linear.
E)It no longer passed through the origin.
A)It became flatter.
B)It shifted up.
C)It shifted down.
D)It became linear.
E)It no longer passed through the origin.
Unlock Deck
Unlock for access to all 280 flashcards in this deck.
Unlock Deck
k this deck
62
Figure 7.1 Alt text for Figure 7.1: In figure 7.1, a graph comparing capital per hour worked and real GDP per hour worked.
Long description for Figure 7.1: The x-axis is labelled, capital per hour worked, K/L, with values 40,000 and 60,000 marked.The y-axis is labelled, real GDP per hour worked, Y/L, with 0 at the vertex.3 concave curves, each originating from the vertex are shown.4 points A, B, C, and D are plotted such that point A has 40,000 as the x coordinate, and points B, C, and D have 60,000 as the x coordinate.The 3 curves pass through these points.The curve labelled, Production function 1, passes through point B.The curve labelled, Production function 2, passes through points A and C.The curve labelled, Production function 3, passes through point D.
Refer to Figure 7.1.Many countries in Africa strongly discouraged and prohibited foreign direct investment in the 1950s and 1960s.By doing so, these countries were essentially preventing a moment from
A)A to B.
B)B to C.
C)B to A.
D)D to C.
E)D to A.
Alt text for Figure 7.1: In figure 7.1, a graph comparing capital per hour worked and real GDP per hour worked.Long description for Figure 7.1: The x-axis is labelled, capital per hour worked, K/L, with values 40,000 and 60,000 marked.The y-axis is labelled, real GDP per hour worked, Y/L, with 0 at the vertex.3 concave curves, each originating from the vertex are shown.4 points A, B, C, and D are plotted such that point A has 40,000 as the x coordinate, and points B, C, and D have 60,000 as the x coordinate.The 3 curves pass through these points.The curve labelled, Production function 1, passes through point B.The curve labelled, Production function 2, passes through points A and C.The curve labelled, Production function 3, passes through point D.
Refer to Figure 7.1.Many countries in Africa strongly discouraged and prohibited foreign direct investment in the 1950s and 1960s.By doing so, these countries were essentially preventing a moment from
A)A to B.
B)B to C.
C)B to A.
D)D to C.
E)D to A.
Unlock Deck
Unlock for access to all 280 flashcards in this deck.
Unlock Deck
k this deck
63
Paul Romer, an economist at Stanford University, is most closely associated with what economic theory?
A)new growth theory
B)labour productivity theory
C)the process of creative destruction
D)the Communist Manifesto
E)the quantity theory of money
A)new growth theory
B)labour productivity theory
C)the process of creative destruction
D)the Communist Manifesto
E)the quantity theory of money
Unlock Deck
Unlock for access to all 280 flashcards in this deck.
Unlock Deck
k this deck
64
Figure 7.2 Alt text for Figure 7.2: In figure 7.2, a graph comparing capital per hour worked and real GDP per hour worked.
Long description for Figure 7.2: The x-axis is labelled, capital per hour worked.The y-axis is labelled, real GDP per hour worked, Y/L.A concave curve originates from 0 at the vertex and passes through 2 points ($35,000, 1,850)and (40,000, $2000), toward the end of the x-axis.These 2 points are connected to their respective coordinates on the x-axis and y-axis with dotted lines.
Refer to Figure 7.2.Assuming no technological change, if Canada increases capital per hour worked by $40,000 every year between 2015 and 2020, we would expect to see
A)real GDP per hour worked will increase by the same increment each year between 2015 and 2020.
B)real GDP per hour worked will be lower in 2020 than it was in 2015.
C)the per-worker production function will get flatter over time.
D)the per-worker production function will shift up every year there is increase in capital per hour worked.
E)the per worker production function will become steeper every year.
Alt text for Figure 7.2: In figure 7.2, a graph comparing capital per hour worked and real GDP per hour worked.Long description for Figure 7.2: The x-axis is labelled, capital per hour worked.The y-axis is labelled, real GDP per hour worked, Y/L.A concave curve originates from 0 at the vertex and passes through 2 points ($35,000, 1,850)and (40,000, $2000), toward the end of the x-axis.These 2 points are connected to their respective coordinates on the x-axis and y-axis with dotted lines.
Refer to Figure 7.2.Assuming no technological change, if Canada increases capital per hour worked by $40,000 every year between 2015 and 2020, we would expect to see
A)real GDP per hour worked will increase by the same increment each year between 2015 and 2020.
B)real GDP per hour worked will be lower in 2020 than it was in 2015.
C)the per-worker production function will get flatter over time.
D)the per-worker production function will shift up every year there is increase in capital per hour worked.
E)the per worker production function will become steeper every year.
Unlock Deck
Unlock for access to all 280 flashcards in this deck.
Unlock Deck
k this deck
65
Because of diminishing returns, an economy can continue to increase real GDP per hour worked only if
A)there are decreases in human capital.
B)the per-worker production function shifts downward.
C)there continue to be decreases in capital per hour worked.
D)there is technological change.
E)there continue to be increases in capital per hour worked.
A)there are decreases in human capital.
B)the per-worker production function shifts downward.
C)there continue to be decreases in capital per hour worked.
D)there is technological change.
E)there continue to be increases in capital per hour worked.
Unlock Deck
Unlock for access to all 280 flashcards in this deck.
Unlock Deck
k this deck
66
If the per-worker production function shifts down,
A)it now takes more capital per hour worked to get the same amount of real GDP per hour worked.
B)an economy can increase its real GDP per hour worked without changing the level of capital per hour worked.
C)the per-worker production function becomes steeper.
D)positive technological change has occurred in the economy.
E)workers have acquired more human capital.
Unlock Deck
Unlock for access to all 280 flashcards in this deck.
Unlock Deck
k this deck
67
According to new growth theory
A)physical capital is nonexcludable.
B)knowledge capital is excludable.
C)knowledge capital is subject to increasing returns.
D)knowledge capital is rival and excludable.
E)knowledge capital can be exhausted by advanced economies.
A)physical capital is nonexcludable.
B)knowledge capital is excludable.
C)knowledge capital is subject to increasing returns.
D)knowledge capital is rival and excludable.
E)knowledge capital can be exhausted by advanced economies.
Unlock Deck
Unlock for access to all 280 flashcards in this deck.
Unlock Deck
k this deck
68
Figure 7.2 Alt text for Figure 7.2: In figure 7.2, a graph comparing capital per hour worked and real GDP per hour worked.
Long description for Figure 7.2: The x-axis is labelled, capital per hour worked.The y-axis is labelled, real GDP per hour worked, Y/L.A concave curve originates from 0 at the vertex and passes through 2 points ($35,000, 1,850)and (40,000, $2000), toward the end of the x-axis.These 2 points are connected to their respective coordinates on the x-axis and y-axis with dotted lines.
Refer to Figure 7.2.Based on the per-worker production function above, if the Canadian economy raises capital per hour worked from $35,000 to $40,000, by how much will real GDP per hour worked increase?
A)$150
B)$1,850
C)$2,000
D)$5,000
E)$35,000
Alt text for Figure 7.2: In figure 7.2, a graph comparing capital per hour worked and real GDP per hour worked.Long description for Figure 7.2: The x-axis is labelled, capital per hour worked.The y-axis is labelled, real GDP per hour worked, Y/L.A concave curve originates from 0 at the vertex and passes through 2 points ($35,000, 1,850)and (40,000, $2000), toward the end of the x-axis.These 2 points are connected to their respective coordinates on the x-axis and y-axis with dotted lines.
Refer to Figure 7.2.Based on the per-worker production function above, if the Canadian economy raises capital per hour worked from $35,000 to $40,000, by how much will real GDP per hour worked increase?
A)$150
B)$1,850
C)$2,000
D)$5,000
E)$35,000
Unlock Deck
Unlock for access to all 280 flashcards in this deck.
Unlock Deck
k this deck
69
According to new growth theory,
A)technological change is influenced by economic incentives.
B)centrally-planned economies are the most efficient.
C)growth in real GDP per capita occurs only if there are increasing returns.
D)economic growth is determined by forces outside the control of the market system.
E)capital accumulation will accelerate GDP growth.
Unlock Deck
Unlock for access to all 280 flashcards in this deck.
Unlock Deck
k this deck
70
Figure 7.1 Alt text for Figure 7.1: In figure 7.1, a graph comparing capital per hour worked and real GDP per hour worked.
Long description for Figure 7.1: The x-axis is labelled, capital per hour worked, K/L, with values 40,000 and 60,000 marked.The y-axis is labelled, real GDP per hour worked, Y/L, with 0 at the vertex.3 concave curves, each originating from the vertex are shown.4 points A, B, C, and D are plotted such that point A has 40,000 as the x coordinate, and points B, C, and D have 60,000 as the x coordinate.The 3 curves pass through these points.The curve labelled, Production function 1, passes through point B.The curve labelled, Production function 2, passes through points A and C.The curve labelled, Production function 3, passes through point D.
Refer to Figure 7.1. Which of the following could cause an economy to move from point C to B?
A)Restrictions on foreign direct investment and international migration.
B)Government funding of universities.
C)Policies that encourage firms to adopt new production technology.
D)The introduction of computer coding classes in primary education.
E)An economy gaining more capital.
Alt text for Figure 7.1: In figure 7.1, a graph comparing capital per hour worked and real GDP per hour worked.Long description for Figure 7.1: The x-axis is labelled, capital per hour worked, K/L, with values 40,000 and 60,000 marked.The y-axis is labelled, real GDP per hour worked, Y/L, with 0 at the vertex.3 concave curves, each originating from the vertex are shown.4 points A, B, C, and D are plotted such that point A has 40,000 as the x coordinate, and points B, C, and D have 60,000 as the x coordinate.The 3 curves pass through these points.The curve labelled, Production function 1, passes through point B.The curve labelled, Production function 2, passes through points A and C.The curve labelled, Production function 3, passes through point D.
Refer to Figure 7.1. Which of the following could cause an economy to move from point C to B?
A)Restrictions on foreign direct investment and international migration.
B)Government funding of universities.
C)Policies that encourage firms to adopt new production technology.
D)The introduction of computer coding classes in primary education.
E)An economy gaining more capital.
Unlock Deck
Unlock for access to all 280 flashcards in this deck.
Unlock Deck
k this deck
71
Under the Soviet system of communism,
A)managerial pay was determined by the extent to which managers could lower the per-unit costs of production.
B)technological progress was slow because managers had little incentive to develop new technologies.
C)competitive pressures in the Soviet Union allowed the country's technological progress to keep pace with the rest of the world.
D)the per-worker production function in the Soviet Union shifted up more rapidly than production functions in other countries.
E)worker's incentives exert effort were too strong, ultimately leading to a reduction in productivity.
Unlock Deck
Unlock for access to all 280 flashcards in this deck.
Unlock Deck
k this deck
72
In a small European country, it is estimated that changing the level of capital from $8 million to $10 million will increase real GDP from $2 million to $3 million.If the number of hours worked in the labour force does not change, what does this information tell you about the slope of the per-worker production function in this range?
A)The slope is -2.
B)The slope is 1/2.
C)The slope is 2.
D)The slope is 4.
E)The slope is 8.
A)The slope is -2.
B)The slope is 1/2.
C)The slope is 2.
D)The slope is 4.
E)The slope is 8.
Unlock Deck
Unlock for access to all 280 flashcards in this deck.
Unlock Deck
k this deck
73
Why would knowledge capital exhibit increasing returns for an entire economy, but not for an individual firm?
A)Its non-rival nature means small gains in productivity can be enjoyed by thousands of firms at once.
B)Its non-rival nature means that firms must compete to enjoy the benefits fo knowledge capital.
C)Its non-excludable nature means that firms have an extra incentive to produce knowledge capital.
D)Its non-excludable nature means that use by one firm does not reduce the benefit of knowledge capital to another.
E)Its non-excludable nature means that small gains in productivity cannot be captured by just one firm.
Unlock Deck
Unlock for access to all 280 flashcards in this deck.
Unlock Deck
k this deck
74
Technological improvements are more likely to occur if
A)the economy is centrally planned.
B)entrepreneurs are compensated with higher profits for taking risks.
C)economic decisions are made by politicians rather than entrepreneurs.
D)companies face little competition in their markets.
E)governments directly control research and development.
A)the economy is centrally planned.
B)entrepreneurs are compensated with higher profits for taking risks.
C)economic decisions are made by politicians rather than entrepreneurs.
D)companies face little competition in their markets.
E)governments directly control research and development.
Unlock Deck
Unlock for access to all 280 flashcards in this deck.
Unlock Deck
k this deck
75
In a small European country, it is estimated that changing the level of capital from $8 million to $10 million will increase real GDP from $2 million to $3 million.What level of GDP would you expect the economy to be able to reach if spending on capital continued to rise to $12 million, assuming no technological change and no change in the hours of work?
A)GDP would increase further, but by less than $1 million.
B)GDP would increase further by exactly $1 million.
C)GDP would increase further by more than $1 million.
D)GDP would increase further by exactly $4 million.
E)GDP would increase further, but more than $4 million.
A)GDP would increase further, but by less than $1 million.
B)GDP would increase further by exactly $1 million.
C)GDP would increase further by more than $1 million.
D)GDP would increase further by exactly $4 million.
E)GDP would increase further, but more than $4 million.
Unlock Deck
Unlock for access to all 280 flashcards in this deck.
Unlock Deck
k this deck
76
Knowledge capital is
A)rival.
B)nonrival.
C)nonexcludable.
D)both B and C
A)rival.
B)nonrival.
C)nonexcludable.
D)both B and C
Unlock Deck
Unlock for access to all 280 flashcards in this deck.
Unlock Deck
k this deck
77
In a small European country, it is estimated that a $10,000 increase in capital per hour worked will increase real GDP per hour worked by $300.Based on this information, what is the slope of the per-worker production function in this range?
A)0)03
B)0)3
C)3)3
D)33.3
E)333
A)0)03
B)0)3
C)3)3
D)33.3
E)333
Unlock Deck
Unlock for access to all 280 flashcards in this deck.
Unlock Deck
k this deck
78
If the slope of the per-worker production function is 1/2 in a given range, how will a $10,000 increase in capital per hour worked affect real GDP per hour worked in the same given range?
A)Real GDP per hour worked will increase by $5,000.
B)Real GDP per hour worked will increase by $20,000.
C)Real GDP per hour worked will increase by $10,000.
D)Real GDP per hour worked will decrease by $20,000.
E)Real GDP per hour worked will increase by more than $20,000.
A)Real GDP per hour worked will increase by $5,000.
B)Real GDP per hour worked will increase by $20,000.
C)Real GDP per hour worked will increase by $10,000.
D)Real GDP per hour worked will decrease by $20,000.
E)Real GDP per hour worked will increase by more than $20,000.
Unlock Deck
Unlock for access to all 280 flashcards in this deck.
Unlock Deck
k this deck
79
The Soviet Union's economy grew rapidly in terms of GDP per hour worked in the 1950s, but eventually this growth slowed.Why did this occur?
A)Capital per hour worked grew rapidly from 1950 to 1980, but technological change occurred very slowly.
B)Capital per hour worked grew slowly, but technological change grew very rapidly.
C)Increasing implementation of new technologies eventually suffered diminishing marginal returns.
D)The centrally planned economy invested too heavily in technological change.
E)The Soviet labour force grew too slowly to maintain growth.
Unlock Deck
Unlock for access to all 280 flashcards in this deck.
Unlock Deck
k this deck
80
New growth theory assumes
A)knowledge capital is subject to decreasing returns at the firm level and increasing returns over the entire economy.
B)physical capital is subject to decreasing returns at the firm level and increasing returns over the entire economy.
C)physical capital is subject to increasing returns at the firm level and decreasing returns over the entire economy.
D)knowledge capital is subject to increasing returns at the firm level and decreasing returns over the entire economy.
E)the returns to knowledge capital can be exhausted in specific industries.
Unlock Deck
Unlock for access to all 280 flashcards in this deck.
Unlock Deck
k this deck
Unlock Deck
Unlock for access to all 280 flashcards in this deck.


