Exam 7: Long-Run Economic Growth: Sources and Policies
Provide examples of three kinds of government policies that can help increase the accumulation of knowledge capital and explain why government policies are often necessary to encourage the accumulation of knowledge capital.
Knowledge capital is a result of research and development that culminates in new technology.Because research and development is costly, and the resulting knowledge capital is both nonrival and nonexcludable, firms have an incentive not to disclose new technologies.If other firms can receive some of the benefits without incurring the costs of research and development, firms have less incentive to invest in research and development (they act as "free riders"), so government policies are sometimes necessary to encourage research and development.For example, government policies that protect intellectual property rights with patents and copyrights guarantee firms exclusive rights to profits from new technologies for a period of time.This will encourage the accumulation of knowledge capital.In addition, subsidies for research and development through grants to researchers or tax benefits to firms that invest in research and development can also encourage the accumulation of knowledge capital.Finally, government subsidies for education will increase the number of workers who receive education, thereby reducing firms' costs of training and increasing the level of research and development firms will be willing to undertake.
Over the last three decades in Canada, services have become a smaller fraction of GDP relative to goods.
False
Technological improvements are more likely to occur if
B
The question of whether economic growth is desirable is a positive question, easily settled by economic analysis.
Some economists argue that the productivity slowdown of the mid-1970s to the mid-1990s was due to changes in oil prices that
Explain the meaning of the word "convergence" in the context of economic growth and standards of living.
Figure 7.4  Alt text for Figure 7.4: In figure 7.4, a graph representing per-worker production functions.
Long description for Figure 7.4: The x-axis is labelled, capital per hour worked, K/L.The y-axis is labelled, real GDP per hour worked, Y/L.3 concave curves originating from 0 at the vertex are shown.5 points A ($50000, $15000), B ($60000, $16000), C ($70000, $16400), D ($60000, $17000), and E ($60000, $15000)are plotted.The curve labelled, Production function 1, passes through point E.The curve labelled, Production function 2, passes through points A, B, and C.The curve labelled, Production function 3, passes through point D.These 5 points are connected to their respective coordinates on the x-axis and y-axis with dotted lines.
-Refer to Figure 7.4.Using the per-worker production function in the figure above, the largest changes in an economy's standard of living would be achieved by a movement from
Alt text for Figure 7.4: In figure 7.4, a graph representing per-worker production functions.
Long description for Figure 7.4: The x-axis is labelled, capital per hour worked, K/L.The y-axis is labelled, real GDP per hour worked, Y/L.3 concave curves originating from 0 at the vertex are shown.5 points A ($50000, $15000), B ($60000, $16000), C ($70000, $16400), D ($60000, $17000), and E ($60000, $15000)are plotted.The curve labelled, Production function 1, passes through point E.The curve labelled, Production function 2, passes through points A, B, and C.The curve labelled, Production function 3, passes through point D.These 5 points are connected to their respective coordinates on the x-axis and y-axis with dotted lines.
-Refer to Figure 7.4.Using the per-worker production function in the figure above, the largest changes in an economy's standard of living would be achieved by a movement from
Figure 7.1 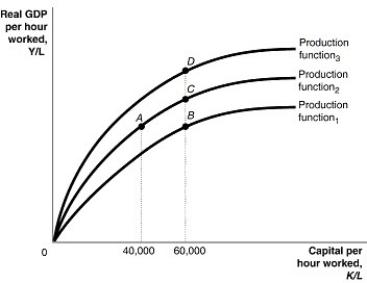 Alt text for Figure 7.1: In figure 7.1, a graph comparing capital per hour worked and real GDP per hour worked.
Long description for Figure 7.1: The x-axis is labelled, capital per hour worked, K/L, with values 40,000 and 60,000 marked.The y-axis is labelled, real GDP per hour worked, Y/L, with 0 at the vertex.3 concave curves, each originating from the vertex are shown.4 points A, B, C, and D are plotted such that point A has 40,000 as the x coordinate, and points B, C, and D have 60,000 as the x coordinate.The 3 curves pass through these points.The curve labelled, Production function 1, passes through point B.The curve labelled, Production function 2, passes through points A and C.The curve labelled, Production function 3, passes through point D.
-Refer to Figure 7.1.Suppose the per-worker production function in the figure above represents the production function for the Canadian economy.If Canada decided to double its support of university research, this would cause a movement from
Alt text for Figure 7.1: In figure 7.1, a graph comparing capital per hour worked and real GDP per hour worked.
Long description for Figure 7.1: The x-axis is labelled, capital per hour worked, K/L, with values 40,000 and 60,000 marked.The y-axis is labelled, real GDP per hour worked, Y/L, with 0 at the vertex.3 concave curves, each originating from the vertex are shown.4 points A, B, C, and D are plotted such that point A has 40,000 as the x coordinate, and points B, C, and D have 60,000 as the x coordinate.The 3 curves pass through these points.The curve labelled, Production function 1, passes through point B.The curve labelled, Production function 2, passes through points A and C.The curve labelled, Production function 3, passes through point D.
-Refer to Figure 7.1.Suppose the per-worker production function in the figure above represents the production function for the Canadian economy.If Canada decided to double its support of university research, this would cause a movement from
GDP in a country grew from $10 billion to $14 billion over the span of 5 years.The total percentage change in GDP was
The rate of growth of productivity in Canada was positive during the 20th century.
What is the difference between foreign direct investment and foreign portfolio investment?
GDP in a country grew from $10 billion to $14 billion over the span of 5 years.The average annual growth rate of GDP was
Draw a graph of "catch-up" that shows where you would expect to see a country with low saving rates and low levels of health and education.How would you expect real GDP per capita to grow in a country like this? Explain.
Using the points on the diagram below, identify which combinations of these points illustrate diminishing returns to capital.Give a brief explanation to support your answer. 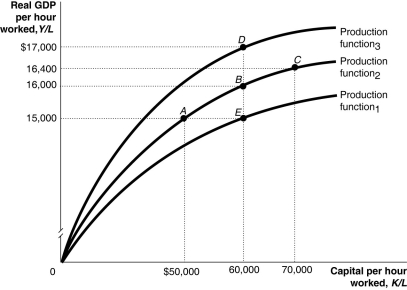 Alt text for Question 101: For question 101, a graph illustrating diminishing returns to capital
Long description for Question 101: The x-axis is labelled, capital per hour worked, K/L.The y-axis is labelled, real GDP per hour worked, Y/L.3 concave curves originating from 0 at the vertex are shown.5 points A ($50000, 15000), B (60000, 16000), C (70000, 16400), D (60000, $17000), and E (60000, 15000)are plotted.The curve labelled, Production function 1, passes through point E.The curve labelled, Production function 2, passes through points A, B, and C.The curve labelled, Production function 3, passes through point D.These 5 points are connected to their respective coordinates on the x and y-axis with dotted lines.
Alt text for Question 101: For question 101, a graph illustrating diminishing returns to capital
Long description for Question 101: The x-axis is labelled, capital per hour worked, K/L.The y-axis is labelled, real GDP per hour worked, Y/L.3 concave curves originating from 0 at the vertex are shown.5 points A ($50000, 15000), B (60000, 16000), C (70000, 16400), D (60000, $17000), and E (60000, 15000)are plotted.The curve labelled, Production function 1, passes through point E.The curve labelled, Production function 2, passes through points A, B, and C.The curve labelled, Production function 3, passes through point D.These 5 points are connected to their respective coordinates on the x and y-axis with dotted lines.
If the slope of the per-worker production function is 1/4 in a given range, how will a $10,000 increase in capital per hour worked affect real GDP per hour worked in the same given range?
Paul Romer, an economist at Stanford University, is most closely associated with what economic theory?
You have been hired as an economic advisor for a developing country.You have been asked to focus on education as a means for the country's development.Explain to the prime minister how improving education and training can contribute to his country's economic growth, and why it is important for the government to take a proactive role in promoting education.
Given the fact that the productivity slowdown of the mid-1970s to the 2014 affected all industrial countries, which of the following explanations for the productivity slowdown in Canada is not likely to be correct?
Filters
- Essay(0)
- Multiple Choice(0)
- Short Answer(0)
- True False(0)
- Matching(0)