Deck 12: Fiscal Policy
Full screen (f)
Question
Question
Question
Question
Question
Question
Question
Question
Question
Question
Question
Question
Question
Question
Question
Question
Question
Question
Question
Question
Question
Question
Question
Question
Question
Question
Question
Question
Question
Question
Question
Question
Question
Question
Question
Question
Question
Question
Question
Question
Question
Question
Question
Figure 12.1 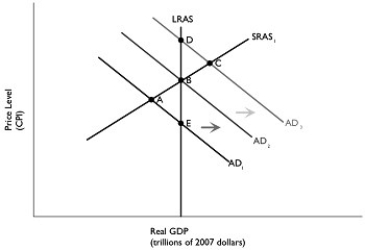 Alt text for Figure 12.1: In figure 12.1, a graph comparing real GDP and price level.
Long description for Figure 12.1: The x-axis is labelled, real GDP (trillions of 2007 dollars)and the y-axis is labelled, price level (CPI).5 lines are shown; AD1, AD2, AD3, LRAS, and SRAS1.Line AD1 begins in the top left corner and slopes down to the end of the x-axis.Line AD2 follows the same slope, but is plotted to the right.Similarly, line AD3 also has the same slope and is plotted to the right of AD2.Line SRAS1 begins close to the vertex and slopes up to the top right corner.Line LRAS is perpendicular to the x-axis, passing through points D, B, and E.Lines AD1 and SRAS1 intersect at point A.Lines AD2, LRAS, and SRAS1 intersect at point B.Lines AD3 and SRAS1 intersect at point C.Lines AD1 and LRAS intersect at point E.Lines AD3 and LRAS intersect at point D.The area between lines AD1 and AD2 is indicated by a right pointing arrow.The area between lines AD2 and AD3 is indicated by a right pointing arrow.
Refer to Figure 12.1.Suppose the economy is in short-run equilibrium below potential GDP and no fiscal or monetary policy is pursued.Using the static AD-AS model in the figure above, this would be depicted as a movement from
A)A to B.
B)B to C.
C)C to B.
D)B to A.
E)A to E.
Alt text for Figure 12.1: In figure 12.1, a graph comparing real GDP and price level.Long description for Figure 12.1: The x-axis is labelled, real GDP (trillions of 2007 dollars)and the y-axis is labelled, price level (CPI).5 lines are shown; AD1, AD2, AD3, LRAS, and SRAS1.Line AD1 begins in the top left corner and slopes down to the end of the x-axis.Line AD2 follows the same slope, but is plotted to the right.Similarly, line AD3 also has the same slope and is plotted to the right of AD2.Line SRAS1 begins close to the vertex and slopes up to the top right corner.Line LRAS is perpendicular to the x-axis, passing through points D, B, and E.Lines AD1 and SRAS1 intersect at point A.Lines AD2, LRAS, and SRAS1 intersect at point B.Lines AD3 and SRAS1 intersect at point C.Lines AD1 and LRAS intersect at point E.Lines AD3 and LRAS intersect at point D.The area between lines AD1 and AD2 is indicated by a right pointing arrow.The area between lines AD2 and AD3 is indicated by a right pointing arrow.
Refer to Figure 12.1.Suppose the economy is in short-run equilibrium below potential GDP and no fiscal or monetary policy is pursued.Using the static AD-AS model in the figure above, this would be depicted as a movement from
A)A to B.
B)B to C.
C)C to B.
D)B to A.
E)A to E.
Question
Question
Question
Figure 12.1 Alt text for Figure 12.1: In figure 12.1, a graph comparing real GDP and price level.
Long description for Figure 12.1: The x-axis is labelled, real GDP (trillions of 2007 dollars)and the y-axis is labelled, price level (CPI).5 lines are shown; AD1, AD2, AD3, LRAS, and SRAS1.Line AD1 begins in the top left corner and slopes down to the end of the x-axis.Line AD2 follows the same slope, but is plotted to the right.Similarly, line AD3 also has the same slope and is plotted to the right of AD2.Line SRAS1 begins close to the vertex and slopes up to the top right corner.Line LRAS is perpendicular to the x-axis, passing through points D, B, and E.Lines AD1 and SRAS1 intersect at point A.Lines AD2, LRAS, and SRAS1 intersect at point B.Lines AD3 and SRAS1 intersect at point C.Lines AD1 and LRAS intersect at point E.Lines AD3 and LRAS intersect at point D.The area between lines AD1 and AD2 is indicated by a right pointing arrow.The area between lines AD2 and AD3 is indicated by a right pointing arrow.
Refer to Figure 12.1.Suppose the economy is in short-run equilibrium above potential GDP and automatic stabilizers move the economy back to long-run equilibrium.Using the static AD-AS model in the figure above, this would be depicted as a movement from
A)D to C.
B)A to E.
C)C to B.
D)B to A.
E)E to A.
Alt text for Figure 12.1: In figure 12.1, a graph comparing real GDP and price level.Long description for Figure 12.1: The x-axis is labelled, real GDP (trillions of 2007 dollars)and the y-axis is labelled, price level (CPI).5 lines are shown; AD1, AD2, AD3, LRAS, and SRAS1.Line AD1 begins in the top left corner and slopes down to the end of the x-axis.Line AD2 follows the same slope, but is plotted to the right.Similarly, line AD3 also has the same slope and is plotted to the right of AD2.Line SRAS1 begins close to the vertex and slopes up to the top right corner.Line LRAS is perpendicular to the x-axis, passing through points D, B, and E.Lines AD1 and SRAS1 intersect at point A.Lines AD2, LRAS, and SRAS1 intersect at point B.Lines AD3 and SRAS1 intersect at point C.Lines AD1 and LRAS intersect at point E.Lines AD3 and LRAS intersect at point D.The area between lines AD1 and AD2 is indicated by a right pointing arrow.The area between lines AD2 and AD3 is indicated by a right pointing arrow.
Refer to Figure 12.1.Suppose the economy is in short-run equilibrium above potential GDP and automatic stabilizers move the economy back to long-run equilibrium.Using the static AD-AS model in the figure above, this would be depicted as a movement from
A)D to C.
B)A to E.
C)C to B.
D)B to A.
E)E to A.
Question
Figure 12.1 Alt text for Figure 12.1: In figure 12.1, a graph comparing real GDP and price level.
Long description for Figure 12.1: The x-axis is labelled, real GDP (trillions of 2007 dollars)and the y-axis is labelled, price level (CPI).5 lines are shown; AD1, AD2, AD3, LRAS, and SRAS1.Line AD1 begins in the top left corner and slopes down to the end of the x-axis.Line AD2 follows the same slope, but is plotted to the right.Similarly, line AD3 also has the same slope and is plotted to the right of AD2.Line SRAS1 begins close to the vertex and slopes up to the top right corner.Line LRAS is perpendicular to the x-axis, passing through points D, B, and E.Lines AD1 and SRAS1 intersect at point A.Lines AD2, LRAS, and SRAS1 intersect at point B.Lines AD3 and SRAS1 intersect at point C.Lines AD1 and LRAS intersect at point E.Lines AD3 and LRAS intersect at point D.The area between lines AD1 and AD2 is indicated by a right pointing arrow.The area between lines AD2 and AD3 is indicated by a right pointing arrow.
Refer to Figure 12.1.Suppose the economy is in a recession and expansionary fiscal policy is pursued.Using the static AD-AS model in the figure above, this would be depicted as a movement from
A)A to B.
B)B to C.
C)C to B.
D)B to A.
E)A to E.
Alt text for Figure 12.1: In figure 12.1, a graph comparing real GDP and price level.Long description for Figure 12.1: The x-axis is labelled, real GDP (trillions of 2007 dollars)and the y-axis is labelled, price level (CPI).5 lines are shown; AD1, AD2, AD3, LRAS, and SRAS1.Line AD1 begins in the top left corner and slopes down to the end of the x-axis.Line AD2 follows the same slope, but is plotted to the right.Similarly, line AD3 also has the same slope and is plotted to the right of AD2.Line SRAS1 begins close to the vertex and slopes up to the top right corner.Line LRAS is perpendicular to the x-axis, passing through points D, B, and E.Lines AD1 and SRAS1 intersect at point A.Lines AD2, LRAS, and SRAS1 intersect at point B.Lines AD3 and SRAS1 intersect at point C.Lines AD1 and LRAS intersect at point E.Lines AD3 and LRAS intersect at point D.The area between lines AD1 and AD2 is indicated by a right pointing arrow.The area between lines AD2 and AD3 is indicated by a right pointing arrow.
Refer to Figure 12.1.Suppose the economy is in a recession and expansionary fiscal policy is pursued.Using the static AD-AS model in the figure above, this would be depicted as a movement from
A)A to B.
B)B to C.
C)C to B.
D)B to A.
E)A to E.
Question
Question
Question
Figure 12.1 Alt text for Figure 12.1: In figure 12.1, a graph comparing real GDP and price level.
Long description for Figure 12.1: The x-axis is labelled, real GDP (trillions of 2007 dollars)and the y-axis is labelled, price level (CPI).5 lines are shown; AD1, AD2, AD3, LRAS, and SRAS1.Line AD1 begins in the top left corner and slopes down to the end of the x-axis.Line AD2 follows the same slope, but is plotted to the right.Similarly, line AD3 also has the same slope and is plotted to the right of AD2.Line SRAS1 begins close to the vertex and slopes up to the top right corner.Line LRAS is perpendicular to the x-axis, passing through points D, B, and E.Lines AD1 and SRAS1 intersect at point A.Lines AD2, LRAS, and SRAS1 intersect at point B.Lines AD3 and SRAS1 intersect at point C.Lines AD1 and LRAS intersect at point E.Lines AD3 and LRAS intersect at point D.The area between lines AD1 and AD2 is indicated by a right pointing arrow.The area between lines AD2 and AD3 is indicated by a right pointing arrow.
Refer to Figure 12.1.Suppose the economy is in short-run equilibrium below potential GDP and Parliament and the prime minister lower taxes to move the economy back to long-run equilibrium.Using the static AD-AS model in the figure above, this would be depicted as a movement from
A)A to B.
B)B to C.
C)C to B.
D)B to A.
E)A to E.
Alt text for Figure 12.1: In figure 12.1, a graph comparing real GDP and price level.Long description for Figure 12.1: The x-axis is labelled, real GDP (trillions of 2007 dollars)and the y-axis is labelled, price level (CPI).5 lines are shown; AD1, AD2, AD3, LRAS, and SRAS1.Line AD1 begins in the top left corner and slopes down to the end of the x-axis.Line AD2 follows the same slope, but is plotted to the right.Similarly, line AD3 also has the same slope and is plotted to the right of AD2.Line SRAS1 begins close to the vertex and slopes up to the top right corner.Line LRAS is perpendicular to the x-axis, passing through points D, B, and E.Lines AD1 and SRAS1 intersect at point A.Lines AD2, LRAS, and SRAS1 intersect at point B.Lines AD3 and SRAS1 intersect at point C.Lines AD1 and LRAS intersect at point E.Lines AD3 and LRAS intersect at point D.The area between lines AD1 and AD2 is indicated by a right pointing arrow.The area between lines AD2 and AD3 is indicated by a right pointing arrow.
Refer to Figure 12.1.Suppose the economy is in short-run equilibrium below potential GDP and Parliament and the prime minister lower taxes to move the economy back to long-run equilibrium.Using the static AD-AS model in the figure above, this would be depicted as a movement from
A)A to B.
B)B to C.
C)C to B.
D)B to A.
E)A to E.
Question
Figure 12.1 Alt text for Figure 12.1: In figure 12.1, a graph comparing real GDP and price level.
Long description for Figure 12.1: The x-axis is labelled, real GDP (trillions of 2007 dollars)and the y-axis is labelled, price level (CPI).5 lines are shown; AD1, AD2, AD3, LRAS, and SRAS1.Line AD1 begins in the top left corner and slopes down to the end of the x-axis.Line AD2 follows the same slope, but is plotted to the right.Similarly, line AD3 also has the same slope and is plotted to the right of AD2.Line SRAS1 begins close to the vertex and slopes up to the top right corner.Line LRAS is perpendicular to the x-axis, passing through points D, B, and E.Lines AD1 and SRAS1 intersect at point A.Lines AD2, LRAS, and SRAS1 intersect at point B.Lines AD3 and SRAS1 intersect at point C.Lines AD1 and LRAS intersect at point E.Lines AD3 and LRAS intersect at point D.The area between lines AD1 and AD2 is indicated by a right pointing arrow.The area between lines AD2 and AD3 is indicated by a right pointing arrow.
Refer to Figure 12.1.An increase in taxes would be depicted as a movement from ________, using the static AD-AS model in the figure above.
A)E to B
B)B to C
C)A to B
D)B to A
E)C to D
Alt text for Figure 12.1: In figure 12.1, a graph comparing real GDP and price level.Long description for Figure 12.1: The x-axis is labelled, real GDP (trillions of 2007 dollars)and the y-axis is labelled, price level (CPI).5 lines are shown; AD1, AD2, AD3, LRAS, and SRAS1.Line AD1 begins in the top left corner and slopes down to the end of the x-axis.Line AD2 follows the same slope, but is plotted to the right.Similarly, line AD3 also has the same slope and is plotted to the right of AD2.Line SRAS1 begins close to the vertex and slopes up to the top right corner.Line LRAS is perpendicular to the x-axis, passing through points D, B, and E.Lines AD1 and SRAS1 intersect at point A.Lines AD2, LRAS, and SRAS1 intersect at point B.Lines AD3 and SRAS1 intersect at point C.Lines AD1 and LRAS intersect at point E.Lines AD3 and LRAS intersect at point D.The area between lines AD1 and AD2 is indicated by a right pointing arrow.The area between lines AD2 and AD3 is indicated by a right pointing arrow.
Refer to Figure 12.1.An increase in taxes would be depicted as a movement from ________, using the static AD-AS model in the figure above.
A)E to B
B)B to C
C)A to B
D)B to A
E)C to D
Question
Question
Figure 12.1 Alt text for Figure 12.1: In figure 12.1, a graph comparing real GDP and price level.
Long description for Figure 12.1: The x-axis is labelled, real GDP (trillions of 2007 dollars)and the y-axis is labelled, price level (CPI).5 lines are shown; AD1, AD2, AD3, LRAS, and SRAS1.Line AD1 begins in the top left corner and slopes down to the end of the x-axis.Line AD2 follows the same slope, but is plotted to the right.Similarly, line AD3 also has the same slope and is plotted to the right of AD2.Line SRAS1 begins close to the vertex and slopes up to the top right corner.Line LRAS is perpendicular to the x-axis, passing through points D, B, and E.Lines AD1 and SRAS1 intersect at point A.Lines AD2, LRAS, and SRAS1 intersect at point B.Lines AD3 and SRAS1 intersect at point C.Lines AD1 and LRAS intersect at point E.Lines AD3 and LRAS intersect at point D.The area between lines AD1 and AD2 is indicated by a right pointing arrow.The area between lines AD2 and AD3 is indicated by a right pointing arrow.
Refer to Figure 12.1.Suppose the economy is in short-run equilibrium above potential GDP and no policy is pursued.Using the static AD-AS model in the figure above, this would be depicted as a movement from
A)D to C.
B)A to E.
C)C to D.
D)C to B.
E)E to A.
Alt text for Figure 12.1: In figure 12.1, a graph comparing real GDP and price level.Long description for Figure 12.1: The x-axis is labelled, real GDP (trillions of 2007 dollars)and the y-axis is labelled, price level (CPI).5 lines are shown; AD1, AD2, AD3, LRAS, and SRAS1.Line AD1 begins in the top left corner and slopes down to the end of the x-axis.Line AD2 follows the same slope, but is plotted to the right.Similarly, line AD3 also has the same slope and is plotted to the right of AD2.Line SRAS1 begins close to the vertex and slopes up to the top right corner.Line LRAS is perpendicular to the x-axis, passing through points D, B, and E.Lines AD1 and SRAS1 intersect at point A.Lines AD2, LRAS, and SRAS1 intersect at point B.Lines AD3 and SRAS1 intersect at point C.Lines AD1 and LRAS intersect at point E.Lines AD3 and LRAS intersect at point D.The area between lines AD1 and AD2 is indicated by a right pointing arrow.The area between lines AD2 and AD3 is indicated by a right pointing arrow.
Refer to Figure 12.1.Suppose the economy is in short-run equilibrium above potential GDP and no policy is pursued.Using the static AD-AS model in the figure above, this would be depicted as a movement from
A)D to C.
B)A to E.
C)C to D.
D)C to B.
E)E to A.
Question
Question
Question
Question
Question
Question
Question
Figure 12.1 Alt text for Figure 12.1: In figure 12.1, a graph comparing real GDP and price level.
Long description for Figure 12.1: The x-axis is labelled, real GDP (trillions of 2007 dollars)and the y-axis is labelled, price level (CPI).5 lines are shown; AD1, AD2, AD3, LRAS, and SRAS1.Line AD1 begins in the top left corner and slopes down to the end of the x-axis.Line AD2 follows the same slope, but is plotted to the right.Similarly, line AD3 also has the same slope and is plotted to the right of AD2.Line SRAS1 begins close to the vertex and slopes up to the top right corner.Line LRAS is perpendicular to the x-axis, passing through points D, B, and E.Lines AD1 and SRAS1 intersect at point A.Lines AD2, LRAS, and SRAS1 intersect at point B.Lines AD3 and SRAS1 intersect at point C.Lines AD1 and LRAS intersect at point E.Lines AD3 and LRAS intersect at point D.The area between lines AD1 and AD2 is indicated by a right pointing arrow.The area between lines AD2 and AD3 is indicated by a right pointing arrow.
Refer to Figure 12.1.Suppose the economy is in short-run equilibrium above potential GDP and wages and prices are rising.If contractionary policy is used to move the economy back to long run equilibrium, this would be depicted as a movement from ________ using the static AD-AS model in the figure above.
A)D to C
B)C to B
C)A to E
D)B to A
E)E to A
Alt text for Figure 12.1: In figure 12.1, a graph comparing real GDP and price level.Long description for Figure 12.1: The x-axis is labelled, real GDP (trillions of 2007 dollars)and the y-axis is labelled, price level (CPI).5 lines are shown; AD1, AD2, AD3, LRAS, and SRAS1.Line AD1 begins in the top left corner and slopes down to the end of the x-axis.Line AD2 follows the same slope, but is plotted to the right.Similarly, line AD3 also has the same slope and is plotted to the right of AD2.Line SRAS1 begins close to the vertex and slopes up to the top right corner.Line LRAS is perpendicular to the x-axis, passing through points D, B, and E.Lines AD1 and SRAS1 intersect at point A.Lines AD2, LRAS, and SRAS1 intersect at point B.Lines AD3 and SRAS1 intersect at point C.Lines AD1 and LRAS intersect at point E.Lines AD3 and LRAS intersect at point D.The area between lines AD1 and AD2 is indicated by a right pointing arrow.The area between lines AD2 and AD3 is indicated by a right pointing arrow.
Refer to Figure 12.1.Suppose the economy is in short-run equilibrium above potential GDP and wages and prices are rising.If contractionary policy is used to move the economy back to long run equilibrium, this would be depicted as a movement from ________ using the static AD-AS model in the figure above.
A)D to C
B)C to B
C)A to E
D)B to A
E)E to A
Question
Question
Figure 12.3 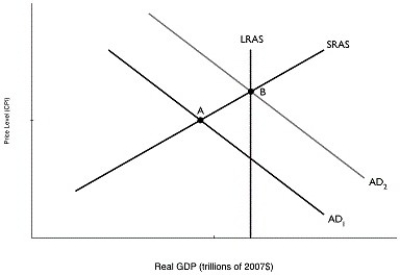 Alt text for Figure 12.3: In figure 12.3, a graph comparing real GDP and price level.
Long description for Figure 12.3: The x-axis is labelled, real GDP (trillions of 2007 dollars)and the y-axis is labelled, price level (CPI).4 lines are shown; AD1, AD2, LRAS, and SRAS.Line AD1 begins at the top left corner and slopes down to the end of the x-axis.Line AD2 follows the same slope as line AD1, but is plotted to the right.Line SRAS begins close to the vertex and slopes up to the top right corner.Line LRAS is perpendicular to the x-axis and passes through point B.Lines AD1 and SRAS intersect at point A.Lines AD2, LRAS, and SRAS intersect at point B.
Refer to Figure 12.3.In the graph above, suppose the economy is initially at point A.The movement of the economy to point B as shown in the graph illustrates the effect of which of the following policy actions by the federal government?
A)a decrease in income taxes
B)a decrease in interest rates
C)a decrease in government purchases
D)an increase in the money supply
E)an increase in the number of national statutory holidays
Alt text for Figure 12.3: In figure 12.3, a graph comparing real GDP and price level.Long description for Figure 12.3: The x-axis is labelled, real GDP (trillions of 2007 dollars)and the y-axis is labelled, price level (CPI).4 lines are shown; AD1, AD2, LRAS, and SRAS.Line AD1 begins at the top left corner and slopes down to the end of the x-axis.Line AD2 follows the same slope as line AD1, but is plotted to the right.Line SRAS begins close to the vertex and slopes up to the top right corner.Line LRAS is perpendicular to the x-axis and passes through point B.Lines AD1 and SRAS intersect at point A.Lines AD2, LRAS, and SRAS intersect at point B.
Refer to Figure 12.3.In the graph above, suppose the economy is initially at point A.The movement of the economy to point B as shown in the graph illustrates the effect of which of the following policy actions by the federal government?
A)a decrease in income taxes
B)a decrease in interest rates
C)a decrease in government purchases
D)an increase in the money supply
E)an increase in the number of national statutory holidays
Question
Question
Question
Question
Question
Question
Question
Question
Question
Figure 12.2 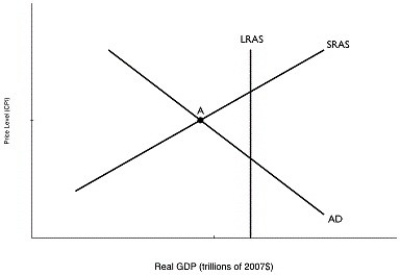 Alt text for Figure 12.2: In figure 12.2, a graph comparing real GDP and price level.
Long description for Figure 12.2: The x-axis is labelled, real GDP (trillions of 2007 dollars)and the y-axis is labelled, price level (CPI).3 lines are shown; AD, LRAS, and SRAS.Line AD begins at the top left corner and slopes down to the end of the x-axis.Line SRAS begins near the bottom left corner and slopes up to the top right corner.Line LRAS is perpendicular to the x-axis, and intersects lines AD and SRAS at point A.
Refer to Figure 12.2.In the graph above, if the economy is at point A, an appropriate fiscal policy by the federal government would be to
A)decrease the required reserve ratio.
B)sell government securities.
C)increase government expenditures.
D)decrease transfer payments.
E)increase the marginal income tax rate for the 1%.
Alt text for Figure 12.2: In figure 12.2, a graph comparing real GDP and price level.Long description for Figure 12.2: The x-axis is labelled, real GDP (trillions of 2007 dollars)and the y-axis is labelled, price level (CPI).3 lines are shown; AD, LRAS, and SRAS.Line AD begins at the top left corner and slopes down to the end of the x-axis.Line SRAS begins near the bottom left corner and slopes up to the top right corner.Line LRAS is perpendicular to the x-axis, and intersects lines AD and SRAS at point A.
Refer to Figure 12.2.In the graph above, if the economy is at point A, an appropriate fiscal policy by the federal government would be to
A)decrease the required reserve ratio.
B)sell government securities.
C)increase government expenditures.
D)decrease transfer payments.
E)increase the marginal income tax rate for the 1%.
Question
Question
Question
Figure 12.2 Alt text for Figure 12.2: In figure 12.2, a graph comparing real GDP and price level.
Long description for Figure 12.2: The x-axis is labelled, real GDP (trillions of 2007 dollars)and the y-axis is labelled, price level (CPI).3 lines are shown; AD, LRAS, and SRAS.Line AD begins at the top left corner and slopes down to the end of the x-axis.Line SRAS begins near the bottom left corner and slopes up to the top right corner.Line LRAS is perpendicular to the x-axis, and intersects lines AD and SRAS at point A.
Refer to Figure 12.2.In the graph above, if the economy is at point A, an appropriate fiscal policy by the federal government would be to
A)lower the discount rate of interest.
B)execute an open market sale of government securities.
C)increase government transfer payments.
D)increase marginal income tax rates.
E)decrease government spending.
Alt text for Figure 12.2: In figure 12.2, a graph comparing real GDP and price level.Long description for Figure 12.2: The x-axis is labelled, real GDP (trillions of 2007 dollars)and the y-axis is labelled, price level (CPI).3 lines are shown; AD, LRAS, and SRAS.Line AD begins at the top left corner and slopes down to the end of the x-axis.Line SRAS begins near the bottom left corner and slopes up to the top right corner.Line LRAS is perpendicular to the x-axis, and intersects lines AD and SRAS at point A.
Refer to Figure 12.2.In the graph above, if the economy is at point A, an appropriate fiscal policy by the federal government would be to
A)lower the discount rate of interest.
B)execute an open market sale of government securities.
C)increase government transfer payments.
D)increase marginal income tax rates.
E)decrease government spending.
Question
Question
Question
Question
Question
Figure 12.4 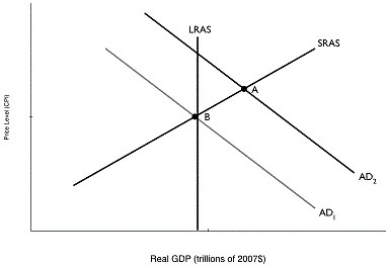 Alt text for Figure 12.4: In figure 12.4, a graph comparing real GDP and price level.
Long description for Figure 12.4: The x-axis is labelled, real GDP (trillions of 2007 dollars)and the y-axis is labelled, price level (CPI).4 lines are shown; AD1, AD2, LRAS, and SRAS.Line AD1 begins at the top left corner and slopes down to the end of the x-axis.Line AD2 follows the same slope as line A1, but is plotted to the right.Line SRAS begins in the bottom left corner and slopes up to the top right corner.Line LRAS is perpendicular to the x-axis, and intersects lines AD1 and SRAS at point B.Lines AD2 and SRAS intersect at point A.
Refer to Figure 12.4.In the graph above, suppose the economy is initially at point A.The movement of the economy to point B as shown in the graph illustrates the effect of which of the following policy actions by the federal government?
A)an increase in transfer payments
B)an increase in interest rates
C)an increase in the marginal income tax rate
D)an open market purchase of Canadian government bonds
E)an increase in government spending
Alt text for Figure 12.4: In figure 12.4, a graph comparing real GDP and price level.Long description for Figure 12.4: The x-axis is labelled, real GDP (trillions of 2007 dollars)and the y-axis is labelled, price level (CPI).4 lines are shown; AD1, AD2, LRAS, and SRAS.Line AD1 begins at the top left corner and slopes down to the end of the x-axis.Line AD2 follows the same slope as line A1, but is plotted to the right.Line SRAS begins in the bottom left corner and slopes up to the top right corner.Line LRAS is perpendicular to the x-axis, and intersects lines AD1 and SRAS at point B.Lines AD2 and SRAS intersect at point A.
Refer to Figure 12.4.In the graph above, suppose the economy is initially at point A.The movement of the economy to point B as shown in the graph illustrates the effect of which of the following policy actions by the federal government?
A)an increase in transfer payments
B)an increase in interest rates
C)an increase in the marginal income tax rate
D)an open market purchase of Canadian government bonds
E)an increase in government spending
Question

Unlock Deck
Sign up to unlock the cards in this deck!
Unlock Deck
Unlock Deck
1/303
Play
Full screen (f)
Deck 12: Fiscal Policy
1
By the time you're likely to start thinking about retirement,
A)the cost of health care will still be growing at current rates.
B)the cost of health care will be falling.
C)the cost of health care be growing much more slowly than it is now.
D)the cost of health care will not be an issue for Canadians.
E)the cost of health care will be rising more rapidly than it is now.
the cost of health care be growing much more slowly than it is now.
2
In the 2015 federal election campaign the current federal government promised more ________ aimed at increasing real GDP and employment.
A)discretionary fiscal policy
B)an automatic stabilizer
C)contractionary fiscal policy
D)a transfer payment
E)expansionary monetary policy
A)discretionary fiscal policy
B)an automatic stabilizer
C)contractionary fiscal policy
D)a transfer payment
E)expansionary monetary policy
discretionary fiscal policy
3
In the 1960s and 1970s, the majority of government spending took place at the ________, and since the 1990s, the majority of government spending has taken place at the ________.
A)provincial and local levels; federal level
B)local level; federal level
C)federal level; provincial and local levels
D)federal level; provincial level
E)international level; municipal level
A)provincial and local levels; federal level
B)local level; federal level
C)federal level; provincial and local levels
D)federal level; provincial level
E)international level; municipal level
federal level; provincial and local levels
4
Three categories of federal government expenditures, in addition to government operations, are
A)debt charges, transfers to other levels of government, and transfer payments.
B)interest on provincial debt, defense spending, and transfer payments.
C)defense spending, budgets of federal agencies, and transfer payments.
D)defense spending, income tax, and transfers.
E)international aid, transfers to citizens, and lending to crown corporations.
Unlock Deck
Unlock for access to all 303 flashcards in this deck.
Unlock Deck
k this deck
5
Automatic stabilizers refer to
A)the money supply and interest rates that automatically increase or decrease along with the business cycle.
B)government spending and taxes that automatically increase or decrease along with the business cycle.
C)changes in the money supply and interest rates that are intended to achieve macroeconomic policy objectives.
D)changes in federal taxes and purchases that are intended to achieve macroeconomic policy objectives.
E)restrictions on the size of government budget deficit designed to ensure the long-term fiscal stability of the government.
Unlock Deck
Unlock for access to all 303 flashcards in this deck.
Unlock Deck
k this deck
6
Which of the following is not an option for provincial governments facing rising health care costs?
A)printing more money
B)raising income and sales taxes
C)reducing funding to education and other programs
D)reducing the level of health care services provided
A)printing more money
B)raising income and sales taxes
C)reducing funding to education and other programs
D)reducing the level of health care services provided
Unlock Deck
Unlock for access to all 303 flashcards in this deck.
Unlock Deck
k this deck
7
Which of the following is an objective of fiscal policy?
A)energy independence from Middle East oil
B)drug plan coverage for all Canadians
C)discovering a cure for AIDs
D)high rates of economic growth
E)winning hockey gold at the winter Olympics
A)energy independence from Middle East oil
B)drug plan coverage for all Canadians
C)discovering a cure for AIDs
D)high rates of economic growth
E)winning hockey gold at the winter Olympics
Unlock Deck
Unlock for access to all 303 flashcards in this deck.
Unlock Deck
k this deck
8
Federal government purchases, as a percentage of GDP,
A)have risen since the early 1960s.
B)have fallen since the early 1960s.
C)have remained roughly the same since the early 1960s.
D)rose from the early 1960s until the mid-1990s, and then fell.
E)fell from the 1960s until the mid 1990s and the rose rapidly.
A)have risen since the early 1960s.
B)have fallen since the early 1960s.
C)have remained roughly the same since the early 1960s.
D)rose from the early 1960s until the mid-1990s, and then fell.
E)fell from the 1960s until the mid 1990s and the rose rapidly.
Unlock Deck
Unlock for access to all 303 flashcards in this deck.
Unlock Deck
k this deck
9
Fiscal policy refers to changes in
A)provincial and local taxes and purchases that are intended to achieve social policy objectives.
B)taxes and purchases that are intended to achieve macroeconomic policy objectives.
C)federal taxes and purchases that are intended to fund tighter airport security.
D)the money supply and interest rates that are intended to achieve macroeconomic policy objectives.
E)credit conditions, such as the requirements to qualify for a mortgage.
Unlock Deck
Unlock for access to all 303 flashcards in this deck.
Unlock Deck
k this deck
10
A decrease in the marginal income tax rate is a fiscal policy which will increase aggregate demand.
Unlock Deck
Unlock for access to all 303 flashcards in this deck.
Unlock Deck
k this deck
11
Government spending on health care has been
A)shrinking as a share of government spending.
B)steady as a share of government spending.
C)falling then rising as a share of government spending.
D)rising as a share of government spending.
E)rising and falling from year to year as various illnesses hit the population.
A)shrinking as a share of government spending.
B)steady as a share of government spending.
C)falling then rising as a share of government spending.
D)rising as a share of government spending.
E)rising and falling from year to year as various illnesses hit the population.
Unlock Deck
Unlock for access to all 303 flashcards in this deck.
Unlock Deck
k this deck
12
The increase in the amount that the government collects in taxes when the economy expands and the decrease in the amount that the government collects in taxes when the economy goes into a recession is an example of
A)automatic stabilizers.
B)discretionary fiscal policy.
C)discretionary monetary policy.
D)automatic monetary policy.
E)progressive taxation.
A)automatic stabilizers.
B)discretionary fiscal policy.
C)discretionary monetary policy.
D)automatic monetary policy.
E)progressive taxation.
Unlock Deck
Unlock for access to all 303 flashcards in this deck.
Unlock Deck
k this deck
13
Which of the following would be classified as fiscal policy?
A)The federal government passes tax cuts to encourage firms to reduce air pollution.
B)The Bank of Canada cuts interest rates to stimulate the economy.
C)A provincial government cuts taxes to help the economy of the province.
D)The federal government cuts taxes to stimulate the economy.
E)Provinces increase taxes to fund education.
Unlock Deck
Unlock for access to all 303 flashcards in this deck.
Unlock Deck
k this deck
14
The income tax system serves as an automatic stabilizer over the course of the business cycle.
Unlock Deck
Unlock for access to all 303 flashcards in this deck.
Unlock Deck
k this deck
15
Federal government expenditures, as a percentage of GDP,
A)have risen since the early 1950s to the present.
B)have fallen since the early 1950s to the present.
C)rose from 1950 to 1991, fell from 1992 to 2001, and have risen from 2001 to the present.
D)rose from 1950 to 2001 and have fallen from 2001 to the present.
E)rose from 1950 to 1980, fell from 1981 to 2001, and have risen from 2001 to the present.
Unlock Deck
Unlock for access to all 303 flashcards in this deck.
Unlock Deck
k this deck
16
If Parliament passed a one-time tax cut in order to stimulate the economy in 2015, and tax rate levels returned to their pre-2015 level in 2016, how should this tax cut affect the economy?
A)Households on average would save an amount greater than the tax cut.
B)The tax cut would stimulate spending by households.
C)The tax cut would shift the aggregate demand curve to the right.
D)The tax cut would raise the price level in 2015.
E)The tax cut would reduce investment by firms in 2015.
A)Households on average would save an amount greater than the tax cut.
B)The tax cut would stimulate spending by households.
C)The tax cut would shift the aggregate demand curve to the right.
D)The tax cut would raise the price level in 2015.
E)The tax cut would reduce investment by firms in 2015.
Unlock Deck
Unlock for access to all 303 flashcards in this deck.
Unlock Deck
k this deck
17
The increase in government spending on Employment Insurance payments to workers who lose their jobs during a recession and the decrease in government spending on unemployment insurance payments to workers during an expansion is an example of
A)automatic stabilizers.
B)discretionary fiscal policy.
C)discretionary monetary policy.
D)automatic monetary policy.
E)government purchases.
A)automatic stabilizers.
B)discretionary fiscal policy.
C)discretionary monetary policy.
D)automatic monetary policy.
E)government purchases.
Unlock Deck
Unlock for access to all 303 flashcards in this deck.
Unlock Deck
k this deck
18
The largest source of federal government revenue in 2015 was
A)the Goods and Services Tax (GST).
B)corporate income taxes.
C)personal income taxes.
D)payroll taxes to fund Employment Insurance.
E)profits of crown corporations.
A)the Goods and Services Tax (GST).
B)corporate income taxes.
C)personal income taxes.
D)payroll taxes to fund Employment Insurance.
E)profits of crown corporations.
Unlock Deck
Unlock for access to all 303 flashcards in this deck.
Unlock Deck
k this deck
19
Government spending on health care will likely
A)decrease as the population ages.
B)remain constant as the population ages.
C)increase as the population ages.
D)become unaffordable no matter what we do.
E)fall has people become healthier over time.
A)decrease as the population ages.
B)remain constant as the population ages.
C)increase as the population ages.
D)become unaffordable no matter what we do.
E)fall has people become healthier over time.
Unlock Deck
Unlock for access to all 303 flashcards in this deck.
Unlock Deck
k this deck
20
Which of the following would not be considered an automatic stabilizer?
A)legislation increasing funding for job retraining passed during a recession
B)decreasing unemployment insurance payments due to decreased jobless during an expansion
C)rising income tax collections due to rising incomes during an expansion
D)declining social housing payments due to more persons finding jobs during an expansion
E)declining sales tax (HST or GST)revenue as the economy enters a recession
Unlock Deck
Unlock for access to all 303 flashcards in this deck.
Unlock Deck
k this deck
21
Prior to the 1970s, the majority of dollars spent by government was spent at the provincial and local levels.
Unlock Deck
Unlock for access to all 303 flashcards in this deck.
Unlock Deck
k this deck
22
Which of the following is a government expenditure but is not a government purchase?
A)The federal government buys a Hummer for the military.
B)The federal government pays the salary of a Canadian Security and Intelligence Service (CSIS)agent.
C)The federal government pays out an employment insurance claim.
D)The federal government pays to support research on cancer.
E)The federal government pays a professional photographer to take pictures of the Prime Minister.
Unlock Deck
Unlock for access to all 303 flashcards in this deck.
Unlock Deck
k this deck
23
In the last 5 years, government spending on health care has
A)risen dramatically.
B)fallen slowly.
C)remained relatively constant.
D)fallen dramatically.
E)been more variable than at any time in the past.
A)risen dramatically.
B)fallen slowly.
C)remained relatively constant.
D)fallen dramatically.
E)been more variable than at any time in the past.
Unlock Deck
Unlock for access to all 303 flashcards in this deck.
Unlock Deck
k this deck
24
An increase in the money supply is a discretionary fiscal policy that will increase aggregate demand.
Unlock Deck
Unlock for access to all 303 flashcards in this deck.
Unlock Deck
k this deck
25
List the major categories of federal government expenditures.
Unlock Deck
Unlock for access to all 303 flashcards in this deck.
Unlock Deck
k this deck
26
Which of the following is a likely implication of projected changes in government health care spending?
A)falling personal income taxes
B)falling spending on non-health-related programs
C)rising spending on postsecondary education
D)falling government borrowing
E)rising government revenue
A)falling personal income taxes
B)falling spending on non-health-related programs
C)rising spending on postsecondary education
D)falling government borrowing
E)rising government revenue
Unlock Deck
Unlock for access to all 303 flashcards in this deck.
Unlock Deck
k this deck
27
Provincial health care systems receive no support from the federal government.
Unlock Deck
Unlock for access to all 303 flashcards in this deck.
Unlock Deck
k this deck
28
________ is/are the largest source of revenue collected by the federal government.
A)Corporate income taxes
B)Personal income taxes
C)The Goods and Services Tax (GST)
D)Premiums on employment insurance
E)Profits from crown corporations
A)Corporate income taxes
B)Personal income taxes
C)The Goods and Services Tax (GST)
D)Premiums on employment insurance
E)Profits from crown corporations
Unlock Deck
Unlock for access to all 303 flashcards in this deck.
Unlock Deck
k this deck
29
Fiscal policy is defined as changes in federal ________ and ________ to achieve macroeconomic objectives such as price stability, high rates of economic growth, and high employment.
A)taxes; interest rates
B)taxes; the money supply
C)interest rates; the money supply
D)taxes; expenditures
E)government employment; transfers to provinces
A)taxes; interest rates
B)taxes; the money supply
C)interest rates; the money supply
D)taxes; expenditures
E)government employment; transfers to provinces
Unlock Deck
Unlock for access to all 303 flashcards in this deck.
Unlock Deck
k this deck
30
The majority of dollars spent by government prior to 1970 was spending at the ________ level.Since the 1970s, the majority of spending by government in Canada is spent at the ________ level.
A)federal; provincial and local
B)provincial and local; federal
C)provincial and local; provincial
D)local; provincial
E)international; local
A)federal; provincial and local
B)provincial and local; federal
C)provincial and local; provincial
D)local; provincial
E)international; local
Unlock Deck
Unlock for access to all 303 flashcards in this deck.
Unlock Deck
k this deck
31
As a percentage of GDP, government expenditures ________ from 1960 to the early 1990s, ________ from 1992 to 2008, and have ________ since 2008.
A)rose; fell; risen
B)fell; fell; risen
C)rose; rose; fallen
D)fell; rose; fallen
E)rose; rose; risen
A)rose; fell; risen
B)fell; fell; risen
C)rose; rose; fallen
D)fell; rose; fallen
E)rose; rose; risen
Unlock Deck
Unlock for access to all 303 flashcards in this deck.
Unlock Deck
k this deck
32
Included in government expenditures are government purchases and transfer payments.
Unlock Deck
Unlock for access to all 303 flashcards in this deck.
Unlock Deck
k this deck
33
Active changes in tax and spending by government intended to smooth out the business cycle are called ________, and changes in taxes and spending that occur passively over the business cycle are called ________.
A)automatic stabilizers; discretionary fiscal policy
B)discretionary fiscal policy; automatic stabilizers
C)automatic stabilizers; monetary policy
D)discretionary fiscal policy; conscious fiscal policy
E)active monetary policy; passive monetary policy
A)automatic stabilizers; discretionary fiscal policy
B)discretionary fiscal policy; automatic stabilizers
C)automatic stabilizers; monetary policy
D)discretionary fiscal policy; conscious fiscal policy
E)active monetary policy; passive monetary policy
Unlock Deck
Unlock for access to all 303 flashcards in this deck.
Unlock Deck
k this deck
34
If government spending is to be considered fiscal policy its objective must be
A)changing real GDP and employment.
B)changing tax revenues and the federal budget surplus.
C)changing disposable income and interest rates.
D)changing the money supply and money demand.
E)changing the quality of physical infrastructure.
A)changing real GDP and employment.
B)changing tax revenues and the federal budget surplus.
C)changing disposable income and interest rates.
D)changing the money supply and money demand.
E)changing the quality of physical infrastructure.
Unlock Deck
Unlock for access to all 303 flashcards in this deck.
Unlock Deck
k this deck
35
Which of the following is the largest category of federal government expenditures?
A)health care spending
B)transfer payments to individuals
C)interest on government debt
D)grants to provincial and local governments
E)military spending
A)health care spending
B)transfer payments to individuals
C)interest on government debt
D)grants to provincial and local governments
E)military spending
Unlock Deck
Unlock for access to all 303 flashcards in this deck.
Unlock Deck
k this deck
36
Which of the following is an example of discretionary fiscal policy?
A)an increase in employment insurance payments during a recession
B)an increase in income tax receipts with rising income during an expansion
C)tax cuts passed by the government to combat a recession
D)a decrease in employment insurance payments during an expansion or boom
E)the replacement of the sewer system after a major sewerline break
Unlock Deck
Unlock for access to all 303 flashcards in this deck.
Unlock Deck
k this deck
37
Forecasts of health care spending in Canada suggest that by 2040, health care spending will increase by
A)3 percent of GDP.
B)8 percent of GDP.
C)10 percent of GDP.
D)13 percent of GDP.
E)42 percent of GDP.
A)3 percent of GDP.
B)8 percent of GDP.
C)10 percent of GDP.
D)13 percent of GDP.
E)42 percent of GDP.
Unlock Deck
Unlock for access to all 303 flashcards in this deck.
Unlock Deck
k this deck
38
Health care costs are likely to
A)decline in the future as more Canadians adopt healthier lifestyles.
B)increase as the population ages.
C)increase as more people immigrate to Canada.
D)decline as the Canadian population gets younger on average.
E)decline as Canadians are adopting healthier life styles.
A)decline in the future as more Canadians adopt healthier lifestyles.
B)increase as the population ages.
C)increase as more people immigrate to Canada.
D)decline as the Canadian population gets younger on average.
E)decline as Canadians are adopting healthier life styles.
Unlock Deck
Unlock for access to all 303 flashcards in this deck.
Unlock Deck
k this deck
39
Which of the following would be considered an active fiscal policy?
A)The Bank of Canada increases the money supply.
B)Tax incentives are offered to encourage the purchase of fuel-efficient cars.
C)Spending on military missions in Afghanistan is increased to promote national security.
D)A tax cut is implemented to stimulate spending during a recession.
E)The province of Ontario building new hockey rinks to encourage healthier living.
Unlock Deck
Unlock for access to all 303 flashcards in this deck.
Unlock Deck
k this deck
40
What is the difference between fiscal policy and monetary policy?
Unlock Deck
Unlock for access to all 303 flashcards in this deck.
Unlock Deck
k this deck
41
Tax cuts on business income ________ aggregate demand.
A)would decrease
B)would increase
C)would not change
D)may increase or decrease
A)would decrease
B)would increase
C)would not change
D)may increase or decrease
Unlock Deck
Unlock for access to all 303 flashcards in this deck.
Unlock Deck
k this deck
42
Give an example of an automatic stabilizer.Explain how automatic stabilizers work in the case of recession.
Unlock Deck
Unlock for access to all 303 flashcards in this deck.
Unlock Deck
k this deck
43
Figure 12.1 Alt text for Figure 12.1: In figure 12.1, a graph comparing real GDP and price level.
Long description for Figure 12.1: The x-axis is labelled, real GDP (trillions of 2007 dollars)and the y-axis is labelled, price level (CPI).5 lines are shown; AD1, AD2, AD3, LRAS, and SRAS1.Line AD1 begins in the top left corner and slopes down to the end of the x-axis.Line AD2 follows the same slope, but is plotted to the right.Similarly, line AD3 also has the same slope and is plotted to the right of AD2.Line SRAS1 begins close to the vertex and slopes up to the top right corner.Line LRAS is perpendicular to the x-axis, passing through points D, B, and E.Lines AD1 and SRAS1 intersect at point A.Lines AD2, LRAS, and SRAS1 intersect at point B.Lines AD3 and SRAS1 intersect at point C.Lines AD1 and LRAS intersect at point E.Lines AD3 and LRAS intersect at point D.The area between lines AD1 and AD2 is indicated by a right pointing arrow.The area between lines AD2 and AD3 is indicated by a right pointing arrow.
Refer to Figure 12.1.Suppose the economy is in short-run equilibrium below potential GDP and no fiscal or monetary policy is pursued.Using the static AD-AS model in the figure above, this would be depicted as a movement from
A)A to B.
B)B to C.
C)C to B.
D)B to A.
E)A to E.
Alt text for Figure 12.1: In figure 12.1, a graph comparing real GDP and price level.Long description for Figure 12.1: The x-axis is labelled, real GDP (trillions of 2007 dollars)and the y-axis is labelled, price level (CPI).5 lines are shown; AD1, AD2, AD3, LRAS, and SRAS1.Line AD1 begins in the top left corner and slopes down to the end of the x-axis.Line AD2 follows the same slope, but is plotted to the right.Similarly, line AD3 also has the same slope and is plotted to the right of AD2.Line SRAS1 begins close to the vertex and slopes up to the top right corner.Line LRAS is perpendicular to the x-axis, passing through points D, B, and E.Lines AD1 and SRAS1 intersect at point A.Lines AD2, LRAS, and SRAS1 intersect at point B.Lines AD3 and SRAS1 intersect at point C.Lines AD1 and LRAS intersect at point E.Lines AD3 and LRAS intersect at point D.The area between lines AD1 and AD2 is indicated by a right pointing arrow.The area between lines AD2 and AD3 is indicated by a right pointing arrow.
Refer to Figure 12.1.Suppose the economy is in short-run equilibrium below potential GDP and no fiscal or monetary policy is pursued.Using the static AD-AS model in the figure above, this would be depicted as a movement from
A)A to B.
B)B to C.
C)C to B.
D)B to A.
E)A to E.
Unlock Deck
Unlock for access to all 303 flashcards in this deck.
Unlock Deck
k this deck
44
Parliament carries out fiscal policy through changes in
A)interest rates and the money supply.
B)taxes and the interest rate.
C)government purchases and the money supply.
D)government purchases and taxes.
E)transfers to other government and regulations.
A)interest rates and the money supply.
B)taxes and the interest rate.
C)government purchases and the money supply.
D)government purchases and taxes.
E)transfers to other government and regulations.
Unlock Deck
Unlock for access to all 303 flashcards in this deck.
Unlock Deck
k this deck
45
Which of the following is considered contractionary fiscal policy?
A)Parliament increases the income tax rate.
B)Parliament increases the Canada Health Transfer.
C)Legislation removes a college tuition deduction from federal income taxes.
D)The Ontario legislature cuts highway spending to balance its budget.
E)The Saskatchewan government increases spending to clean up abandoned oil wells.
Unlock Deck
Unlock for access to all 303 flashcards in this deck.
Unlock Deck
k this deck
46
Figure 12.1 Alt text for Figure 12.1: In figure 12.1, a graph comparing real GDP and price level.
Long description for Figure 12.1: The x-axis is labelled, real GDP (trillions of 2007 dollars)and the y-axis is labelled, price level (CPI).5 lines are shown; AD1, AD2, AD3, LRAS, and SRAS1.Line AD1 begins in the top left corner and slopes down to the end of the x-axis.Line AD2 follows the same slope, but is plotted to the right.Similarly, line AD3 also has the same slope and is plotted to the right of AD2.Line SRAS1 begins close to the vertex and slopes up to the top right corner.Line LRAS is perpendicular to the x-axis, passing through points D, B, and E.Lines AD1 and SRAS1 intersect at point A.Lines AD2, LRAS, and SRAS1 intersect at point B.Lines AD3 and SRAS1 intersect at point C.Lines AD1 and LRAS intersect at point E.Lines AD3 and LRAS intersect at point D.The area between lines AD1 and AD2 is indicated by a right pointing arrow.The area between lines AD2 and AD3 is indicated by a right pointing arrow.
Refer to Figure 12.1.Suppose the economy is in short-run equilibrium above potential GDP and automatic stabilizers move the economy back to long-run equilibrium.Using the static AD-AS model in the figure above, this would be depicted as a movement from
A)D to C.
B)A to E.
C)C to B.
D)B to A.
E)E to A.
Alt text for Figure 12.1: In figure 12.1, a graph comparing real GDP and price level.Long description for Figure 12.1: The x-axis is labelled, real GDP (trillions of 2007 dollars)and the y-axis is labelled, price level (CPI).5 lines are shown; AD1, AD2, AD3, LRAS, and SRAS1.Line AD1 begins in the top left corner and slopes down to the end of the x-axis.Line AD2 follows the same slope, but is plotted to the right.Similarly, line AD3 also has the same slope and is plotted to the right of AD2.Line SRAS1 begins close to the vertex and slopes up to the top right corner.Line LRAS is perpendicular to the x-axis, passing through points D, B, and E.Lines AD1 and SRAS1 intersect at point A.Lines AD2, LRAS, and SRAS1 intersect at point B.Lines AD3 and SRAS1 intersect at point C.Lines AD1 and LRAS intersect at point E.Lines AD3 and LRAS intersect at point D.The area between lines AD1 and AD2 is indicated by a right pointing arrow.The area between lines AD2 and AD3 is indicated by a right pointing arrow.
Refer to Figure 12.1.Suppose the economy is in short-run equilibrium above potential GDP and automatic stabilizers move the economy back to long-run equilibrium.Using the static AD-AS model in the figure above, this would be depicted as a movement from
A)D to C.
B)A to E.
C)C to B.
D)B to A.
E)E to A.
Unlock Deck
Unlock for access to all 303 flashcards in this deck.
Unlock Deck
k this deck
47
Figure 12.1 Alt text for Figure 12.1: In figure 12.1, a graph comparing real GDP and price level.
Long description for Figure 12.1: The x-axis is labelled, real GDP (trillions of 2007 dollars)and the y-axis is labelled, price level (CPI).5 lines are shown; AD1, AD2, AD3, LRAS, and SRAS1.Line AD1 begins in the top left corner and slopes down to the end of the x-axis.Line AD2 follows the same slope, but is plotted to the right.Similarly, line AD3 also has the same slope and is plotted to the right of AD2.Line SRAS1 begins close to the vertex and slopes up to the top right corner.Line LRAS is perpendicular to the x-axis, passing through points D, B, and E.Lines AD1 and SRAS1 intersect at point A.Lines AD2, LRAS, and SRAS1 intersect at point B.Lines AD3 and SRAS1 intersect at point C.Lines AD1 and LRAS intersect at point E.Lines AD3 and LRAS intersect at point D.The area between lines AD1 and AD2 is indicated by a right pointing arrow.The area between lines AD2 and AD3 is indicated by a right pointing arrow.
Refer to Figure 12.1.Suppose the economy is in a recession and expansionary fiscal policy is pursued.Using the static AD-AS model in the figure above, this would be depicted as a movement from
A)A to B.
B)B to C.
C)C to B.
D)B to A.
E)A to E.
Alt text for Figure 12.1: In figure 12.1, a graph comparing real GDP and price level.Long description for Figure 12.1: The x-axis is labelled, real GDP (trillions of 2007 dollars)and the y-axis is labelled, price level (CPI).5 lines are shown; AD1, AD2, AD3, LRAS, and SRAS1.Line AD1 begins in the top left corner and slopes down to the end of the x-axis.Line AD2 follows the same slope, but is plotted to the right.Similarly, line AD3 also has the same slope and is plotted to the right of AD2.Line SRAS1 begins close to the vertex and slopes up to the top right corner.Line LRAS is perpendicular to the x-axis, passing through points D, B, and E.Lines AD1 and SRAS1 intersect at point A.Lines AD2, LRAS, and SRAS1 intersect at point B.Lines AD3 and SRAS1 intersect at point C.Lines AD1 and LRAS intersect at point E.Lines AD3 and LRAS intersect at point D.The area between lines AD1 and AD2 is indicated by a right pointing arrow.The area between lines AD2 and AD3 is indicated by a right pointing arrow.
Refer to Figure 12.1.Suppose the economy is in a recession and expansionary fiscal policy is pursued.Using the static AD-AS model in the figure above, this would be depicted as a movement from
A)A to B.
B)B to C.
C)C to B.
D)B to A.
E)A to E.
Unlock Deck
Unlock for access to all 303 flashcards in this deck.
Unlock Deck
k this deck
48
Tax cuts on business income increase aggregate demand by increasing
A)business investment spending.
B)consumption spending.
C)government spending.
D)wage rates.
E)net exports.
A)business investment spending.
B)consumption spending.
C)government spending.
D)wage rates.
E)net exports.
Unlock Deck
Unlock for access to all 303 flashcards in this deck.
Unlock Deck
k this deck
49
An increase in individual income taxes ________ disposable income, which ________ consumption spending.
A)increases; increases
B)increases; decreases
C)decreases; increases
D)decreases; decreases
A)increases; increases
B)increases; decreases
C)decreases; increases
D)decreases; decreases
Unlock Deck
Unlock for access to all 303 flashcards in this deck.
Unlock Deck
k this deck
50
Figure 12.1 Alt text for Figure 12.1: In figure 12.1, a graph comparing real GDP and price level.
Long description for Figure 12.1: The x-axis is labelled, real GDP (trillions of 2007 dollars)and the y-axis is labelled, price level (CPI).5 lines are shown; AD1, AD2, AD3, LRAS, and SRAS1.Line AD1 begins in the top left corner and slopes down to the end of the x-axis.Line AD2 follows the same slope, but is plotted to the right.Similarly, line AD3 also has the same slope and is plotted to the right of AD2.Line SRAS1 begins close to the vertex and slopes up to the top right corner.Line LRAS is perpendicular to the x-axis, passing through points D, B, and E.Lines AD1 and SRAS1 intersect at point A.Lines AD2, LRAS, and SRAS1 intersect at point B.Lines AD3 and SRAS1 intersect at point C.Lines AD1 and LRAS intersect at point E.Lines AD3 and LRAS intersect at point D.The area between lines AD1 and AD2 is indicated by a right pointing arrow.The area between lines AD2 and AD3 is indicated by a right pointing arrow.
Refer to Figure 12.1.Suppose the economy is in short-run equilibrium below potential GDP and Parliament and the prime minister lower taxes to move the economy back to long-run equilibrium.Using the static AD-AS model in the figure above, this would be depicted as a movement from
A)A to B.
B)B to C.
C)C to B.
D)B to A.
E)A to E.
Alt text for Figure 12.1: In figure 12.1, a graph comparing real GDP and price level.Long description for Figure 12.1: The x-axis is labelled, real GDP (trillions of 2007 dollars)and the y-axis is labelled, price level (CPI).5 lines are shown; AD1, AD2, AD3, LRAS, and SRAS1.Line AD1 begins in the top left corner and slopes down to the end of the x-axis.Line AD2 follows the same slope, but is plotted to the right.Similarly, line AD3 also has the same slope and is plotted to the right of AD2.Line SRAS1 begins close to the vertex and slopes up to the top right corner.Line LRAS is perpendicular to the x-axis, passing through points D, B, and E.Lines AD1 and SRAS1 intersect at point A.Lines AD2, LRAS, and SRAS1 intersect at point B.Lines AD3 and SRAS1 intersect at point C.Lines AD1 and LRAS intersect at point E.Lines AD3 and LRAS intersect at point D.The area between lines AD1 and AD2 is indicated by a right pointing arrow.The area between lines AD2 and AD3 is indicated by a right pointing arrow.
Refer to Figure 12.1.Suppose the economy is in short-run equilibrium below potential GDP and Parliament and the prime minister lower taxes to move the economy back to long-run equilibrium.Using the static AD-AS model in the figure above, this would be depicted as a movement from
A)A to B.
B)B to C.
C)C to B.
D)B to A.
E)A to E.
Unlock Deck
Unlock for access to all 303 flashcards in this deck.
Unlock Deck
k this deck
51
Figure 12.1 Alt text for Figure 12.1: In figure 12.1, a graph comparing real GDP and price level.
Long description for Figure 12.1: The x-axis is labelled, real GDP (trillions of 2007 dollars)and the y-axis is labelled, price level (CPI).5 lines are shown; AD1, AD2, AD3, LRAS, and SRAS1.Line AD1 begins in the top left corner and slopes down to the end of the x-axis.Line AD2 follows the same slope, but is plotted to the right.Similarly, line AD3 also has the same slope and is plotted to the right of AD2.Line SRAS1 begins close to the vertex and slopes up to the top right corner.Line LRAS is perpendicular to the x-axis, passing through points D, B, and E.Lines AD1 and SRAS1 intersect at point A.Lines AD2, LRAS, and SRAS1 intersect at point B.Lines AD3 and SRAS1 intersect at point C.Lines AD1 and LRAS intersect at point E.Lines AD3 and LRAS intersect at point D.The area between lines AD1 and AD2 is indicated by a right pointing arrow.The area between lines AD2 and AD3 is indicated by a right pointing arrow.
Refer to Figure 12.1.An increase in taxes would be depicted as a movement from ________, using the static AD-AS model in the figure above.
A)E to B
B)B to C
C)A to B
D)B to A
E)C to D
Alt text for Figure 12.1: In figure 12.1, a graph comparing real GDP and price level.Long description for Figure 12.1: The x-axis is labelled, real GDP (trillions of 2007 dollars)and the y-axis is labelled, price level (CPI).5 lines are shown; AD1, AD2, AD3, LRAS, and SRAS1.Line AD1 begins in the top left corner and slopes down to the end of the x-axis.Line AD2 follows the same slope, but is plotted to the right.Similarly, line AD3 also has the same slope and is plotted to the right of AD2.Line SRAS1 begins close to the vertex and slopes up to the top right corner.Line LRAS is perpendicular to the x-axis, passing through points D, B, and E.Lines AD1 and SRAS1 intersect at point A.Lines AD2, LRAS, and SRAS1 intersect at point B.Lines AD3 and SRAS1 intersect at point C.Lines AD1 and LRAS intersect at point E.Lines AD3 and LRAS intersect at point D.The area between lines AD1 and AD2 is indicated by a right pointing arrow.The area between lines AD2 and AD3 is indicated by a right pointing arrow.
Refer to Figure 12.1.An increase in taxes would be depicted as a movement from ________, using the static AD-AS model in the figure above.
A)E to B
B)B to C
C)A to B
D)B to A
E)C to D
Unlock Deck
Unlock for access to all 303 flashcards in this deck.
Unlock Deck
k this deck
52
An increase in government purchases will increase aggregate demand because
A)government expenditures are a component of aggregate demand.
B)consumption expenditures are a component of aggregate demand.
C)the decline in the price level will increase demand.
D)the decline in the interest rate will increase demand.
E)increases in government purchases cause an increase in aggregate supply.
Unlock Deck
Unlock for access to all 303 flashcards in this deck.
Unlock Deck
k this deck
53
Figure 12.1 Alt text for Figure 12.1: In figure 12.1, a graph comparing real GDP and price level.
Long description for Figure 12.1: The x-axis is labelled, real GDP (trillions of 2007 dollars)and the y-axis is labelled, price level (CPI).5 lines are shown; AD1, AD2, AD3, LRAS, and SRAS1.Line AD1 begins in the top left corner and slopes down to the end of the x-axis.Line AD2 follows the same slope, but is plotted to the right.Similarly, line AD3 also has the same slope and is plotted to the right of AD2.Line SRAS1 begins close to the vertex and slopes up to the top right corner.Line LRAS is perpendicular to the x-axis, passing through points D, B, and E.Lines AD1 and SRAS1 intersect at point A.Lines AD2, LRAS, and SRAS1 intersect at point B.Lines AD3 and SRAS1 intersect at point C.Lines AD1 and LRAS intersect at point E.Lines AD3 and LRAS intersect at point D.The area between lines AD1 and AD2 is indicated by a right pointing arrow.The area between lines AD2 and AD3 is indicated by a right pointing arrow.
Refer to Figure 12.1.Suppose the economy is in short-run equilibrium above potential GDP and no policy is pursued.Using the static AD-AS model in the figure above, this would be depicted as a movement from
A)D to C.
B)A to E.
C)C to D.
D)C to B.
E)E to A.
Alt text for Figure 12.1: In figure 12.1, a graph comparing real GDP and price level.Long description for Figure 12.1: The x-axis is labelled, real GDP (trillions of 2007 dollars)and the y-axis is labelled, price level (CPI).5 lines are shown; AD1, AD2, AD3, LRAS, and SRAS1.Line AD1 begins in the top left corner and slopes down to the end of the x-axis.Line AD2 follows the same slope, but is plotted to the right.Similarly, line AD3 also has the same slope and is plotted to the right of AD2.Line SRAS1 begins close to the vertex and slopes up to the top right corner.Line LRAS is perpendicular to the x-axis, passing through points D, B, and E.Lines AD1 and SRAS1 intersect at point A.Lines AD2, LRAS, and SRAS1 intersect at point B.Lines AD3 and SRAS1 intersect at point C.Lines AD1 and LRAS intersect at point E.Lines AD3 and LRAS intersect at point D.The area between lines AD1 and AD2 is indicated by a right pointing arrow.The area between lines AD2 and AD3 is indicated by a right pointing arrow.
Refer to Figure 12.1.Suppose the economy is in short-run equilibrium above potential GDP and no policy is pursued.Using the static AD-AS model in the figure above, this would be depicted as a movement from
A)D to C.
B)A to E.
C)C to D.
D)C to B.
E)E to A.
Unlock Deck
Unlock for access to all 303 flashcards in this deck.
Unlock Deck
k this deck
54
What is fiscal policy and who is responsible for fiscal policy?
Unlock Deck
Unlock for access to all 303 flashcards in this deck.
Unlock Deck
k this deck
55
Fiscal policy is determined by
A)the Bank of Canada.
B)the Minister of Finance and the Governor of the Bank of Canada.
C)Parliament and the Bank of Canada.
D)Parliament.
E)the Prime Minister's Office (PMO).
A)the Bank of Canada.
B)the Minister of Finance and the Governor of the Bank of Canada.
C)Parliament and the Bank of Canada.
D)Parliament.
E)the Prime Minister's Office (PMO).
Unlock Deck
Unlock for access to all 303 flashcards in this deck.
Unlock Deck
k this deck
56
Expansionary fiscal policy to prevent real GDP from falling below potential real GDP would cause the inflation rate to be ________ and real GDP to be ________.
A)higher; higher
B)higher; lower
C)lower; higher
D)lower; lower
A)higher; higher
B)higher; lower
C)lower; higher
D)lower; lower
Unlock Deck
Unlock for access to all 303 flashcards in this deck.
Unlock Deck
k this deck
57
Expansionary fiscal policy involves
A)increasing government purchases or decreasing taxes.
B)increasing taxes or decreasing government purchases.
C)increasing the money supply and decreasing interest rates.
D)decreasing the money supply and increasing interest rates.
E)increasing taxes on the wealthy and increasing transfers to the poor.
Unlock Deck
Unlock for access to all 303 flashcards in this deck.
Unlock Deck
k this deck
58
If the economy is falling below potential real GDP, which of the following would be an appropriate fiscal policy to bring the economy back to long-run aggregate supply?
A)an increase in the money supply and a decrease in interest rates
B)an increase in government purchases
C)an increase in oil prices
D)an increase in taxes
E)a decrease in the supply government services
A)an increase in the money supply and a decrease in interest rates
B)an increase in government purchases
C)an increase in oil prices
D)an increase in taxes
E)a decrease in the supply government services
Unlock Deck
Unlock for access to all 303 flashcards in this deck.
Unlock Deck
k this deck
59
What is the difference between federal purchases and federal expenditures?
Unlock Deck
Unlock for access to all 303 flashcards in this deck.
Unlock Deck
k this deck
60
Figure 12.1 Alt text for Figure 12.1: In figure 12.1, a graph comparing real GDP and price level.
Long description for Figure 12.1: The x-axis is labelled, real GDP (trillions of 2007 dollars)and the y-axis is labelled, price level (CPI).5 lines are shown; AD1, AD2, AD3, LRAS, and SRAS1.Line AD1 begins in the top left corner and slopes down to the end of the x-axis.Line AD2 follows the same slope, but is plotted to the right.Similarly, line AD3 also has the same slope and is plotted to the right of AD2.Line SRAS1 begins close to the vertex and slopes up to the top right corner.Line LRAS is perpendicular to the x-axis, passing through points D, B, and E.Lines AD1 and SRAS1 intersect at point A.Lines AD2, LRAS, and SRAS1 intersect at point B.Lines AD3 and SRAS1 intersect at point C.Lines AD1 and LRAS intersect at point E.Lines AD3 and LRAS intersect at point D.The area between lines AD1 and AD2 is indicated by a right pointing arrow.The area between lines AD2 and AD3 is indicated by a right pointing arrow.
Refer to Figure 12.1.Suppose the economy is in short-run equilibrium above potential GDP and wages and prices are rising.If contractionary policy is used to move the economy back to long run equilibrium, this would be depicted as a movement from ________ using the static AD-AS model in the figure above.
A)D to C
B)C to B
C)A to E
D)B to A
E)E to A
Alt text for Figure 12.1: In figure 12.1, a graph comparing real GDP and price level.Long description for Figure 12.1: The x-axis is labelled, real GDP (trillions of 2007 dollars)and the y-axis is labelled, price level (CPI).5 lines are shown; AD1, AD2, AD3, LRAS, and SRAS1.Line AD1 begins in the top left corner and slopes down to the end of the x-axis.Line AD2 follows the same slope, but is plotted to the right.Similarly, line AD3 also has the same slope and is plotted to the right of AD2.Line SRAS1 begins close to the vertex and slopes up to the top right corner.Line LRAS is perpendicular to the x-axis, passing through points D, B, and E.Lines AD1 and SRAS1 intersect at point A.Lines AD2, LRAS, and SRAS1 intersect at point B.Lines AD3 and SRAS1 intersect at point C.Lines AD1 and LRAS intersect at point E.Lines AD3 and LRAS intersect at point D.The area between lines AD1 and AD2 is indicated by a right pointing arrow.The area between lines AD2 and AD3 is indicated by a right pointing arrow.
Refer to Figure 12.1.Suppose the economy is in short-run equilibrium above potential GDP and wages and prices are rising.If contractionary policy is used to move the economy back to long run equilibrium, this would be depicted as a movement from ________ using the static AD-AS model in the figure above.
A)D to C
B)C to B
C)A to E
D)B to A
E)E to A
Unlock Deck
Unlock for access to all 303 flashcards in this deck.
Unlock Deck
k this deck
61
Tax increases on business income decrease aggregate demand by decreasing
A)business investment spending.
B)consumption spending.
C)government spending.
D)wage rates.
E)net exports.
A)business investment spending.
B)consumption spending.
C)government spending.
D)wage rates.
E)net exports.
Unlock Deck
Unlock for access to all 303 flashcards in this deck.
Unlock Deck
k this deck
62
Figure 12.3 Alt text for Figure 12.3: In figure 12.3, a graph comparing real GDP and price level.
Long description for Figure 12.3: The x-axis is labelled, real GDP (trillions of 2007 dollars)and the y-axis is labelled, price level (CPI).4 lines are shown; AD1, AD2, LRAS, and SRAS.Line AD1 begins at the top left corner and slopes down to the end of the x-axis.Line AD2 follows the same slope as line AD1, but is plotted to the right.Line SRAS begins close to the vertex and slopes up to the top right corner.Line LRAS is perpendicular to the x-axis and passes through point B.Lines AD1 and SRAS intersect at point A.Lines AD2, LRAS, and SRAS intersect at point B.
Refer to Figure 12.3.In the graph above, suppose the economy is initially at point A.The movement of the economy to point B as shown in the graph illustrates the effect of which of the following policy actions by the federal government?
A)a decrease in income taxes
B)a decrease in interest rates
C)a decrease in government purchases
D)an increase in the money supply
E)an increase in the number of national statutory holidays
Alt text for Figure 12.3: In figure 12.3, a graph comparing real GDP and price level.Long description for Figure 12.3: The x-axis is labelled, real GDP (trillions of 2007 dollars)and the y-axis is labelled, price level (CPI).4 lines are shown; AD1, AD2, LRAS, and SRAS.Line AD1 begins at the top left corner and slopes down to the end of the x-axis.Line AD2 follows the same slope as line AD1, but is plotted to the right.Line SRAS begins close to the vertex and slopes up to the top right corner.Line LRAS is perpendicular to the x-axis and passes through point B.Lines AD1 and SRAS intersect at point A.Lines AD2, LRAS, and SRAS intersect at point B.
Refer to Figure 12.3.In the graph above, suppose the economy is initially at point A.The movement of the economy to point B as shown in the graph illustrates the effect of which of the following policy actions by the federal government?
A)a decrease in income taxes
B)a decrease in interest rates
C)a decrease in government purchases
D)an increase in the money supply
E)an increase in the number of national statutory holidays
Unlock Deck
Unlock for access to all 303 flashcards in this deck.
Unlock Deck
k this deck
63
Contractionary fiscal policy is used to decrease aggregate demand in an attempt to fight rising inflation.
Unlock Deck
Unlock for access to all 303 flashcards in this deck.
Unlock Deck
k this deck
64
Lowering the personal income tax will increase household disposable income and consumption spending.
Unlock Deck
Unlock for access to all 303 flashcards in this deck.
Unlock Deck
k this deck
65
If the economy is growing beyond potential real GDP, which of the following would be an appropriate fiscal policy to bring the economy back to long-run aggregate supply?
A)an increase in the money supply and a decrease in interest rates
B)an increase in government purchases
C)an increase in oil prices
D)an increase in taxes
E)an increase transfers people
A)an increase in the money supply and a decrease in interest rates
B)an increase in government purchases
C)an increase in oil prices
D)an increase in taxes
E)an increase transfers people
Unlock Deck
Unlock for access to all 303 flashcards in this deck.
Unlock Deck
k this deck
66
Which of the following is considered expansionary fiscal policy?
A)Parliament decreases the income tax rate.
B)The federal government increases defence spending.
C)Legislation increases a university tuition deduction from federal income taxes.
D)The Alberta legislature cuts highway spending to balance its budget.
E)The Ontario government increases electricity bills to encourage energy conservation.
Unlock Deck
Unlock for access to all 303 flashcards in this deck.
Unlock Deck
k this deck
67
Decreasing government spending ________ the price level and ________ equilibrium real GDP.
A)decreases; increases
B)increases; decreases
C)increases; increases
D)decreases; decreases
A)decreases; increases
B)increases; decreases
C)increases; increases
D)decreases; decreases
Unlock Deck
Unlock for access to all 303 flashcards in this deck.
Unlock Deck
k this deck
68
Expansionary fiscal policy involves increasing government purchases or increasing taxes.
Unlock Deck
Unlock for access to all 303 flashcards in this deck.
Unlock Deck
k this deck
69
Expansionary fiscal policy will
A)shift the aggregate demand curve to the left.
B)shift the aggregate demand curve to the right.
C)not shift the aggregate demand curve.
D)shift the short-run aggregate supply curve to the left.
E)make the aggregate demand curve steeper.
A)shift the aggregate demand curve to the left.
B)shift the aggregate demand curve to the right.
C)not shift the aggregate demand curve.
D)shift the short-run aggregate supply curve to the left.
E)make the aggregate demand curve steeper.
Unlock Deck
Unlock for access to all 303 flashcards in this deck.
Unlock Deck
k this deck
70
The problem typically during a recession is not that there is too little money, but too little spending.If the problem was too little money, what would be its cause? If the problem was too little spending, what could be its cause?
Unlock Deck
Unlock for access to all 303 flashcards in this deck.
Unlock Deck
k this deck
71
Figure 12.2 Alt text for Figure 12.2: In figure 12.2, a graph comparing real GDP and price level.
Long description for Figure 12.2: The x-axis is labelled, real GDP (trillions of 2007 dollars)and the y-axis is labelled, price level (CPI).3 lines are shown; AD, LRAS, and SRAS.Line AD begins at the top left corner and slopes down to the end of the x-axis.Line SRAS begins near the bottom left corner and slopes up to the top right corner.Line LRAS is perpendicular to the x-axis, and intersects lines AD and SRAS at point A.
Refer to Figure 12.2.In the graph above, if the economy is at point A, an appropriate fiscal policy by the federal government would be to
A)decrease the required reserve ratio.
B)sell government securities.
C)increase government expenditures.
D)decrease transfer payments.
E)increase the marginal income tax rate for the 1%.
Alt text for Figure 12.2: In figure 12.2, a graph comparing real GDP and price level.Long description for Figure 12.2: The x-axis is labelled, real GDP (trillions of 2007 dollars)and the y-axis is labelled, price level (CPI).3 lines are shown; AD, LRAS, and SRAS.Line AD begins at the top left corner and slopes down to the end of the x-axis.Line SRAS begins near the bottom left corner and slopes up to the top right corner.Line LRAS is perpendicular to the x-axis, and intersects lines AD and SRAS at point A.
Refer to Figure 12.2.In the graph above, if the economy is at point A, an appropriate fiscal policy by the federal government would be to
A)decrease the required reserve ratio.
B)sell government securities.
C)increase government expenditures.
D)decrease transfer payments.
E)increase the marginal income tax rate for the 1%.
Unlock Deck
Unlock for access to all 303 flashcards in this deck.
Unlock Deck
k this deck
72
Contractionary fiscal policy to prevent real GDP from rising above potential real GDP would cause the inflation rate to be ________ and real GDP to be ________.
A)higher; higher
B)higher; lower
C)lower; higher
D)lower; lower
A)higher; higher
B)higher; lower
C)lower; higher
D)lower; lower
Unlock Deck
Unlock for access to all 303 flashcards in this deck.
Unlock Deck
k this deck
73
Which of the following is an appropriate discretionary fiscal policy if equilibrium real GDP falls below potential real GDP?
A)an increase in government purchases
B)an increase in the supply of money
C)an increase in individual income taxes
D)a decrease in transfer payments
E)an increase in government support for environmental research
A)an increase in government purchases
B)an increase in the supply of money
C)an increase in individual income taxes
D)a decrease in transfer payments
E)an increase in government support for environmental research
Unlock Deck
Unlock for access to all 303 flashcards in this deck.
Unlock Deck
k this deck
74
Figure 12.2 Alt text for Figure 12.2: In figure 12.2, a graph comparing real GDP and price level.
Long description for Figure 12.2: The x-axis is labelled, real GDP (trillions of 2007 dollars)and the y-axis is labelled, price level (CPI).3 lines are shown; AD, LRAS, and SRAS.Line AD begins at the top left corner and slopes down to the end of the x-axis.Line SRAS begins near the bottom left corner and slopes up to the top right corner.Line LRAS is perpendicular to the x-axis, and intersects lines AD and SRAS at point A.
Refer to Figure 12.2.In the graph above, if the economy is at point A, an appropriate fiscal policy by the federal government would be to
A)lower the discount rate of interest.
B)execute an open market sale of government securities.
C)increase government transfer payments.
D)increase marginal income tax rates.
E)decrease government spending.
Alt text for Figure 12.2: In figure 12.2, a graph comparing real GDP and price level.Long description for Figure 12.2: The x-axis is labelled, real GDP (trillions of 2007 dollars)and the y-axis is labelled, price level (CPI).3 lines are shown; AD, LRAS, and SRAS.Line AD begins at the top left corner and slopes down to the end of the x-axis.Line SRAS begins near the bottom left corner and slopes up to the top right corner.Line LRAS is perpendicular to the x-axis, and intersects lines AD and SRAS at point A.
Refer to Figure 12.2.In the graph above, if the economy is at point A, an appropriate fiscal policy by the federal government would be to
A)lower the discount rate of interest.
B)execute an open market sale of government securities.
C)increase government transfer payments.
D)increase marginal income tax rates.
E)decrease government spending.
Unlock Deck
Unlock for access to all 303 flashcards in this deck.
Unlock Deck
k this deck
75
A decrease in individual income taxes ________ disposable income, which ________ consumption spending.
A)increases; increases
B)increases; decreases
C)decreases; increases
D)decreases; decreases
A)increases; increases
B)increases; decreases
C)decreases; increases
D)decreases; decreases
Unlock Deck
Unlock for access to all 303 flashcards in this deck.
Unlock Deck
k this deck
76
Contractionary fiscal policy involves decreasing government purchases or increasing taxes.
Unlock Deck
Unlock for access to all 303 flashcards in this deck.
Unlock Deck
k this deck
77
What is expansionary fiscal policy? What is contractionary fiscal policy?
Unlock Deck
Unlock for access to all 303 flashcards in this deck.
Unlock Deck
k this deck
78
To combat a recession with discretionary fiscal policy, the federal government should
A)decrease government spending to balance the budget.
B)decrease taxes to increase consumer disposable income.
C)lower interest rates and increase investment by increasing the money supply.
D)raise taxes on interest and dividends, but not on personal income.
E)sell government assets to reduce the budget deficit.
Unlock Deck
Unlock for access to all 303 flashcards in this deck.
Unlock Deck
k this deck
79
Figure 12.4 Alt text for Figure 12.4: In figure 12.4, a graph comparing real GDP and price level.
Long description for Figure 12.4: The x-axis is labelled, real GDP (trillions of 2007 dollars)and the y-axis is labelled, price level (CPI).4 lines are shown; AD1, AD2, LRAS, and SRAS.Line AD1 begins at the top left corner and slopes down to the end of the x-axis.Line AD2 follows the same slope as line A1, but is plotted to the right.Line SRAS begins in the bottom left corner and slopes up to the top right corner.Line LRAS is perpendicular to the x-axis, and intersects lines AD1 and SRAS at point B.Lines AD2 and SRAS intersect at point A.
Refer to Figure 12.4.In the graph above, suppose the economy is initially at point A.The movement of the economy to point B as shown in the graph illustrates the effect of which of the following policy actions by the federal government?
A)an increase in transfer payments
B)an increase in interest rates
C)an increase in the marginal income tax rate
D)an open market purchase of Canadian government bonds
E)an increase in government spending
Alt text for Figure 12.4: In figure 12.4, a graph comparing real GDP and price level.Long description for Figure 12.4: The x-axis is labelled, real GDP (trillions of 2007 dollars)and the y-axis is labelled, price level (CPI).4 lines are shown; AD1, AD2, LRAS, and SRAS.Line AD1 begins at the top left corner and slopes down to the end of the x-axis.Line AD2 follows the same slope as line A1, but is plotted to the right.Line SRAS begins in the bottom left corner and slopes up to the top right corner.Line LRAS is perpendicular to the x-axis, and intersects lines AD1 and SRAS at point B.Lines AD2 and SRAS intersect at point A.
Refer to Figure 12.4.In the graph above, suppose the economy is initially at point A.The movement of the economy to point B as shown in the graph illustrates the effect of which of the following policy actions by the federal government?
A)an increase in transfer payments
B)an increase in interest rates
C)an increase in the marginal income tax rate
D)an open market purchase of Canadian government bonds
E)an increase in government spending
Unlock Deck
Unlock for access to all 303 flashcards in this deck.
Unlock Deck
k this deck
80
The problem causing most recessions is too little
A)money (currency plus chequing accounts).
B)spending.
C)unemployment.
D)taxes.
E)goods available for purchase.
A)money (currency plus chequing accounts).
B)spending.
C)unemployment.
D)taxes.
E)goods available for purchase.
Unlock Deck
Unlock for access to all 303 flashcards in this deck.
Unlock Deck
k this deck
Unlock Deck
Unlock for access to all 303 flashcards in this deck.


