Exam 12: Fiscal Policy
Exam 1: Economics: Foundations and Models148 Questions
Exam 2: Trade-Offs, Comparative Advantage, and the Market System314 Questions
Exam 3: Where Prices Come From: The Interaction of Supply and Demand314 Questions
Exam 4: GDP: Measuring Total Production and Income277 Questions
Exam 5: Unemployment and Inflation300 Questions
Exam 6: Economic Growth, The Financial System, and Business Cycles262 Questions
Exam 7: Long-Run Economic Growth: Sources and Policies280 Questions
Exam 8: Aggregate Expenditure and Output in the Short Run315 Questions
Exam 9: Aggregate Demand and Aggregate Supply Analysis246 Questions
Exam 10: Money, Banks, and the Bank of Canada285 Questions
Exam 11: Monetary Policy281 Questions
Exam 12: Fiscal Policy303 Questions
Exam 13: Inflation, Unemployment, and Bank of Canada Policy265 Questions
Exam 14: Macroeconomics in an Open Economy280 Questions
Exam 15: The International Financial System228 Questions
Select questions type
In the last 5 years, government spending on health care has
Free
(Multiple Choice)
4.7/5  (33)
(33)
Correct Answer: Verified
C
Figure 12.1 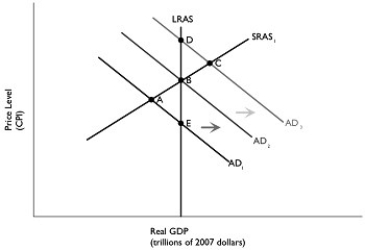 Alt text for Figure 12.1: In figure 12.1, a graph comparing real GDP and price level.
Long description for Figure 12.1: The x-axis is labelled, real GDP (trillions of 2007 dollars)and the y-axis is labelled, price level (CPI).5 lines are shown; AD1, AD2, AD3, LRAS, and SRAS1.Line AD1 begins in the top left corner and slopes down to the end of the x-axis.Line AD2 follows the same slope, but is plotted to the right.Similarly, line AD3 also has the same slope and is plotted to the right of AD2.Line SRAS1 begins close to the vertex and slopes up to the top right corner.Line LRAS is perpendicular to the x-axis, passing through points D, B, and E.Lines AD1 and SRAS1 intersect at point A.Lines AD2, LRAS, and SRAS1 intersect at point B.Lines AD3 and SRAS1 intersect at point C.Lines AD1 and LRAS intersect at point E.Lines AD3 and LRAS intersect at point D.The area between lines AD1 and AD2 is indicated by a right pointing arrow.The area between lines AD2 and AD3 is indicated by a right pointing arrow.
-Refer to Figure 12.1.An increase in taxes would be depicted as a movement from ________, using the static AD-AS model in the figure above.
Alt text for Figure 12.1: In figure 12.1, a graph comparing real GDP and price level.
Long description for Figure 12.1: The x-axis is labelled, real GDP (trillions of 2007 dollars)and the y-axis is labelled, price level (CPI).5 lines are shown; AD1, AD2, AD3, LRAS, and SRAS1.Line AD1 begins in the top left corner and slopes down to the end of the x-axis.Line AD2 follows the same slope, but is plotted to the right.Similarly, line AD3 also has the same slope and is plotted to the right of AD2.Line SRAS1 begins close to the vertex and slopes up to the top right corner.Line LRAS is perpendicular to the x-axis, passing through points D, B, and E.Lines AD1 and SRAS1 intersect at point A.Lines AD2, LRAS, and SRAS1 intersect at point B.Lines AD3 and SRAS1 intersect at point C.Lines AD1 and LRAS intersect at point E.Lines AD3 and LRAS intersect at point D.The area between lines AD1 and AD2 is indicated by a right pointing arrow.The area between lines AD2 and AD3 is indicated by a right pointing arrow.
-Refer to Figure 12.1.An increase in taxes would be depicted as a movement from ________, using the static AD-AS model in the figure above.
Free
(Multiple Choice)
4.9/5 (37)
Correct Answer:Verified
D
Suppose real GDP is $1.7 trillion and potential real GDP is $1.74 trillion.An increase in government purchases of $40 billion would cause real GDP to ________ potential real GDP (assuming a constant price level).
Free
(Multiple Choice)
4.8/5 (36)
Correct Answer:Verified
C
Figure 12.6 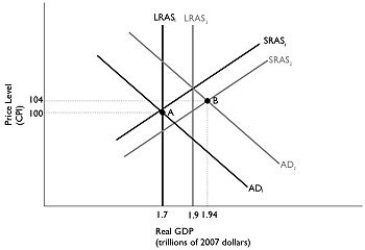 Alt text for Figure 12.6: In figure 12.6, a dynamic model of AD-AS.
Long description for Figure 12.6: The x-axis is labelled, real GDP (trillions of 2007 dollars).The y-axis is labelled, price level (CPI).6 lines are shown; SRAS1, SRAS2, AD1, AD2, LRAS1, and LRAS2.Line SRAS1 begins in the bottom left corner and slopes up to the top right corner.Line SRAS2 follows the same slope as line SRAS1, but is plotted to the right.Line AD1 begins in the top left corner and slopes down to the bottom center.Line AD2 follows the same slope as line AD1, but is plotted to the right.Line LRAS1 is perpendicular to the x-axis, and begins from the x-axis value 1.7.Line LRAS2 is perpendicular to the x-axis, and begins from the x-axis value 1.9.Line LRAS1 intersects lines AD1 and SRAS1 at point A (1.7, 100).Lines AD2 and SRAS2 intersect at point B (1.94, 104).Points A and B are connected to their respective coordinates on the x and y-axes with dotted lines.Line LRAS1 intersects the line SRAS2 below point A.Line LRAS2 intersects the lines SRAS1 and AD2 just above point B.
-Refer to Figure 12.6.In the dynamic model of AD-AS in the figure above, if the economy is at point A in year 1 and is expected to go to point B in year 2, the federal government would most likely pursue
Alt text for Figure 12.6: In figure 12.6, a dynamic model of AD-AS.
Long description for Figure 12.6: The x-axis is labelled, real GDP (trillions of 2007 dollars).The y-axis is labelled, price level (CPI).6 lines are shown; SRAS1, SRAS2, AD1, AD2, LRAS1, and LRAS2.Line SRAS1 begins in the bottom left corner and slopes up to the top right corner.Line SRAS2 follows the same slope as line SRAS1, but is plotted to the right.Line AD1 begins in the top left corner and slopes down to the bottom center.Line AD2 follows the same slope as line AD1, but is plotted to the right.Line LRAS1 is perpendicular to the x-axis, and begins from the x-axis value 1.7.Line LRAS2 is perpendicular to the x-axis, and begins from the x-axis value 1.9.Line LRAS1 intersects lines AD1 and SRAS1 at point A (1.7, 100).Lines AD2 and SRAS2 intersect at point B (1.94, 104).Points A and B are connected to their respective coordinates on the x and y-axes with dotted lines.Line LRAS1 intersects the line SRAS2 below point A.Line LRAS2 intersects the lines SRAS1 and AD2 just above point B.
-Refer to Figure 12.6.In the dynamic model of AD-AS in the figure above, if the economy is at point A in year 1 and is expected to go to point B in year 2, the federal government would most likely pursue
(Multiple Choice)
4.9/5 (35)
Suppose Political Party A proposes a tax cut on business income to stimulate the economy.Political Party B opposes the tax cut on business income asserting that it would only help businesses, not the average working man and woman.If you were hired as an economist for Political Party A, explain how the tax cut on business income would help the average working man and woman.
(Essay)
4.7/5 (41)
Figure 12.7 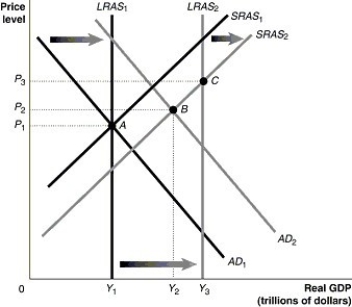 Alt text for Figure 12.7: In figure 12.7, a graph comparing real GDP and price level.
Long description for Figure 12.7: The x-axis is labelled, real GDP (trillions of dollars), with points Y1, Y2, and Y3 marked.The y-axis is labelled, price level, with points P1, P2, and P3 marked.6 lines are shown; SRAS1, SRAS2, AD1, AD2, LRAS1, and LRAS2.Line SRAS1 begins in the bottom left corner and slopes up to the top right corner.Line SRAS2 follows the same slope as line SRAS1, but is plotted to the right.The space between lines SRAS1 and SRAS2 is indicated by a right pointing arrow.Line AD1 begins at the top left corner and slopes down to the bottom center.Line AD2 follows the same slope as line AD1, but is plotted to the right.The area between lines AD1 and AD2 is indicated by a right pointing arrow.Line LRAS1 is perpendicular to the x-axis, and begins from the x-axis value Y1.Line LRAS2 is perpendicular to the x-axis, and begins from the x-axis value Y3.The are between lines LRAS1 and LRAS2 is indicated by a right pointing arrow.Line LRAS1 intersects lines AD1 and SRAS1 at point A (Y1, P1).Lines AD2 and SRAS2 intersect at point B (Y2, P2).Line LRAS2 intersects line SRAS2 at point C (Y3, P3).Points A, B, and C are connected to their respective coordinates on the x and y-axis with dotted lines.
-Refer to Figure 12.7.Given that the economy has moved from A to B in the graph above, which of the following would be the appropriate fiscal policy to achieve potential GDP?
Alt text for Figure 12.7: In figure 12.7, a graph comparing real GDP and price level.
Long description for Figure 12.7: The x-axis is labelled, real GDP (trillions of dollars), with points Y1, Y2, and Y3 marked.The y-axis is labelled, price level, with points P1, P2, and P3 marked.6 lines are shown; SRAS1, SRAS2, AD1, AD2, LRAS1, and LRAS2.Line SRAS1 begins in the bottom left corner and slopes up to the top right corner.Line SRAS2 follows the same slope as line SRAS1, but is plotted to the right.The space between lines SRAS1 and SRAS2 is indicated by a right pointing arrow.Line AD1 begins at the top left corner and slopes down to the bottom center.Line AD2 follows the same slope as line AD1, but is plotted to the right.The area between lines AD1 and AD2 is indicated by a right pointing arrow.Line LRAS1 is perpendicular to the x-axis, and begins from the x-axis value Y1.Line LRAS2 is perpendicular to the x-axis, and begins from the x-axis value Y3.The are between lines LRAS1 and LRAS2 is indicated by a right pointing arrow.Line LRAS1 intersects lines AD1 and SRAS1 at point A (Y1, P1).Lines AD2 and SRAS2 intersect at point B (Y2, P2).Line LRAS2 intersects line SRAS2 at point C (Y3, P3).Points A, B, and C are connected to their respective coordinates on the x and y-axis with dotted lines.
-Refer to Figure 12.7.Given that the economy has moved from A to B in the graph above, which of the following would be the appropriate fiscal policy to achieve potential GDP?
(Multiple Choice)
4.8/5 (39)
The increase in government spending on Employment Insurance payments to workers who lose their jobs during a recession and the decrease in government spending on unemployment insurance payments to workers during an expansion is an example of
(Multiple Choice)
4.8/5 (30)
The government purchases multiplier will be larger if the marginal income tax rate increases.
(True/False)
4.7/5 (45)
From an initial long-run equilibrium, if aggregate demand grows faster than long-run and short-run aggregate supply, then the federal government would most likely
(Multiple Choice)
4.7/5 (37)
Figure 12.6 Alt text for Figure 12.6: In figure 12.6, a dynamic model of AD-AS.
Long description for Figure 12.6: The x-axis is labelled, real GDP (trillions of 2007 dollars).The y-axis is labelled, price level (CPI).6 lines are shown; SRAS1, SRAS2, AD1, AD2, LRAS1, and LRAS2.Line SRAS1 begins in the bottom left corner and slopes up to the top right corner.Line SRAS2 follows the same slope as line SRAS1, but is plotted to the right.Line AD1 begins in the top left corner and slopes down to the bottom center.Line AD2 follows the same slope as line AD1, but is plotted to the right.Line LRAS1 is perpendicular to the x-axis, and begins from the x-axis value 1.7.Line LRAS2 is perpendicular to the x-axis, and begins from the x-axis value 1.9.Line LRAS1 intersects lines AD1 and SRAS1 at point A (1.7, 100).Lines AD2 and SRAS2 intersect at point B (1.94, 104).Points A and B are connected to their respective coordinates on the x and y-axes with dotted lines.Line LRAS1 intersects the line SRAS2 below point A.Line LRAS2 intersects the lines SRAS1 and AD2 just above point B.
-Refer to Figure 12.6.In the dynamic model of AD-AS in the figure above, if the economy is at point A in year 1 and is expected to go to point B in year 2, and no fiscal or monetary policy is pursued, then at point B,
(Multiple Choice)
4.8/5 (39)
The automatic budget surpluses and budget deficits that occur in the federal budget over the business cycle
(Multiple Choice)
4.9/5 (31)
Tax cuts on business income increase aggregate demand by increasing
(Multiple Choice)
4.8/5 (39)
A recession tends to cause the federal budget deficit to ________ because tax revenues ________ and government spending on transfer payments ________.
(Multiple Choice)
4.8/5 (45)
Figure 12.4 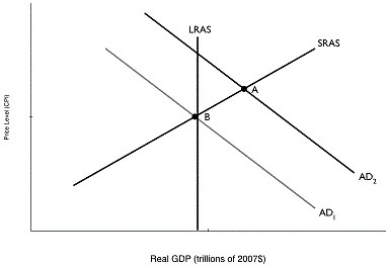 Alt text for Figure 12.4: In figure 12.4, a graph comparing real GDP and price level.
Long description for Figure 12.4: The x-axis is labelled, real GDP (trillions of 2007 dollars)and the y-axis is labelled, price level (CPI).4 lines are shown; AD1, AD2, LRAS, and SRAS.Line AD1 begins at the top left corner and slopes down to the end of the x-axis.Line AD2 follows the same slope as line A1, but is plotted to the right.Line SRAS begins in the bottom left corner and slopes up to the top right corner.Line LRAS is perpendicular to the x-axis, and intersects lines AD1 and SRAS at point B.Lines AD2 and SRAS intersect at point A.
-Refer to Figure 12.4.In the graph above, suppose the economy is initially at point A.The movement of the economy to point B as shown in the graph illustrates the effect of which of the following policy actions by the federal government?
Alt text for Figure 12.4: In figure 12.4, a graph comparing real GDP and price level.
Long description for Figure 12.4: The x-axis is labelled, real GDP (trillions of 2007 dollars)and the y-axis is labelled, price level (CPI).4 lines are shown; AD1, AD2, LRAS, and SRAS.Line AD1 begins at the top left corner and slopes down to the end of the x-axis.Line AD2 follows the same slope as line A1, but is plotted to the right.Line SRAS begins in the bottom left corner and slopes up to the top right corner.Line LRAS is perpendicular to the x-axis, and intersects lines AD1 and SRAS at point B.Lines AD2 and SRAS intersect at point A.
-Refer to Figure 12.4.In the graph above, suppose the economy is initially at point A.The movement of the economy to point B as shown in the graph illustrates the effect of which of the following policy actions by the federal government?
(Multiple Choice)
4.9/5 (31)
Which of the following would be classified as fiscal policy?
(Multiple Choice)
4.9/5 (39)
In a closed economy with fixed or autonomous (non-income dependent)taxes, the balanced budget government purchases multiplier equals one.
(True/False)
5.0/5 (31)
Figure 12.11 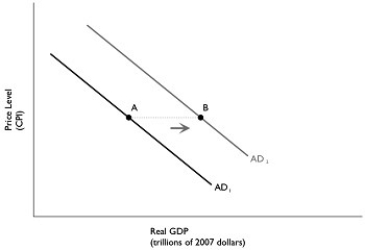 Alt text for Figure 12.11: In figure 12.11, a graph depicting the total change in aggregate demand.
Long description for Figure 12.11: The x-axis is labelled, real GDP (trillions of 2007 dollars), and the y-axis is labelled, price level (CPI).2 lines are shown; AD1 and AD2.Line AD1 begins at the top left corner and slopes down to the bottom center.Line AD2 follows the same slope as line AD1, but is plotted to the right.Point A is plotted half way along line AD1.Point B is plotted approximately 3 quarters of the way along line AD2.Points A and B are connected with a dotted line, and the area between them is indicated by a right pointing arrow.
-Refer to Figure 12.11.In the graph above, the shift from AD1 to AD2 represents the total change in aggregate demand.If government purchases increased by $50 billion, then the distance from point A to point B ________ $50 billion.
Alt text for Figure 12.11: In figure 12.11, a graph depicting the total change in aggregate demand.
Long description for Figure 12.11: The x-axis is labelled, real GDP (trillions of 2007 dollars), and the y-axis is labelled, price level (CPI).2 lines are shown; AD1 and AD2.Line AD1 begins at the top left corner and slopes down to the bottom center.Line AD2 follows the same slope as line AD1, but is plotted to the right.Point A is plotted half way along line AD1.Point B is plotted approximately 3 quarters of the way along line AD2.Points A and B are connected with a dotted line, and the area between them is indicated by a right pointing arrow.
-Refer to Figure 12.11.In the graph above, the shift from AD1 to AD2 represents the total change in aggregate demand.If government purchases increased by $50 billion, then the distance from point A to point B ________ $50 billion.
(Multiple Choice)
4.7/5 (29)
Decreasing government spending ________ the price level and ________ equilibrium real GDP.
(Multiple Choice)
4.9/5 (39)
Filters
- Essay(0)
- Multiple Choice(0)
- Short Answer(0)
- True False(0)
- Matching(0)