Deck 9: Forecasting
Full screen (f)
Question
Question
Question
Question
Question
Question
Question
Question
Question
Question
Question
Question
Question
Question
Question
Question
Question
Question
Question
Question
A firm's demand data from the last two quarter is displayed in the table.Use a three period moving average to forecast demand for July. 
A) 206
B) 217
C) 223
D) 226
A) 206
B) 217
C) 223
D) 226
Question
Question
Question
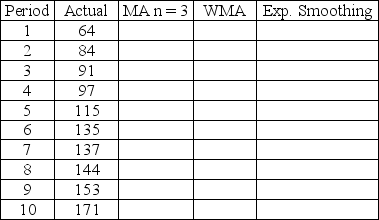
Develop forecasts for periods 7 through 10 for the demand data in the table using a three period moving average,a weighted moving average using 0.6,0.3,and 0.1,and exponential smoothing with alpha = 0.7.Use a 6th period forecast of 135 as the starting point for the exponential smoothing technique.
Question
A firm's demand data from the last two quarter is displayed in the table.Use a three period weighted moving average with Wt = 0.7,Wt-1 = 0.2,and Wt-2 = 0.1 to forecast demand for July. 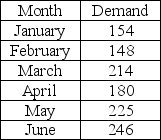
A) 235.2
B) 195.6
C) 158.8
D) 180.4
A) 235.2
B) 195.6
C) 158.8
D) 180.4
Question
A drive-in restaurant has experienced the following customer loads on the past 8 Friday nights.If their forecast for period 7 was 59 customers,then what is their forecast for period number 8 using a smoothing constant of 0.7? 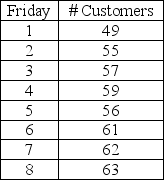
A) 61.10
B) 62.43
C) 59.90
D) 60.83
A) 61.10
B) 62.43
C) 59.90
D) 60.83
Question
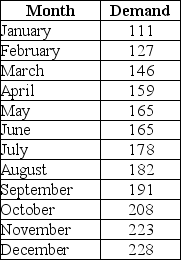
A counseling service records the number of calls to their hotline for the last year.Plot the data and determine which forecasting technique would be best among a moving average,weighted moving average,exponential smoothing,and trend line.
Question
Question
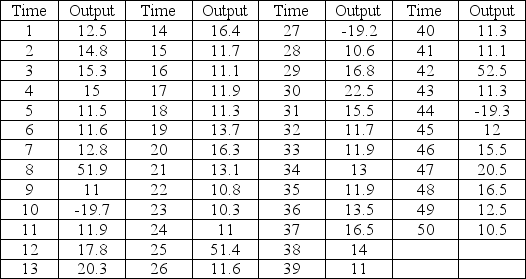
Consider the data that generate this plot covering time months 1 to 50.What characteristic is most prominent in the pattern? 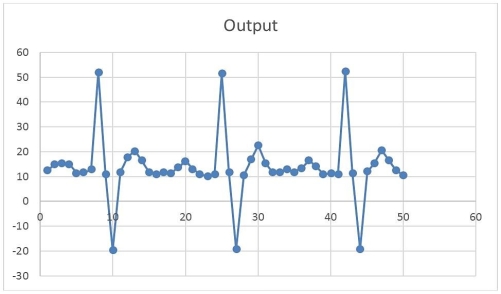
A) trend
B) seasonality
C) randomness
D) none
A) trend
B) seasonality
C) randomness
D) none
Question
A counseling service records the number of calls to their hotline for the last year.What is the forecast for August if a regression equation is used to model this data? 
A) 188.3
B) 179.9
C) 180.6
D) 175.7
A) 188.3
B) 179.9
C) 180.6
D) 175.7
Question
A company keeps track of unit sales and notes a strong trend during the past eight periods.They use an adjusted exponential smoothing model with an alpha equal to 0.7 and a beta equal to 0.6.Using the demand data and previous forecasts shown in the table,develop a forecast for period 4. 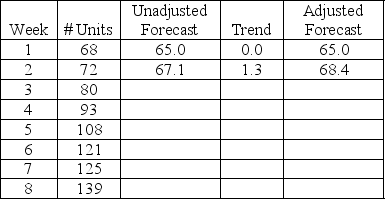
A) 82.2
B) 84.9
C) 87.5
D) 91.6
A) 82.2
B) 84.9
C) 87.5
D) 91.6
Question
A counseling service records the number of calls to their hotline for the last year.What is the forecast for October if a weighted moving average with weights of 0.5,0.3,and 0.2 is used to model this data? 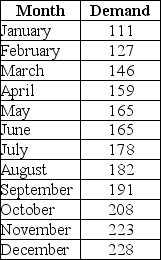
A) 177.4
B) 185.7
C) 197.7
D) 190.3
A) 177.4
B) 185.7
C) 197.7
D) 190.3
Question
Heidi favors using a two period moving average but Tim is "an exponential-smoothing man." Tim's demand forecast for May was identical to Heidi's.What value of alpha would Tim need to use in order for his June forecast to be identical to Heidi's if each sticks with their preferred technique? 
A) )085
B) )196
C) )237
D) )348
A) )085
B) )196
C) )237
D) )348
Question
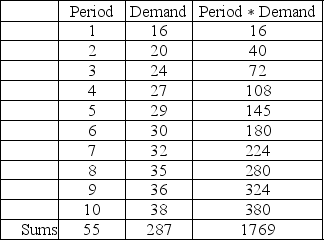
Using the data shown in the table,develop a regression line that can be used to predict the demand for time period number 20.What is the prediction equation and what is your forecast for period 20?
Question
A counseling service records the number of calls to their hotline for the last year.What is the forecast for August if the forecast for June was 164 and the service uses exponential smoothing with an alpha of 0.8? 
A) 164.80
B) 188.93
C) 180.67
D) 175.36
A) 164.80
B) 188.93
C) 180.67
D) 175.36
Question
The Pancake House did a brisk business on the weekend and the maître d' was always on the lookout for ways to improve the customer experience.He carefully tracked the number of customers that graced their establishment over the last four weekends.He was hopeful that he could forecast the number of customers that would come for the world's finest pancakes the next weekend.
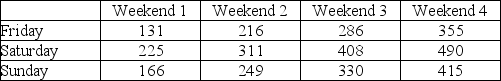 Using the data in the table,first plot the data and comment on the appearance of the demand pattern.Then develop a forecast for weekend #5 that fits the data.
Using the data in the table,first plot the data and comment on the appearance of the demand pattern.Then develop a forecast for weekend #5 that fits the data. Question
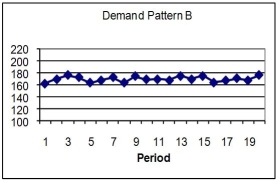
Examine these two graphs and based on the demand pattern and axis scaling,recommend a forecasting technique (and the required parameters)that would work best for each one.Justify your recommendations. 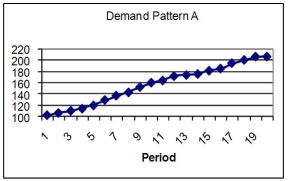
Question
A counseling service records the number of calls to their hotline for the last year.What is the forecast for March if an adjusted exponential smoothing model is used with α=0.8 and β=0.7? The unadjusted forecast for January is 123.5. 
A) 135.44
B) 138.53
C) 132.76
D) 144.34
A) 135.44
B) 138.53
C) 132.76
D) 144.34
Question
Question
Question
A counseling service records the number of calls to their hotline for the last year.What is the forecast for July if the service uses a simple moving average of three periods? 
A) 169
B) 163
C) 157
D) 178
A) 169
B) 163
C) 157
D) 178
Question
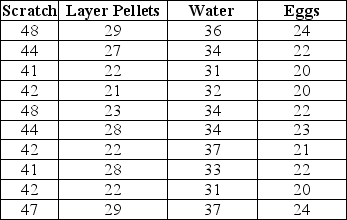
A poultry farmer that dabbles in statistics is interested in exploring the relationship between two types of feed,layer pellets and scratch,water,and the output of his laying hens.For ten days he records the number of ounces of layer pellets and scratch the hens consume and the number of fluid ounces of water and tracks the number of eggs that are produced.After running a multiple regression model,he obtains the following report.What is the best interpretation of these statistics? Regression Statistics
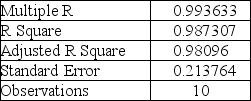
A) The probability that the number of eggs is correctly predicted by the amount of scratch, layer pellets, and water consumed is 99.36%.
B) The prediction of the amount of eggs is 98.7% accurate based on the amount of scratch, layer pellets, and water consumed.
C) 98.7% of the variability in egg production is explained by the amount of water, scratch, and layer pellets consumed.
D) The prediction of the amount of eggs is 99.36% accurate based on the amount of scratch, layer pellets, and water consumed.
Question
Question
A well-educated lumberjack decides to use linear regression to predict the demand for firewood based on the ambient temperature.He has collected data on firewood sales and temperature for the last several days and has performed some preliminary calculations as shown in the table.What is his regression equation based on the data? 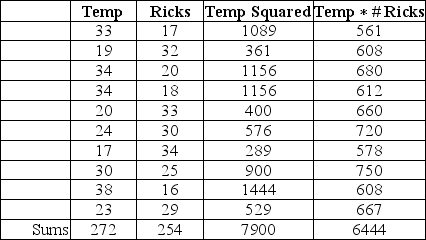
A) Ricks = 50.6 - 0.93 × Temp
B) Temp = 53.3 - 1.0 × Ricks
C) Ricks = 0.93 - 50.6 × Temp
D) Temp = 1.0 - 53.3 × Ricks
A) Ricks = 50.6 - 0.93 × Temp
B) Temp = 53.3 - 1.0 × Ricks
C) Ricks = 0.93 - 50.6 × Temp
D) Temp = 1.0 - 53.3 × Ricks
Question
Using the data in the table,first plot the data and comment on the appearance of the demand pattern.Then develop a forecast for periods 51-70 that fits the data.
Question
Multiple regression was used to forecast success in college (GPA)based upon SAT score,high school GPA,and hours spent on-line.Use the regression output shown and comment on the overall fit of the model,the usefulness of each independent variable,and the value to an admissions department of using the model to make admission decisions.What is the model's forecast for an applicant having a high school GPA of 2.5 and an SAT score of 1000 that spends 20 hours a week on-line? What other variables do you feel would make good indicators of college GPA? 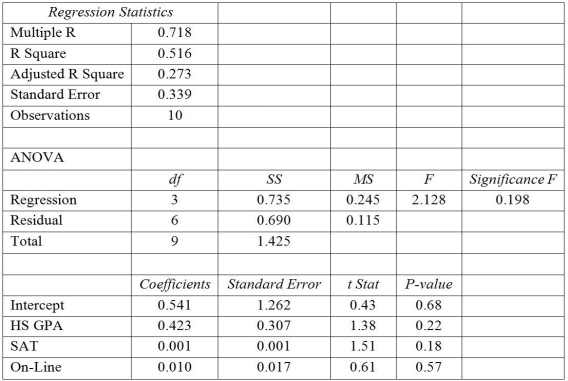
Question
Question
Question
Question
A poultry farmer that dabbles in statistics is interested in exploring the relationship between two types of feed,layer pellets and scratch,water,and the output of his laying hens.For ten days he records the number of ounces of layer pellets and scratch the hens consume and the number of fluid ounces of water and tracks the number of eggs that are produced.After running a multiple regression model,he obtains the following report.What is the best interpretation of these statistics? 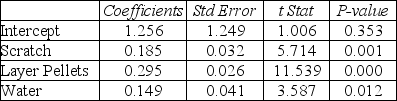
A) For every egg produced, about 0.185 ounces of scratch must be consumed.
B) The standard error for the model intercept is as large as the coefficient, thus the intercept is the most important predictor of egg production.
C) Layer pellets are not good predictors of egg production because the p-value is 0.
D) For every ounce of water consumed, the chickens produce 0.15 eggs, holding all other independent variables constant.
Question
A poultry farmer that dabbles in statistics is interested in exploring the relationship between two types of feed,layer pellets and scratch,water,and the output of his laying hens.For ten days he records the number of ounces of layer pellets and scratch the hens consume and the number of fluid ounces of water and tracks the number of eggs that are produced.What is his regression equation based on the data? 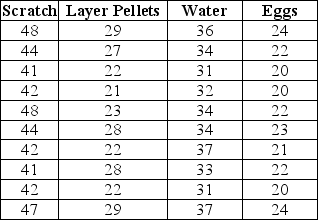
A) Eggs = 6.56 + .38Scratch + .17Pellets + .21Water
B) Eggs = 1.25 + .18Scratch + .29Pellets + .15Water
C) Eggs = 0.93 - .88Scratch + .37Pellets + .41Water
D) Eggs = 4.22 + .37Scratch + .67Pellets + .58Water
A) Eggs = 6.56 + .38Scratch + .17Pellets + .21Water
B) Eggs = 1.25 + .18Scratch + .29Pellets + .15Water
C) Eggs = 0.93 - .88Scratch + .37Pellets + .41Water
D) Eggs = 4.22 + .37Scratch + .67Pellets + .58Water
Question
Question
A poultry farmer that dabbles in statistics is interested in exploring the relationship between two types of feed,layer pellets and scratch,water,and the output of his laying hens.For ten days he records the number of ounces of layer pellets and scratch the hens consume and the number of fluid ounces of water and tracks the number of eggs that are produced.What is his regression equation based on the data?
 He develops one equation based on three predictors,the scratch,pellets,and water,and another equation based only on the layer pellet consumption.The output for the two models are shown side by side.Comment on the two models and which one should be used.
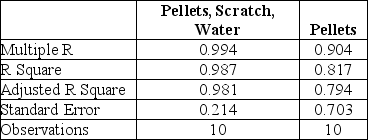
He develops one equation based on three predictors,the scratch,pellets,and water,and another equation based only on the layer pellet consumption.The output for the two models are shown side by side.Comment on the two models and which one should be used. Question
Question
Question
A poultry farmer that dabbles in statistics is interested in exploring the relationship between layer pellets and the output of his laying hens.For ten days he records the number of ounces of layer pellets and the number of eggs that are produced.What is his regression equation based on the data? 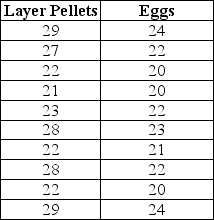
A) Eggs = 11.3 + 0.42Pellets
B) Eggs = 1.25 + 0.29Pellets
C) Eggs = 10.9 + 0.23Pellets
D) Eggs = 4.22 + 0.67Pellets
A) Eggs = 11.3 + 0.42Pellets
B) Eggs = 1.25 + 0.29Pellets
C) Eggs = 10.9 + 0.23Pellets
D) Eggs = 4.22 + 0.67Pellets
Question
Question
A poultry farmer that dabbles in statistics is interested in exploring the relationship between two types of feed,layer pellets and scratch,water,and the output of his laying hens.For ten days he records the number of ounces of layer pellets and scratch the hens consume and the number of fluid ounces of water and tracks the number of eggs that are produced.What is his regression equation based on the data?

Question
Question
Question
Question
Question
Question
Question
Question
A counseling service records the number of calls to their hotline for the last year.Based on MAD,which of these models does the best job of forecasting? 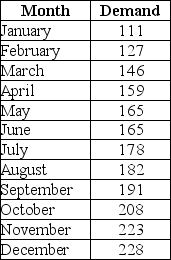
A) A simple moving average of three periods
B) A simple moving average of five periods
C) A weighted moving average of .7, .2, .1
D) A weighted moving average of .5, .2, .2, .1
A) A simple moving average of three periods
B) A simple moving average of five periods
C) A weighted moving average of .7, .2, .1
D) A weighted moving average of .5, .2, .2, .1
Question
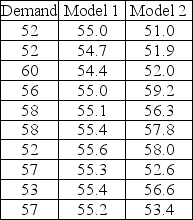
A forecaster is assessing two different models for demand.The output from each model and the actual demand data appear in the table.Use MAD and a tracking signal to compare the two models.Which model does a better job of forecasting?
Question
Question
Question

Unlock Deck
Sign up to unlock the cards in this deck!
Unlock Deck
Unlock Deck
1/69
Play
Full screen (f)
Deck 9: Forecasting
1
The greater the randomness in the model,the greater the number of periods should be used in a moving average forecast.
True
2
The Delphi method,panel consensus forecasting,and market surveys are all qualitative forecasting methods,but only market surveys do NOT use experts.
True
3
Exponential smoothing with an alpha of one will yield identical results to a last period forecast.
True
4
The independent variable is the quantity the forecaster is interested in estimating with a linear regression model.
Unlock Deck
Unlock for access to all 69 flashcards in this deck.
Unlock Deck
k this deck
5
When there is a significant upward or downward trend in the data,the two best forecasting models are adjusted exponential smoothing and linear regression.
Unlock Deck
Unlock for access to all 69 flashcards in this deck.
Unlock Deck
k this deck
6
The slope of the regression equation is positive if the r-squared value is greater than 0.0.
Unlock Deck
Unlock for access to all 69 flashcards in this deck.
Unlock Deck
k this deck
7
A seasonal index less than 1.0 means that the model is overforecasted.
Unlock Deck
Unlock for access to all 69 flashcards in this deck.
Unlock Deck
k this deck
8
Over the long run,fluctuations in demand due to seasonality are greater than those due to randomness.
Unlock Deck
Unlock for access to all 69 flashcards in this deck.
Unlock Deck
k this deck
9
A long-term movement up or down in a time series is called:
A) seasonality.
B) trend.
C) randomness.
D) cycle.
A) seasonality.
B) trend.
C) randomness.
D) cycle.
Unlock Deck
Unlock for access to all 69 flashcards in this deck.
Unlock Deck
k this deck
10
Describe the mechanics of three qualitative forecasting techniques and compare their strengths and weaknesses.
Unlock Deck
Unlock for access to all 69 flashcards in this deck.
Unlock Deck
k this deck
11
A seasonal pattern in time series data is evident when the level of the variable of interest moves erratically up or down from one period to the next.
Unlock Deck
Unlock for access to all 69 flashcards in this deck.
Unlock Deck
k this deck
12
Fed up with her working conditions at the call center,Lisa decides to invest in a state-of-the-art sewing machine and produce limited quantities of her own clothing designs.After a few months of operation,she decides to apply some of the forecasting techniques she mastered in school.Which of these statements about her forecasts is correct?
A) Her forecasts will probably be 100% accurate.
B) Her demand forecasts for a year from now will probably be more accurate than her demand forecasts for three months from now.
C) Her demand forecasts for each style of skirt will be more accurate than her demand forecasts for all skirts.
D) The best way for her to determine the amount of fabric she needs is to forecast it based on her customer orders for each type of skirt.
Unlock Deck
Unlock for access to all 69 flashcards in this deck.
Unlock Deck
k this deck
13
A qualitative forecasting technique in which individuals familiar with specific market segments estimate the demand within these sectors that are then summed to get an overall forecast is called a:
A) market survey.
B) life cycle analogy.
C) panel consensus forecasting.
D) build-up forecast.
A) market survey.
B) life cycle analogy.
C) panel consensus forecasting.
D) build-up forecast.
Unlock Deck
Unlock for access to all 69 flashcards in this deck.
Unlock Deck
k this deck
14
A qualitative forecasting technique well-suited for demand forecasts of a new product or service is the:
A) Delphi method.
B) build-up forecast.
C) life cycle analogy method.
D) market survey.
A) Delphi method.
B) build-up forecast.
C) life cycle analogy method.
D) market survey.
Unlock Deck
Unlock for access to all 69 flashcards in this deck.
Unlock Deck
k this deck
15
What are the laws of forecasting and what are their implications for operations and supply chain managers?
Unlock Deck
Unlock for access to all 69 flashcards in this deck.
Unlock Deck
k this deck
16
Qualitative forecasts are used when there is plenty of relevant data.
Unlock Deck
Unlock for access to all 69 flashcards in this deck.
Unlock Deck
k this deck
17
A video game publishing company needs to predict the total sales in the European market for the next year.This is an example of a(n):
A) firm-level demand forecast.
B) overall market demand forecast.
C) supply forecast.
D) price forecast.
A) firm-level demand forecast.
B) overall market demand forecast.
C) supply forecast.
D) price forecast.
Unlock Deck
Unlock for access to all 69 flashcards in this deck.
Unlock Deck
k this deck
18
The panel consensus forecasting approach requires that the forecasting team discuss their forecast as a team but the ________ requires that each member of the team develop a separate forecast initially.
Unlock Deck
Unlock for access to all 69 flashcards in this deck.
Unlock Deck
k this deck
19
Forecasts are almost always wrong.
Unlock Deck
Unlock for access to all 69 flashcards in this deck.
Unlock Deck
k this deck
20
A firm's demand data from the last two quarter is displayed in the table.Use a three period moving average to forecast demand for July.
A) 206
B) 217
C) 223
D) 226
A) 206
B) 217
C) 223
D) 226
Unlock Deck
Unlock for access to all 69 flashcards in this deck.
Unlock Deck
k this deck
21
________ is unpredictable movement from one time period to the next.
Unlock Deck
Unlock for access to all 69 flashcards in this deck.
Unlock Deck
k this deck
22
Two smoothing models that yield identical forecasts are exponential smoothing with an alpha equal to ________ and a moving average with n equal to ________.
Unlock Deck
Unlock for access to all 69 flashcards in this deck.
Unlock Deck
k this deck
23
Develop forecasts for periods 7 through 10 for the demand data in the table using a three period moving average,a weighted moving average using 0.6,0.3,and 0.1,and exponential smoothing with alpha = 0.7.Use a 6th period forecast of 135 as the starting point for the exponential smoothing technique.
Unlock Deck
Unlock for access to all 69 flashcards in this deck.
Unlock Deck
k this deck
24
A firm's demand data from the last two quarter is displayed in the table.Use a three period weighted moving average with Wt = 0.7,Wt-1 = 0.2,and Wt-2 = 0.1 to forecast demand for July.
A) 235.2
B) 195.6
C) 158.8
D) 180.4
A) 235.2
B) 195.6
C) 158.8
D) 180.4
Unlock Deck
Unlock for access to all 69 flashcards in this deck.
Unlock Deck
k this deck
25
A drive-in restaurant has experienced the following customer loads on the past 8 Friday nights.If their forecast for period 7 was 59 customers,then what is their forecast for period number 8 using a smoothing constant of 0.7?
A) 61.10
B) 62.43
C) 59.90
D) 60.83
A) 61.10
B) 62.43
C) 59.90
D) 60.83
Unlock Deck
Unlock for access to all 69 flashcards in this deck.
Unlock Deck
k this deck
26
A counseling service records the number of calls to their hotline for the last year.Plot the data and determine which forecasting technique would be best among a moving average,weighted moving average,exponential smoothing,and trend line.
Unlock Deck
Unlock for access to all 69 flashcards in this deck.
Unlock Deck
k this deck
27
Dividing actual demand by the model's forecast yields an index that can be used to adjust for ________ in the data.
Unlock Deck
Unlock for access to all 69 flashcards in this deck.
Unlock Deck
k this deck
28
Consider the data that generate this plot covering time months 1 to 50.What characteristic is most prominent in the pattern?
A) trend
B) seasonality
C) randomness
D) none
A) trend
B) seasonality
C) randomness
D) none
Unlock Deck
Unlock for access to all 69 flashcards in this deck.
Unlock Deck
k this deck
29
A counseling service records the number of calls to their hotline for the last year.What is the forecast for August if a regression equation is used to model this data?
A) 188.3
B) 179.9
C) 180.6
D) 175.7
A) 188.3
B) 179.9
C) 180.6
D) 175.7
Unlock Deck
Unlock for access to all 69 flashcards in this deck.
Unlock Deck
k this deck
30
A company keeps track of unit sales and notes a strong trend during the past eight periods.They use an adjusted exponential smoothing model with an alpha equal to 0.7 and a beta equal to 0.6.Using the demand data and previous forecasts shown in the table,develop a forecast for period 4.
A) 82.2
B) 84.9
C) 87.5
D) 91.6
A) 82.2
B) 84.9
C) 87.5
D) 91.6
Unlock Deck
Unlock for access to all 69 flashcards in this deck.
Unlock Deck
k this deck
31
A counseling service records the number of calls to their hotline for the last year.What is the forecast for October if a weighted moving average with weights of 0.5,0.3,and 0.2 is used to model this data?
A) 177.4
B) 185.7
C) 197.7
D) 190.3
A) 177.4
B) 185.7
C) 197.7
D) 190.3
Unlock Deck
Unlock for access to all 69 flashcards in this deck.
Unlock Deck
k this deck
32
Heidi favors using a two period moving average but Tim is "an exponential-smoothing man." Tim's demand forecast for May was identical to Heidi's.What value of alpha would Tim need to use in order for his June forecast to be identical to Heidi's if each sticks with their preferred technique?
A) )085
B) )196
C) )237
D) )348
A) )085
B) )196
C) )237
D) )348
Unlock Deck
Unlock for access to all 69 flashcards in this deck.
Unlock Deck
k this deck
33
Using the data shown in the table,develop a regression line that can be used to predict the demand for time period number 20.What is the prediction equation and what is your forecast for period 20?
Unlock Deck
Unlock for access to all 69 flashcards in this deck.
Unlock Deck
k this deck
34
A counseling service records the number of calls to their hotline for the last year.What is the forecast for August if the forecast for June was 164 and the service uses exponential smoothing with an alpha of 0.8?
A) 164.80
B) 188.93
C) 180.67
D) 175.36
A) 164.80
B) 188.93
C) 180.67
D) 175.36
Unlock Deck
Unlock for access to all 69 flashcards in this deck.
Unlock Deck
k this deck
35
The Pancake House did a brisk business on the weekend and the maître d' was always on the lookout for ways to improve the customer experience.He carefully tracked the number of customers that graced their establishment over the last four weekends.He was hopeful that he could forecast the number of customers that would come for the world's finest pancakes the next weekend.
Using the data in the table,first plot the data and comment on the appearance of the demand pattern.Then develop a forecast for weekend #5 that fits the data.
Using the data in the table,first plot the data and comment on the appearance of the demand pattern.Then develop a forecast for weekend #5 that fits the data. Unlock Deck
Unlock for access to all 69 flashcards in this deck.
Unlock Deck
k this deck
36
Examine these two graphs and based on the demand pattern and axis scaling,recommend a forecasting technique (and the required parameters)that would work best for each one.Justify your recommendations.
Unlock Deck
Unlock for access to all 69 flashcards in this deck.
Unlock Deck
k this deck
37
A counseling service records the number of calls to their hotline for the last year.What is the forecast for March if an adjusted exponential smoothing model is used with α=0.8 and β=0.7? The unadjusted forecast for January is 123.5.
A) 135.44
B) 138.53
C) 132.76
D) 144.34
A) 135.44
B) 138.53
C) 132.76
D) 144.34
Unlock Deck
Unlock for access to all 69 flashcards in this deck.
Unlock Deck
k this deck
38
The greater the randomness in the data,the ________ the value of the alpha should be in an exponential smoothing forecast.
Unlock Deck
Unlock for access to all 69 flashcards in this deck.
Unlock Deck
k this deck
39
Two time series techniques that are appropriate when the data display a strong upward or downward trend are ________ and ________.
Unlock Deck
Unlock for access to all 69 flashcards in this deck.
Unlock Deck
k this deck
40
A counseling service records the number of calls to their hotline for the last year.What is the forecast for July if the service uses a simple moving average of three periods?
A) 169
B) 163
C) 157
D) 178
A) 169
B) 163
C) 157
D) 178
Unlock Deck
Unlock for access to all 69 flashcards in this deck.
Unlock Deck
k this deck
41
A poultry farmer that dabbles in statistics is interested in exploring the relationship between two types of feed,layer pellets and scratch,water,and the output of his laying hens.For ten days he records the number of ounces of layer pellets and scratch the hens consume and the number of fluid ounces of water and tracks the number of eggs that are produced.After running a multiple regression model,he obtains the following report.What is the best interpretation of these statistics? Regression Statistics
A) The probability that the number of eggs is correctly predicted by the amount of scratch, layer pellets, and water consumed is 99.36%.
B) The prediction of the amount of eggs is 98.7% accurate based on the amount of scratch, layer pellets, and water consumed.
C) 98.7% of the variability in egg production is explained by the amount of water, scratch, and layer pellets consumed.
D) The prediction of the amount of eggs is 99.36% accurate based on the amount of scratch, layer pellets, and water consumed.
Unlock Deck
Unlock for access to all 69 flashcards in this deck.
Unlock Deck
k this deck
42
McMahon and Tate advertising company is interested in an appropriate mix of print,radio,and television ads for their new client.Darrin Stevens performs a multiple regression on the effects of dollars spent on each type of media on dollars of sales of product.Darrin uses data from the most recent advertising campaigns and develops the following equation: y = 254,215 + 6.79 × Print - 1.4 × Radio + 16.87 × Television
The r-squared statistic is 0.77.Which of the following statements is best?
A) At a minimum, the client will sell $254,215 worth of product after the new advertising campaign.
B) At a maximum, the client will sell $254,215 worth of product after the new advertising campaign.
C) This equation will be of no use in predicting the amount of sales based on advertising in these media.
D) The client should spend more money on television advertising than on radio advertising.
Unlock Deck
Unlock for access to all 69 flashcards in this deck.
Unlock Deck
k this deck
43
A well-educated lumberjack decides to use linear regression to predict the demand for firewood based on the ambient temperature.He has collected data on firewood sales and temperature for the last several days and has performed some preliminary calculations as shown in the table.What is his regression equation based on the data?
A) Ricks = 50.6 - 0.93 × Temp
B) Temp = 53.3 - 1.0 × Ricks
C) Ricks = 0.93 - 50.6 × Temp
D) Temp = 1.0 - 53.3 × Ricks
A) Ricks = 50.6 - 0.93 × Temp
B) Temp = 53.3 - 1.0 × Ricks
C) Ricks = 0.93 - 50.6 × Temp
D) Temp = 1.0 - 53.3 × Ricks
Unlock Deck
Unlock for access to all 69 flashcards in this deck.
Unlock Deck
k this deck
44
Using the data in the table,first plot the data and comment on the appearance of the demand pattern.Then develop a forecast for periods 51-70 that fits the data.
Unlock Deck
Unlock for access to all 69 flashcards in this deck.
Unlock Deck
k this deck
45
Multiple regression was used to forecast success in college (GPA)based upon SAT score,high school GPA,and hours spent on-line.Use the regression output shown and comment on the overall fit of the model,the usefulness of each independent variable,and the value to an admissions department of using the model to make admission decisions.What is the model's forecast for an applicant having a high school GPA of 2.5 and an SAT score of 1000 that spends 20 hours a week on-line? What other variables do you feel would make good indicators of college GPA?
Unlock Deck
Unlock for access to all 69 flashcards in this deck.
Unlock Deck
k this deck
46
Heidi runs a multiple regression for the output of cheese curds by using the daily temperature and the consumption of sweet clover.The intercept term is 23,the slope coefficient for the daily temperature is 1.5 and the slope coefficient for the consumption of sweet clover is 0.Which of these conclusions is most appropriate?
A) Heidi should collect more data.
B) The most important term in Heidi's model is the intercept.
C) As the daily temperature rises, the intercept term probably decreases.
D) Heidi should drop the sweet clover term from her model.
A) Heidi should collect more data.
B) The most important term in Heidi's model is the intercept.
C) As the daily temperature rises, the intercept term probably decreases.
D) Heidi should drop the sweet clover term from her model.
Unlock Deck
Unlock for access to all 69 flashcards in this deck.
Unlock Deck
k this deck
47
Which of these quantitative techniques is a causal model?
A) linear regression
B) last period
C) exponential smoothing
D) weighted moving average
A) linear regression
B) last period
C) exponential smoothing
D) weighted moving average
Unlock Deck
Unlock for access to all 69 flashcards in this deck.
Unlock Deck
k this deck
48
The forecast data matches the actual data perfectly if the mean absolute deviation is 0.0.
Unlock Deck
Unlock for access to all 69 flashcards in this deck.
Unlock Deck
k this deck
49
A poultry farmer that dabbles in statistics is interested in exploring the relationship between two types of feed,layer pellets and scratch,water,and the output of his laying hens.For ten days he records the number of ounces of layer pellets and scratch the hens consume and the number of fluid ounces of water and tracks the number of eggs that are produced.After running a multiple regression model,he obtains the following report.What is the best interpretation of these statistics?
A) For every egg produced, about 0.185 ounces of scratch must be consumed.
B) The standard error for the model intercept is as large as the coefficient, thus the intercept is the most important predictor of egg production.
C) Layer pellets are not good predictors of egg production because the p-value is 0.
D) For every ounce of water consumed, the chickens produce 0.15 eggs, holding all other independent variables constant.
Unlock Deck
Unlock for access to all 69 flashcards in this deck.
Unlock Deck
k this deck
50
A poultry farmer that dabbles in statistics is interested in exploring the relationship between two types of feed,layer pellets and scratch,water,and the output of his laying hens.For ten days he records the number of ounces of layer pellets and scratch the hens consume and the number of fluid ounces of water and tracks the number of eggs that are produced.What is his regression equation based on the data?
A) Eggs = 6.56 + .38Scratch + .17Pellets + .21Water
B) Eggs = 1.25 + .18Scratch + .29Pellets + .15Water
C) Eggs = 0.93 - .88Scratch + .37Pellets + .41Water
D) Eggs = 4.22 + .37Scratch + .67Pellets + .58Water
A) Eggs = 6.56 + .38Scratch + .17Pellets + .21Water
B) Eggs = 1.25 + .18Scratch + .29Pellets + .15Water
C) Eggs = 0.93 - .88Scratch + .37Pellets + .41Water
D) Eggs = 4.22 + .37Scratch + .67Pellets + .58Water
Unlock Deck
Unlock for access to all 69 flashcards in this deck.
Unlock Deck
k this deck
51
Multiple regression is used when the forecaster believes that more than one independent variable should be used to predict the variable of interest.
Unlock Deck
Unlock for access to all 69 flashcards in this deck.
Unlock Deck
k this deck
52
A poultry farmer that dabbles in statistics is interested in exploring the relationship between two types of feed,layer pellets and scratch,water,and the output of his laying hens.For ten days he records the number of ounces of layer pellets and scratch the hens consume and the number of fluid ounces of water and tracks the number of eggs that are produced.What is his regression equation based on the data?
He develops one equation based on three predictors,the scratch,pellets,and water,and another equation based only on the layer pellet consumption.The output for the two models are shown side by side.Comment on the two models and which one should be used.
He develops one equation based on three predictors,the scratch,pellets,and water,and another equation based only on the layer pellet consumption.The output for the two models are shown side by side.Comment on the two models and which one should be used. Unlock Deck
Unlock for access to all 69 flashcards in this deck.
Unlock Deck
k this deck
53
Demand was low two years ago but increased sharply last year thanks to an aggressive marketing campaign.A time series model that puts the greatest emphasis on the most recent period is probably the best choice to predict next year's demand.
Unlock Deck
Unlock for access to all 69 flashcards in this deck.
Unlock Deck
k this deck
54
Models that predict demand based upon some independent factor(s)other than time are ________ forecasting models.
Unlock Deck
Unlock for access to all 69 flashcards in this deck.
Unlock Deck
k this deck
55
A poultry farmer that dabbles in statistics is interested in exploring the relationship between layer pellets and the output of his laying hens.For ten days he records the number of ounces of layer pellets and the number of eggs that are produced.What is his regression equation based on the data?
A) Eggs = 11.3 + 0.42Pellets
B) Eggs = 1.25 + 0.29Pellets
C) Eggs = 10.9 + 0.23Pellets
D) Eggs = 4.22 + 0.67Pellets
A) Eggs = 11.3 + 0.42Pellets
B) Eggs = 1.25 + 0.29Pellets
C) Eggs = 10.9 + 0.23Pellets
D) Eggs = 4.22 + 0.67Pellets
Unlock Deck
Unlock for access to all 69 flashcards in this deck.
Unlock Deck
k this deck
56
The tracking signal calculated for the first forecast is always either +1 or -1.
Unlock Deck
Unlock for access to all 69 flashcards in this deck.
Unlock Deck
k this deck
57
A poultry farmer that dabbles in statistics is interested in exploring the relationship between two types of feed,layer pellets and scratch,water,and the output of his laying hens.For ten days he records the number of ounces of layer pellets and scratch the hens consume and the number of fluid ounces of water and tracks the number of eggs that are produced.What is his regression equation based on the data?
Unlock Deck
Unlock for access to all 69 flashcards in this deck.
Unlock Deck
k this deck
58
A model with a positive mean forecast error suggests that,on average,the model underforecasts.
Unlock Deck
Unlock for access to all 69 flashcards in this deck.
Unlock Deck
k this deck
59
Which of these forecasts is the BEST?
A) the one with a MAD of zero
B) the one with the tracking signal of +4
C) the one with the tracking signal of -4
D) the one where the tracking signal times the MAD equals zero
A) the one with a MAD of zero
B) the one with the tracking signal of +4
C) the one with the tracking signal of -4
D) the one where the tracking signal times the MAD equals zero
Unlock Deck
Unlock for access to all 69 flashcards in this deck.
Unlock Deck
k this deck
60
Nora Damus reviews her forecasting triumphs and failures as part of her annual report to the Chief Operating Officer.She notes that her monthly forecast for batteries has a mean forecast error of 20,and a mean absolute deviation of 20.Which of the following statements about her forecast is BEST?
A) Nora has miscalculated her mean forecast error.
B) Nora has miscalculated her mean absolute deviation.
C) Nora has a negative tracking signal.
D) Nora has a positive tracking signal.
A) Nora has miscalculated her mean forecast error.
B) Nora has miscalculated her mean absolute deviation.
C) Nora has a negative tracking signal.
D) Nora has a positive tracking signal.
Unlock Deck
Unlock for access to all 69 flashcards in this deck.
Unlock Deck
k this deck
61
In order to indicate ________ in a forecast model,you should use the mean forecast error approach rather than the mean absolute deviation approach.
Unlock Deck
Unlock for access to all 69 flashcards in this deck.
Unlock Deck
k this deck
62
Supply chain partners might use a(n)________ to develop joint sales and operations plans and projections of output if they have agreed on a common set of objectives.
Unlock Deck
Unlock for access to all 69 flashcards in this deck.
Unlock Deck
k this deck
63
What distinguishes collaborative planning,forecasting,and replenishment (CPFR)systems from traditional planning approaches is the emphasis on forecasting.
Unlock Deck
Unlock for access to all 69 flashcards in this deck.
Unlock Deck
k this deck
64
What is a collaborative planning,forecasting,and replenishment system and how might it benefit those who choose to use it?
Unlock Deck
Unlock for access to all 69 flashcards in this deck.
Unlock Deck
k this deck
65
A counseling service records the number of calls to their hotline for the last year.Based on MAD,which of these models does the best job of forecasting?
A) A simple moving average of three periods
B) A simple moving average of five periods
C) A weighted moving average of .7, .2, .1
D) A weighted moving average of .5, .2, .2, .1
A) A simple moving average of three periods
B) A simple moving average of five periods
C) A weighted moving average of .7, .2, .1
D) A weighted moving average of .5, .2, .2, .1
Unlock Deck
Unlock for access to all 69 flashcards in this deck.
Unlock Deck
k this deck
66
A forecaster is assessing two different models for demand.The output from each model and the actual demand data appear in the table.Use MAD and a tracking signal to compare the two models.Which model does a better job of forecasting?
Unlock Deck
Unlock for access to all 69 flashcards in this deck.
Unlock Deck
k this deck
67
A tracking signal value between ________ and ________ would suggest that the forecasting technique in use is appropriate.
Unlock Deck
Unlock for access to all 69 flashcards in this deck.
Unlock Deck
k this deck
68
A collaborative planning,forecasting and replenishment system eliminates the need for forecasting.
Unlock Deck
Unlock for access to all 69 flashcards in this deck.
Unlock Deck
k this deck
69
Which one of the following statements regarding collaborative planning,forecasting,and replenishment (CPFR)systems is best?
A) In CPFR, each business develops a sales and operations plan and the mainframe system reconciles these plans to find a middle ground that all businesses work towards.
B) CPFR is a set of business processes.
C) CPFR has the Project Management Body of Knowledge (PMBOK©) as its basis.
D) Studies have demonstrated that manual, paper-based CPFR systems are more responsive and more accurate than computer-based CPFR systems.
Unlock Deck
Unlock for access to all 69 flashcards in this deck.
Unlock Deck
k this deck
Unlock Deck
Unlock for access to all 69 flashcards in this deck.


